Basics- Stock Market Investing
___________________________________________________________________________________
Investment Basics
There are two primary ways to beat the market: 1) Market timing and 2) Security selection.
If you’ve bought solid companies, the best advice is often “don’t just do something, sit there.”
Once you factor in taxes on your growth, you need your investments to make ~6% just to stay ahead of inflation.
Beware Irrational Market Behaviors; overconfidence, biased judgements, herd mentality, and loss aversion.
Stock (Equity): Ownership in a company. Companies sell stocks to raise money for R&D, inventory, expansion, &c.
Bond: Money lent to a company in return for a guaranteed ROI.
Trading: Buying or selling of stocks.
Total Return = Capital Appreciation + Dividend.
___________________________________________________________________________________
Buying & Selling
Open an online brokerage account.
Research which stocks you’d like to buy.
Fundamental Analysis: Stock market trading that examines the information about a company’s health and its potential to succeed.
Technical Analysis: Stock market trading via the interpreting of stock charts. The main measurement used to gauge demand is trading volume. After that, they look at trend charts, volatility, and small price movements.
Growth Investing: Investors who look for large profitable companies that will continue to rise over the long term; buy high, sell higher.
Ideal Growth Strategy: Market Cap >$200M, a P/S < 1.5, earnings higher than the previous year, a 3m and 6m price appreciation greater than average.
Value Investing: Investors who look for cheap stocks that are at the bottom of an uphill climb; buy low, sell high.
Ideal Value Strategy: Market Cap > average, more common shares outstanding than average, CPS > average, sales at least 50% > average.
Stock Research: Take a look at your last few credit card statements- where do you repeatedly spend money?
Execute trades in your account.
Market Order: Immediate purchase or sale of a stock or bond. It instructs your broker to buy a security at the current ask price, which is whatever the stock is trading for when the order reaches the floor.
Limit Order: Enables the buyer to specify the price at which you want to buy and sell stocks, along with the time frame. It instructs your broker to buy or sell a security at a price you specify or better. When you place a limit order, it is either a day order or a good-til-cancelled (GTC) order.
Stop Order: A stop order becomes a market order when a price you specify is reached. Like limit orders, stop orders are either good for the day or good til cancelled. If you own a stock and instruct your broker to sell it at a price lower than it currently trades for, that’s called a stop loss because you’re stopping your potential loss and protecting the profit you’ve already gained. You can use a stop order in the other direction too.
Stop Limit Orders: Specifying the price at which you want a stop order to kick in. Then you specify the price at which you want the limit order to trade.
Bid: The price you get when you sell the stock.
Ask: The price you pay when you buy the stock.
Spread = Ask- Bid.
Automate your strategy and keep buying more of what’s working.
Think carefully about when to sell your stocks.
EXAMPLE: Garmin is selling at $15.50 per share. You want to buy 100 shares if it starts moving upward considerably. You could place a stop order at $17. That means that if Garmin suddenly spikes up to $19, your stop order will become a market order to buy 100 shares. If the price is moving quickly, the order might not go through until Garmin asks $18. Perhaps that’s fine with you because you just want to pick up your shares when the stock breaks out. It's more important that you actually buy the 100 shares than it is to buy them at a specific price. On the other hand, it might annoy you to pay more for Garmin than you think its worth. You still want to buy 100 shares if it starts moving up. You could place a stop limit order with the stop at $17 and the limit is $17.50. If the stock hits $17, your stop order becomes a limit order to buy 100 shares at $17.50 or better. If your broker can only get $18, the order won't execute. Once you buy your 100 shares, let's think positive and say they rise to $30. You don’t want to lose the profits you’ve already gained, so you place a stop loss at $28. If Garmin hits the skids and plummets to $18, your order will kick in at $28 and sell at the next opportunity, which might be lower than $28. That really bugs you, so on further consideration you decide to cancel the stop order and replace it with a stop limit order with a stop at $28 and a limit at $28 as well. Now if Garmin plummets to $18, you might go with it. Why? Because your limit order to sell at $28 or better won't kick in if the price hits $28 and immediately falls lower without ever coming back up. Know what you want to do and place the right kind of order.
Notional Investment Strategy
Keep a list of 10-20 companies that are selling stocks and ideally, that you know and use.
Look for low daily dollar volume of <$3M (Daily Dollar Value = Stocks avg Daily Trading Vol x Share Price).
Look for companies with strong financials: high net profit margins, lots of cash on hand, little or no debt.
Look for companies with increasing sales per share, increasing cash flow per share, EPS > 5y ago (ideally >85), high Div Yield, High ROE, 15% inside ownership with stock buyback, high net profit margin.
Update every quarter.
Popular Dow Investment Strategies
Dow 10: Invest equally in the top 10 Dow stocks.
Dow High 5: Invest equally in the top 5 Dow stocks.
Dow Low 5: Invest equally in the bottom 5 Dow stocks.
Dow 4: Invest 40% on 2 stocks and invest 20% on stocks 3, 4, 5 (historically the best).
___________________________________________________________________________________
Stock Metrics
Beta: A numerical description of systematic risk. The Broad market is assigned a beta of 1. If a stock has a Beta of 2, then on average, it swings twice as far as the market. If the Market goes up 10%, the stock with a beta of 2 tends to rise 20%. The higher the beta, the more aggressive and volatile the stock.
Cash Flow per Share (CFS): Company’s cash flow / # share outstanding; the price you pay for a share of the company’s cash flow. Look for positive and increasing CFS/yr.
Current Ratio (CR): Current Assets / Current Liabilities; the ability of a company to pay its short-term bills. Look for a high CR of at least 2:1.
Dividend Yield: Company’s annual cash dividend / current stock price; how much a company pays its shareholders for owning a share of its stock. Look for high dividend yields.
Earnings Per Share (EPS): Company’s earnings / # stock shares outstanding. Look for positive and increasing EPS/yr, generally >85.
Insider Ownership: Level of stock ownership owned by the company and its employees. Higher is better.
Market Cap: # outstanding shares * current stock price.
Max and Min Comparison: A comparison of a stocks projected maximum and minimum percentage gains. Look for an increase from stock’s current price.
Net Profit Margin: The money a company has leftover after paying its expenses divided by the money it had before paying expenses. Look for companies with a net profit margin in the top 20% of their industry.
Price/Book Ratio: The comparison of a stock’s current price to how much the stock is worth if the company was liquidated. Look for a price/book ratio <1.
Price to Earnings (PE) Ratio: Stock Price / EPS for the last yr. PE should equal the growth rate of the company. If the PE of Coke is 15, you’d expect the company to be growing at 15% a year. But if the PE ratio is less than the growth rate, you may have found yourself a bargain. A company, say, with a growth rate of 12% a year and a PE ratio of 6 is a very attractive prospect. In general, a PE ratio that’s half the growth rate is very positive, and one that’s twice the growth rate is very negative. The current PE should be at or below the 5 yr avg PE.
Price to Sales Ratio (PS, PSR): Current Stock Price / Sales per Share; how much you’re paying for each dollar of a company’s sales. The company’s total market value divided by its most recent yr of sales revenue; the price per share divided by the sales per share. If there are 1M shares of GRMN outstanding and the current price is $30/share, then GRMN has a total market value of $30M. If GRMN has sales of $15M in the past 4 quarters, its PSR is 2. Look for a PSR < 1.5.
Projected Stock Value: The forecasted value of the stock. Higher is better.
Quick Ratio (QR): (Cash + Cash Assets) / Current Liabilities; evaluates a company’s short-term liquidity; a company’s ability to deal with short term needs. Look for high quick ratios of at least .5.
Return on Equity (ROE): Company’s Net Income / Total Shareholders’ Equity; what a company has earned with the money people have invested in it. Look for an ROE >20%.
Relative Price Strength: Shows how a stock’s price has performed compared to the price of all other stocks on a scale of 1-99. Stocks that rank 90 have outperformed 90% of all other stocks.
Sales and Earnings Gain (5yr): Company growth over a 5y period. Look for >10% for large companies, >15% for medium size companies, and >20% for small companies. Stock Buyback: The number of stocks being purchased by the company. Higher is better.
S&P STARS/FAIR VALUE: Predicts a stock’s potential over the next 12 months. STARS stands for Stock Appreciation Ranking System, and classifies stocks from 1 to 5, with 5 being the best. Fair Value is a rank of the stock’s recent trading price compared to what S&P considers its fair value. That means stocks with a Fair value rank of 5 are the most undervalued- bargains- and stocks with a fair value rank of 1 are overvalued- rip-offs. Look for stocks that rank 5 with a fair value of 5.
YTD% Change: A stocks percentage price change since 1 Jan (or its IPO).
___________________________________________________________________________________
Misc Quotes
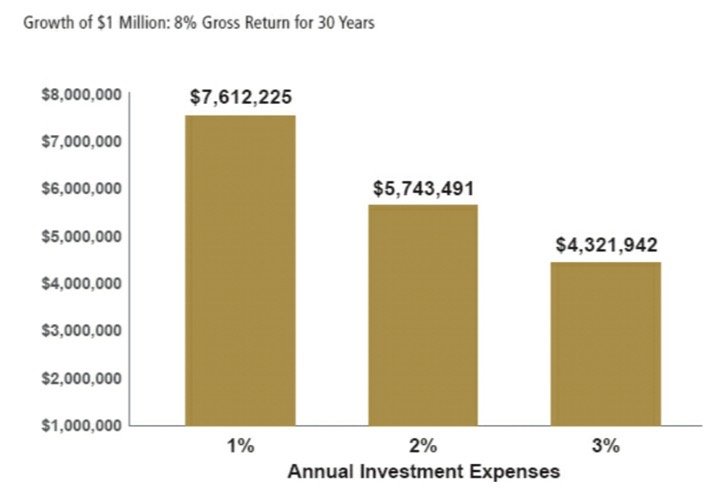
“Consumer Reports simulated what to do with an extra $100 per month, comparing the benefits of prepaying your mortgage versus investing in an index fund that returned 8%. Over a 20y period, the fund won every time.”
___________________________________________________________________________________
Terminology
Credit Risk: The risk that a company’s credit quality could wane and you, as a bondholder, could lose some or all of your investment.
Efficient Markets Hypothesis: No investor will consistently beat the market over long periods except by chance.
Futures/Options: The futures and options market allow bankers and investors to profit from movements in the markets of commodities without actually having to own the product.
Index: A composite of companies created by a stock firm in an attempt to monitor the progress of a market.
Dow Jones Industrial Average (DJIA): The composite of the 30 most powerful companies in the USA.
S&P 500 Index (‘the Market’): The most common benchmark for US Stock investors.
Inflation Risk: Portfolio loss due to inflation; one of the most significant risks for investors.
Leveraged Buyout (LBO): the purchase of a company using debt, or leverage.
Leveraging: An investment technique that magnifies an investment's return with borrowed money and options. Both gains and losses are magnified.
Market Risk: The non-diversifiable risk inherent in any securities market.
Maturity Risk: Longer-term bonds have more risk (and price volatility) than shorter-term bonds.
Rule of 72: Earned Interest Rate divided by 72 = the number of years it takes to double your money.
Stock (Securities) Exchange: An exchange where stockbrokers and traders can buy and sell securities.
American Stock Exchange (AMEX, ASE): Lists smaller companies
National Association of Securities Dealers Automated Quotation System (NASDAQ, OTC): Highly traded market these days that has become more prominent by trading cool high tech companies like Microsoft, Intuit, and Dell.
New York Stock Exchange (NYSE): America’s oldest of the big 3 exchanges; caters to well established companies.
___________________________________________________________________________________
---Advice from the Experts---
___________________________________________________________________________________
Ben Graham
Buy stocks at prices at or lower than their business valuations (because they are on sale); price/book ratios should be around 1 and the P/E should be less than 15.
Margin of Safety = Business- Market Valuation. The bigger the margin of safety, the better.
Buy stock for no more than 2/3 of its book value (A stock's price/book ratio should be no more than .66).
Business Valuation: The stock’s book value and its earning.
Book Value = Company’s Assets / # Stock Shares Outstanding.
Market Valuation: What the stock is trading for.
___________________________________________________________________________________
Phillip Fisher
Focus your portfolio on a few different stocks (ideally <10).
Know a company’s profit margin.
Look for positive cash flow and a healthy cash reserve.
___________________________________________________________________________________
Warren Buffet
Day trading is worthless.
Buy quality companies and hold for the long term.
Pay attention to ROE.
A company’s net profit margin = Money left over after paying all its expenses / the money it had before paying expenses. So, if a company makes $1 million and pays $900,000 in expenses, its net profit margin is 10%.
Compare the value to the price and determine the margin of safety.
Examine businesses, not stock prices, and buy at bargain prices.
Ignore the stock market because its fickle. Never speculate about the direction of prices. Look instead at individual companies and what makes them superb.
Focus your portfolio on a few good companies. Concentrating on good stocks is safer than diversifying across the mediocre ones.
Just as a business puts more money into its most successful ventures, you should invest more money in your stocks that are performing well.
___________________________________________________________________________________
Peter Lynch
Look around you, what companies do you use the most? Invest where you already spend most of your time.
Once you know the size of your company's, divide them into 6 categories; slow growers, stalwarts, cyclical, fast growers, turnarounds, and asset plays.
Slow Growers: Large, old companies that used to be small, your companies- expect them to barely outpace inflation but to pay a good dividend.
Stalwarts: Large, old companies, but they’re still growing strong, i.e., Coca Cola
Cyclicals: Companies whose fortune rise and fall along with the economy, i.e., Airlines and steel companies.
Fast Growers: Small, young companies that grow at >20% per year.
Turnarounds: Good companies that have been beaten down.
Asset Plays: Companies with something valuable that wall street missed.
A company’s PE ratio should equal its earnings growth rate. If the PE of Coca-Cola is 15, you’d expect the company to be growing at about 15% a year. But if the PE is less than the growth rate, you may have found yourself a bargain.
EXAMPLE: Coca-Cola is selling at the low end of its PE range. The stock hasn’t gone anywhere for 2 years. The company has improved itself in several ways. It sold half its interest in Columbia Pictures to the public. Diet drinks have sped up the growth rate dramatically. Last year the Japanese drank 36% more cokes than they did the year before, and the Spanish upped their consumption by 26%. That’s phenomenal progress. Foreign sales are excellent in general. Through a separate stock offering, Coca-Cola enterprises, the company has bought out many of its independent regional distributors. Now the company has better control over distribution and domestic sales. Because of these factors, Coca-Cola may do better than people think.
___________________________________________________________________________________
Ben Miller
Just as a business puts more money into its most successful ventures, you should invest more money in your stocks that are performing well.
Look ahead at a stock's value. For instance, if a stock’s PE ratio has averaged 20 for the last 10 years but it's now 15, it's historically cheap.
If forced to distill his definition of a bargain stock down to a single measurement, Miller would likely choose a cheap present value of future free cash flow. To him, that factor has it all. It trumps low PE ratios, low price-book-ratios, low everything else. If you can buy future free cash flow at a cheap price, you found yourself a bargain.
One of the most important metrics we focus on is free cash flow- the ability to generate it and what it yields: that is, free cash flow per share divided by the stock price.
Don’t just do something, sit there.
Buy more when the price drops.
Find bargains by comparing a stock's price with its future prospects. Use the present value of future free cash flow to determine whether a stock is a bargain.
___________________________________________________________________________________