Ecology in Action by Singer
Ref: Fred Singer (2016). Ecology in Action. Cambridge.
___________________________________________________________________
Summary
A strong conceptual foundation of core areas of ecology—giving significant attention to evolution and behavior—and the analysis and data interpretation scientists perform. The text is underpinned by the ideas of historical thought and developing students’ independent thinking. Early classic studies and modern cutting-edge studies are linked to understand how ideas are generated and how they evolve. Various theoretical and experimental (quantitative) questions through the text promote analytical and critical thinking (Cambridge).
___________________________________________________________________
Part I: Introduction and the Physical Environment
___________________________________________________________________
Ch 1: What is Ecology in Action?
Ecology: The scientific study of the distribution and abundance of life; differs from ESP in that ESP requires the study of ethics and values. Ecology attempts to describe and predict the distribution and abundance of organisms. Basic questions of ecology:
What is the abundance of a population? Or, how many individuals are there in the population?
What is the distribution of the population? Or, where are the individuals actually located in space and time?
How do interactions with the environment influence the distribution and abundance of organisms?
What is the population size? What is the change in the population size over time? What is the rate of change in the population size?
Ecological Maxims
What effects one organism or place can affect other organisms as well.
Everything goes somewhere. There is no away into which waste materials disappear.
No population can increase in size forever.
There is no free lunch. An organism’s energy and resources are finite, and increasing inputs into one ruction (such as reproduction) results in a trade-off in which there is a loss for other functions (such as growth).
Evolution matters. Organisms evolve or change over time.
Time matters. Ecosystems change over time.
Space Matters. Organisms are simultaneously influenced by processes acting at multiple spatial scales, from local to regional to global.
Life would be impossible without species interactions. Species depend on one another for energy, nutrients, and habitat.
___________________________________________________________________
Ch 2: The Physical Environment
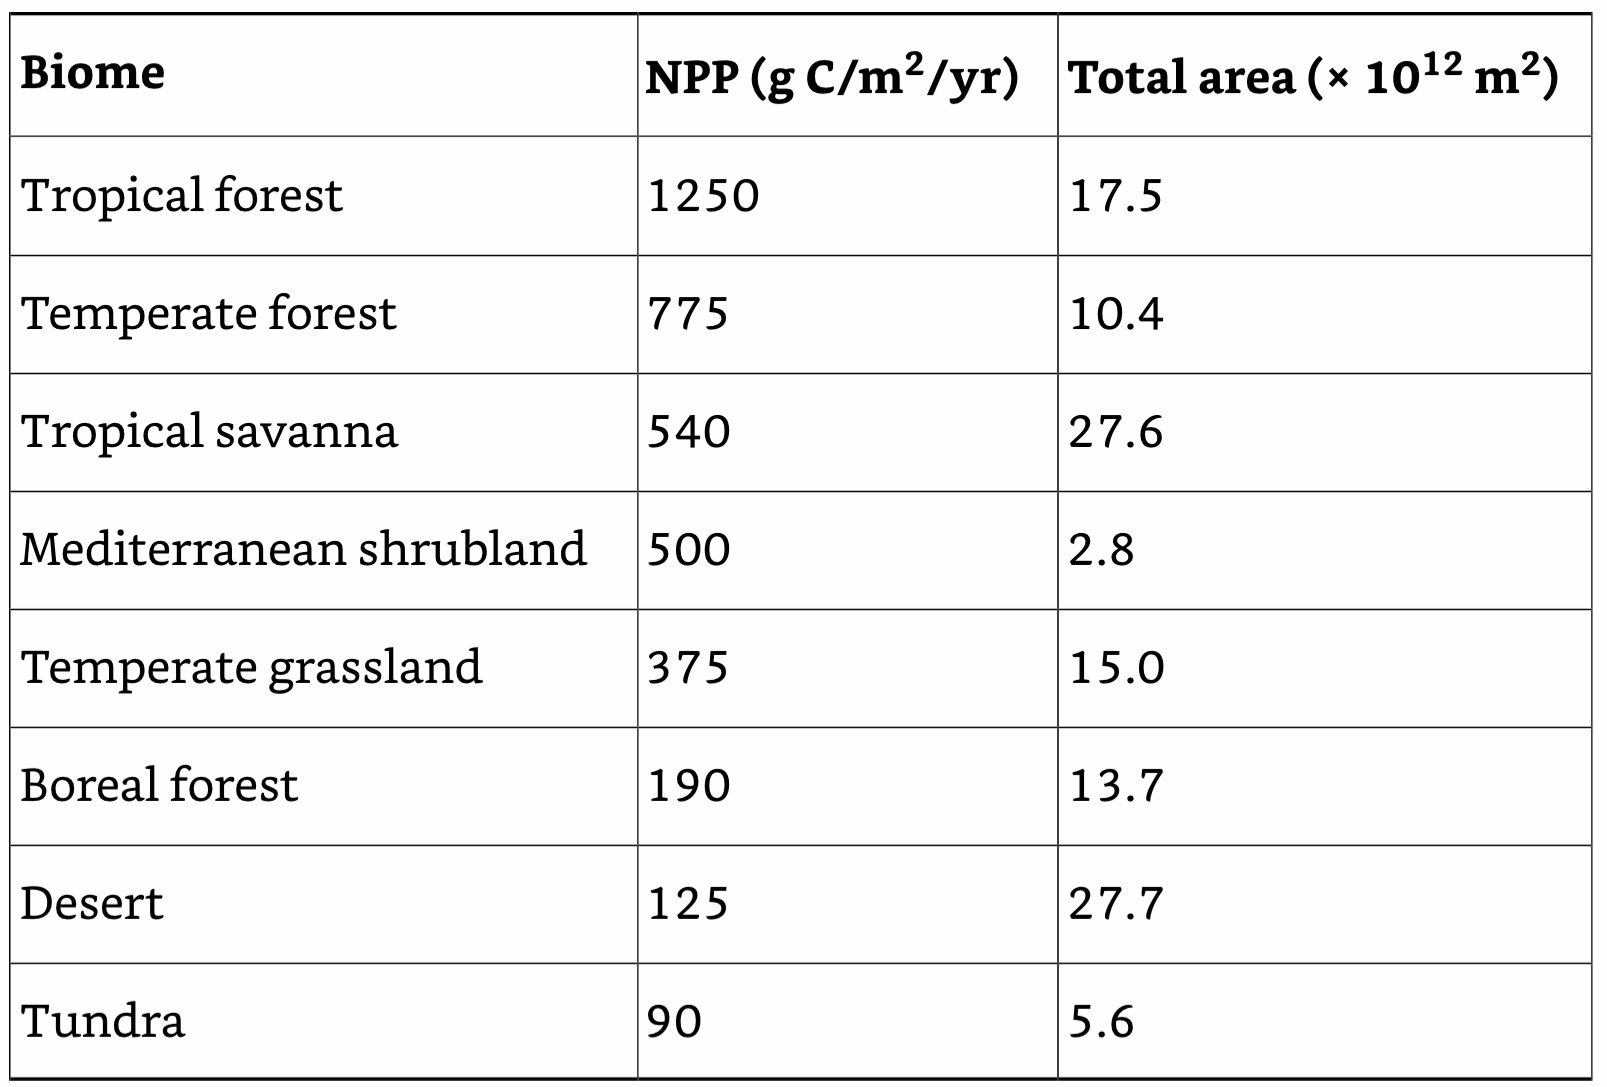
Earth’s Biomes: Large geographical areas with characteristic groups of organisms adapted to that particular environment.
Aquatic Biomes: Influenced by salinity, current, depth, temperature, water chemical composition, and water current; includes rivers, lakes, open ocean, coral reef, kelp forests, mangrove forests, salt marshes, estuaries.
Coral Reefs: Coral + Zooxanthellae (photosynthetic algae). Corals provide zooxanthellae with a secure place to live and a steady supply of nitrogenous waste to fuel their metabolism. In return, zooxanthellae share with the corals some of the organic compounds they construct from photosynthesis
High ocean temperatures are associated with corals ejecting their symbiotic zooxanthellae, which leads to the death of the coral and the appearance of bleaching.
Coral reefs are undergoing biodiversity loss to ocean acidification.
Lakes: Classified according to their nutrient status and consequent level of production.
Oligotrophic Lake: A lake with low levels of nutrients and is relatively unproductive.
Eutrophic Lake: A lake with high levels of nutrients and is much more productive.
Some lakes, both natural and artificial, tend to become shallower as nutrient-rich sediments drain into the lake and accumulate on the lake bottom. Over time, these lakes may transition from oligotrophic to eutrophic, particularly if the sediments have high levels of P. Desert lakes, as we saw earlier, can transition from freshwater to saline.
Terrestrial Biomes: Influenced by temperature, moisture, and soils; tropics, deserts, tundra.
Tropical Biomes: Undergoing biodiversity loss to acid deposition.
Human Biomes: Dense settlements, villages, croplands, rangelands, inhabited forest, uninhabited wildland.
Global Weather Patterns
Solar Energy: In almost every respect, the Sun is the primary driver of life on Earth. Photons – particles or waves of solar radiation – stream into space in all directions. Though only a miniscule fraction of these photons are intercepted by Earth’s atmosphere, enough radiation penetrates to Earth’s surface to support most ecosystems. Though the Sun is an unbiased emitter, showing no favor in the direction it sends its photons, Earth’s curvature makes the planet a very biased receiver, favoring some latitudes over others.
Intertropical Convergence Zone (ITCZ): Direct solar radiation strikes the equator causing a rise in hot air mass which cools as it rises. Because cool air holds less water than hot air, the water vapor molecules condense, forming clouds and ultimately producing the heavy rains characteristic of equatorial regions.
Tropic of Capricorn/Cancer: At around 30° latitude, north and south, this air mass, now much cooler, begins its descent toward the surface from the upper troposphere. As it descends, it warms, and because it has already lost much of its moisture on its ascent near the equator, it tends to create a very dry environment at this latitude. Many of the world’s great deserts are found at about 30° latitude. Now at the surface, some of this dry air mass flows toward the equator, completing a cell of circulating air known as the Hadley cell, and the rest flows away from the equator, forming the surface component of a second circulatory cell, the Ferrel cell.
If you are having trouble visualizing this, you should do the following experiment. Grab a ball and a marker pen. Circumscribe the ball at the approximate locations of the equator, 30° N, and 30° S, to mark the outlines of the two Hadley cells. Rotate the ball from west to east along the equatorial plane. If you view it from above, you will notice it is rotating counterclockwise, but if you view it from below, you will note it is rotating in a clockwise direction. Thus, the direction of rotation is a matter of perspective. While rotating your ball, draw a line due south from 30° N to the equator. You will note that your “line” is actually a curve that is deflected to the right, analogous to the northeast trade winds in the north Hadley cell.
Water has a very high specific heat – it takes about 4.2 J of energy to heat 1 cc (= 1 ml) of water 1°C, while an equivalent piece of land, depending on its composition, would generally require only 10–30% as much solar energy. As water cools down to 4°C, its density increases.
El Nino/La Nina: During one phase of ENSO, the sea surface temperature increases and atmospheric temperature decreases near the west coast of South America, spawning heavy rains across much of the Americas and Western Europe, and drought in Africa and Australia. In the opposing phase (La Niña), the sea surface temperature decreases and atmospheric temperature increases near the west coast of South America, bringing drought to much of the Americas and Western Europe, and heavy rains to Africa and Australia.
El Nino: When T rises .5d Celsius for three consecutive months with corresponding rainfall shifts (the cycle is approximately 2-7 years).
La Niña: Caused by a buildup of unusually cool subsurface waters in the tropical Pacific, which are brought to the surface by strong currents in areas of upwelling. This brings regional cooling and increased rainfall to many locations.
___________________________________________________________________
Part II: Evolutionary and Organismal Ecology
___________________________________________________________________
Ch 3: Evolution and Adaptation
Genome: A sequence of nitrogenous bases identifies the DNA and RNA, while the sequence of amino acids identifies a protein. These sequences are extraordinarily long; for example, the human genome is approximately 3 billion base pairs long.
Nucleic acids and proteins are very long polymers- molecules composed of repeating subunits.
The same gene may have a similar function in even distantly related species.
Genetic Evolution: Change in the frequency of alleles of a gene over time. There are four processes that can cause allele frequencies to change over time: 1) gene flow, 2) genetic drift, 3) mutation, and 4) natural selection. Natural selection is the only evolutionary process that can lead to adaptation.
Gene Flow: The successful movement of alleles from one population to another. Caused by emigration (from a population) and immigration (to a population).
Genetic Drift: A change in allele frequency within a population from chance events. Genetic drift is a much more important mechanism of evolutionary change in small populations than it is in large populations.
Mutation: A random change in the base sequence of genetic material. In the case of asexual single-celled organisms, such as bacteria and many protists, mutations are transmitted to offspring when the organism undergoes binary fission to produce two daughter cells. In multicellular organisms, mutations are only transmitted to offspring if they occur in the cells that ultimately produce offspring. Because they are relatively rare events, mutations have a negligible direct effect on allele frequencies. However, mutations are essential to evolution because they introduce new combinations of genetic material into the population.
Compensatory mutations are an important public health problem because they reduce or eliminate the costs of resistance incurred by antibiotic-resistant bacteria, allowing these bacteria to proliferate.
Coevolution: A process in which interactions between species lead to reciprocal adaptation.
Natural Selection: The passing of a heritable traits that influences an individual’s ability to survive through reproduction. Individuals with a trait that improves their ability to survive or reproduce in their environment will leave more offspring than individuals lacking this trait.
Natural selection favors the evolution of traits that improve reproductive success by enhancing an individual's success at finding and acquiring food, processing and storing food efficiently, and also not becoming someone else's food.
Adaptation: A trait that increases an individual's reproductive success in a particular environment in comparison to individuals without that trait. Consequently, alleles that code for adaptive traits will tend to increase in frequency over generations of natural selection.
Directional Selection: Natural selection favors the evolution of one extreme phenotype, such that the mean phenotype shifts in one direction along a range of phenotypes. Directional selection is the most common form of natural selection leading to adaptive evolutionary change.
Fitness: An estimate of an individual’s reproductive success- the number of genetic offspring an individual produce that survive until reproductive age.
Sexual Selection: Arises when “individual males have had, in successive generations, some slight advantage over other males in their weapons, means of defense, or charms, and have transmitted these advantages to their male offspring.”
Intrasexual Selection: Differential mating success among individuals of one sex arising from competition among individuals of the same sex.
Intersexual Selection: Differential mating success among individuals of one sex arising from interactions with individuals of the opposite sex.
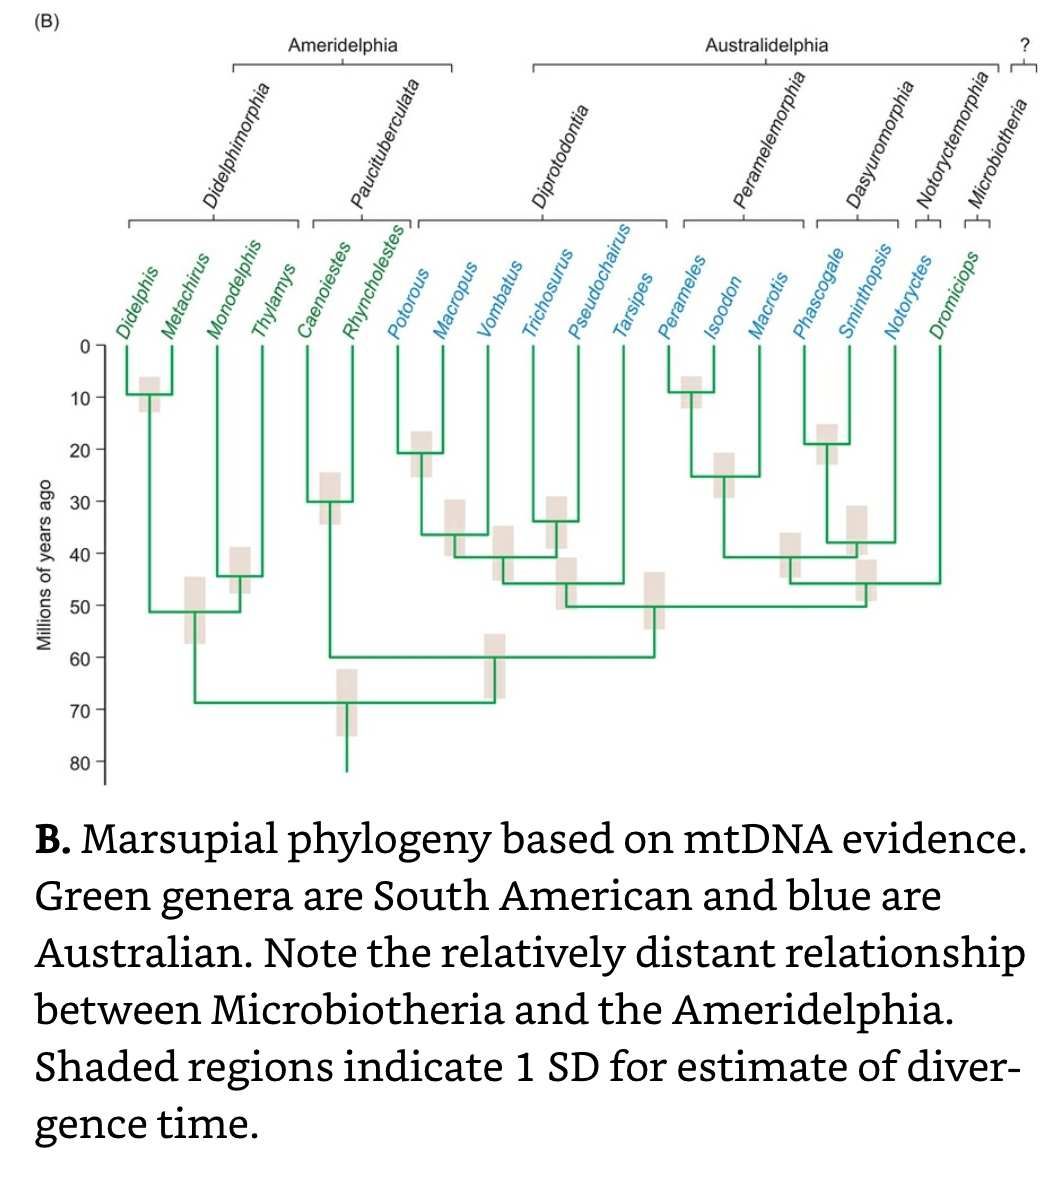
Speciation: Creation of distinct species via genetic evolution.
Allopatric Speciation: The most commonly cited model of speciation, requires two or more populations to be geographically separated for a long enough period of time for genetic divergence to occur between populations.
Adaptive Radiation: Divergence of an ancestral species into numerous descendant species adapted to different habitats available in the new environment.
Sympatric Speciation: The formation of new species within a single geographical area.
Phylogeny: the evolutionary history of ancestry and descent of a group of related organisms.
Microsatellites: Sections of DNA that are made up of repetitive DNA base sequences of variable length surrounded by unique regions of constant length. They can be used to help resolve evolutionary relationships.
___________________________________________________________________
Ch 4: Physiological and Evolutionary Ecology of Acquiring Nutrients and Energy
Nutrients: Chemical substances that support growth, development, and reproduction.
Limit Resource: Nutrients in short supply.
It seems as if food availability is the most important driver in species abundance.
Dry-season food quality can drop to such a low level that the food-digesting bacteria within rumen die, at which point buffaloes begin to starve, even while surrounded by an ocean of grass (Sinclair).
Ecological Stoichiometry: Studies the balance of the multiple chemical substances that play roles in ecological processes. Ecologists recognize that the ratio of important elements available in the environment (for autotrophs) and in the food they eat (for heterotrophs) has a very important influence on which species can live and reproduce within a particular environment.
Homeostasis: The maintenance of a constant internal environment within an organism's cells, tissues, organs, and organ systems.
Induced Defense: Production of a defensive substance only when injured or threatened with injury.
The distribution and abundance of species is limited by the availability of nutrients and energy.
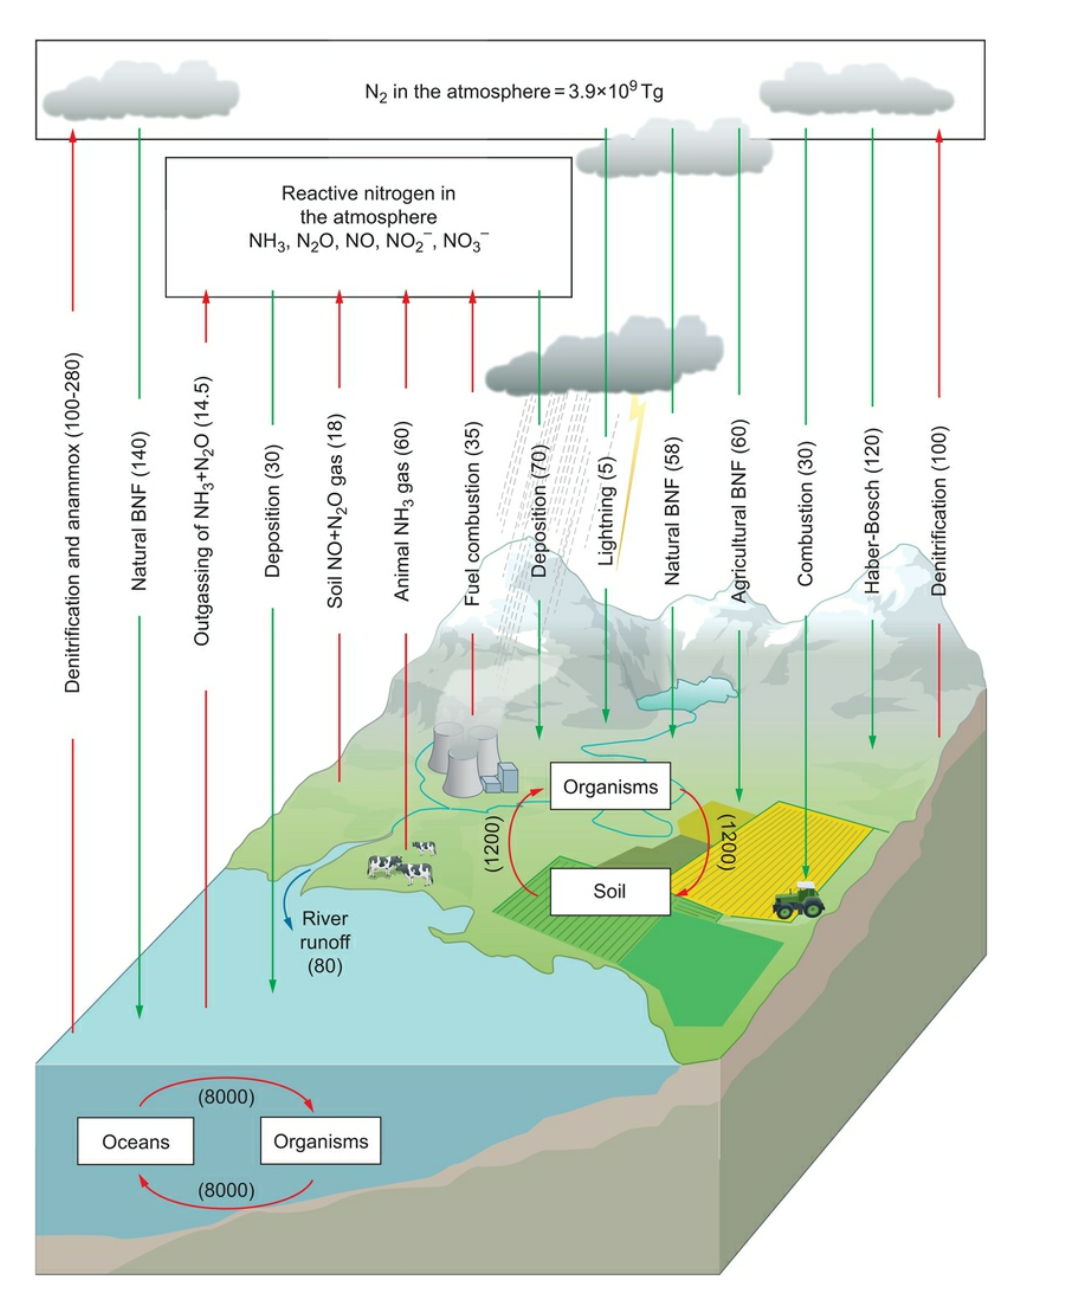
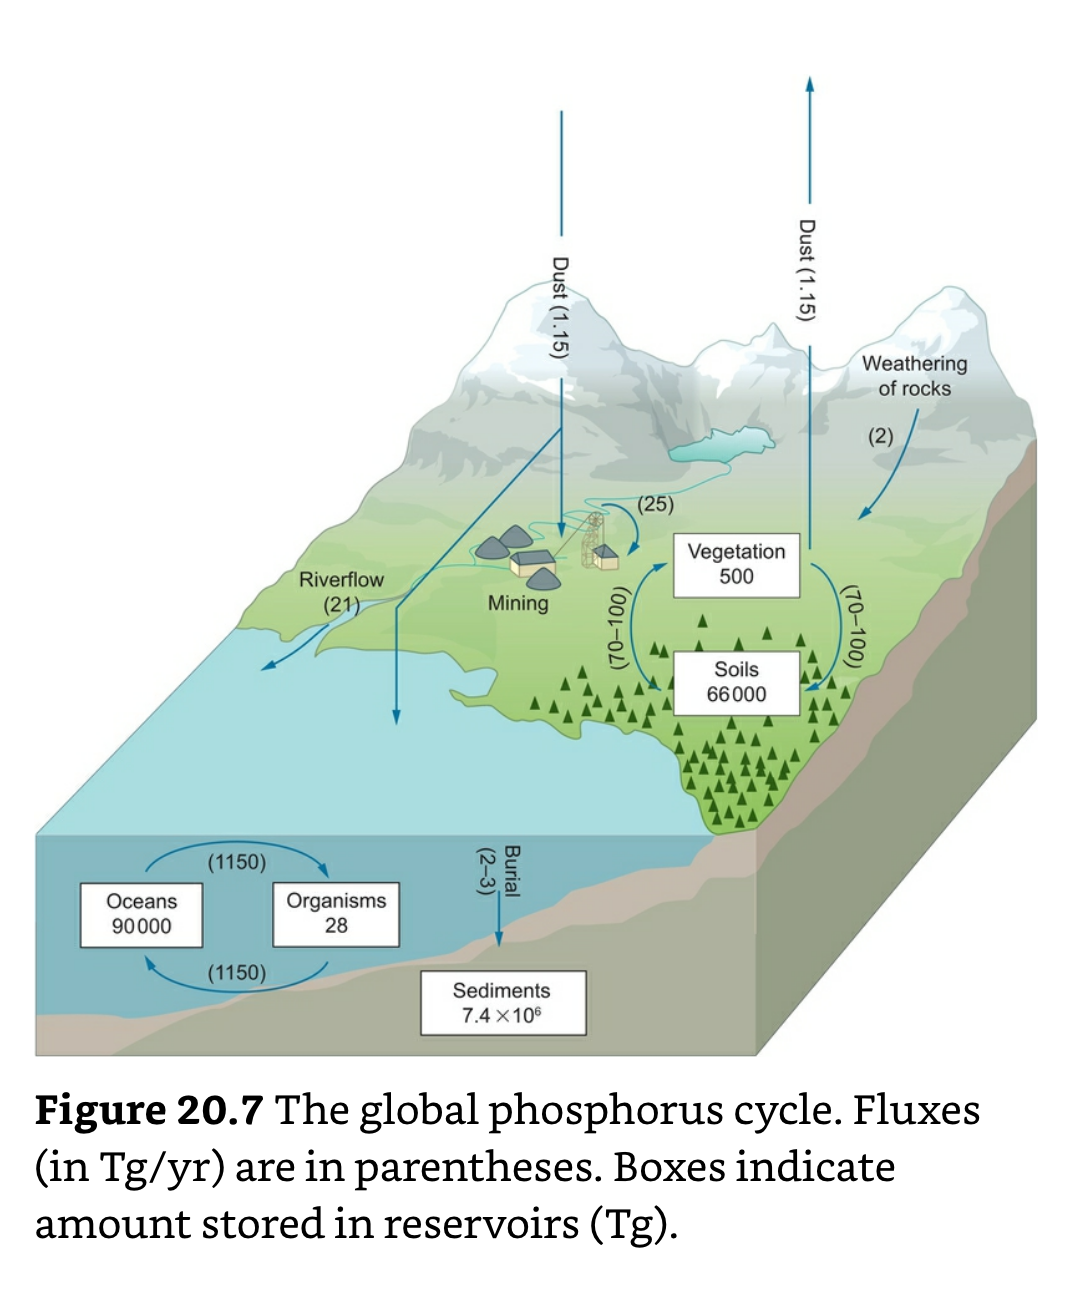
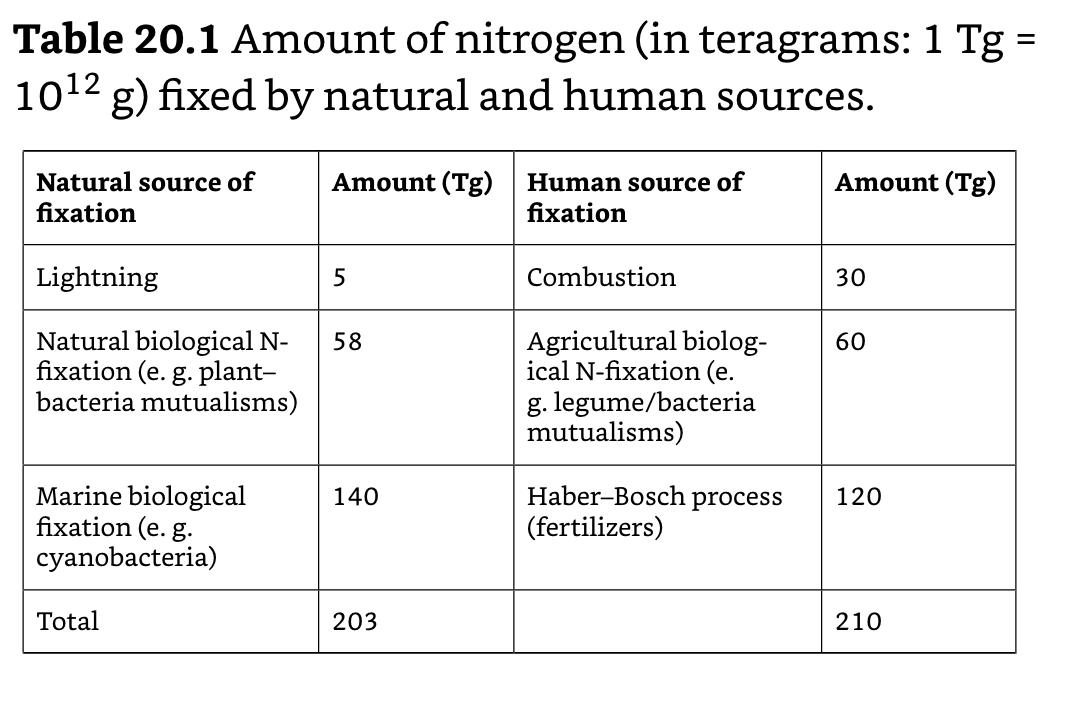
Phosphorous and Nitrogen: Both P and nitrogen are essential N for all organisms, because they are prevalent in so many types of biologically important molecules. In terrestrial plants, P and N are probably the two most common limiting nutrients.
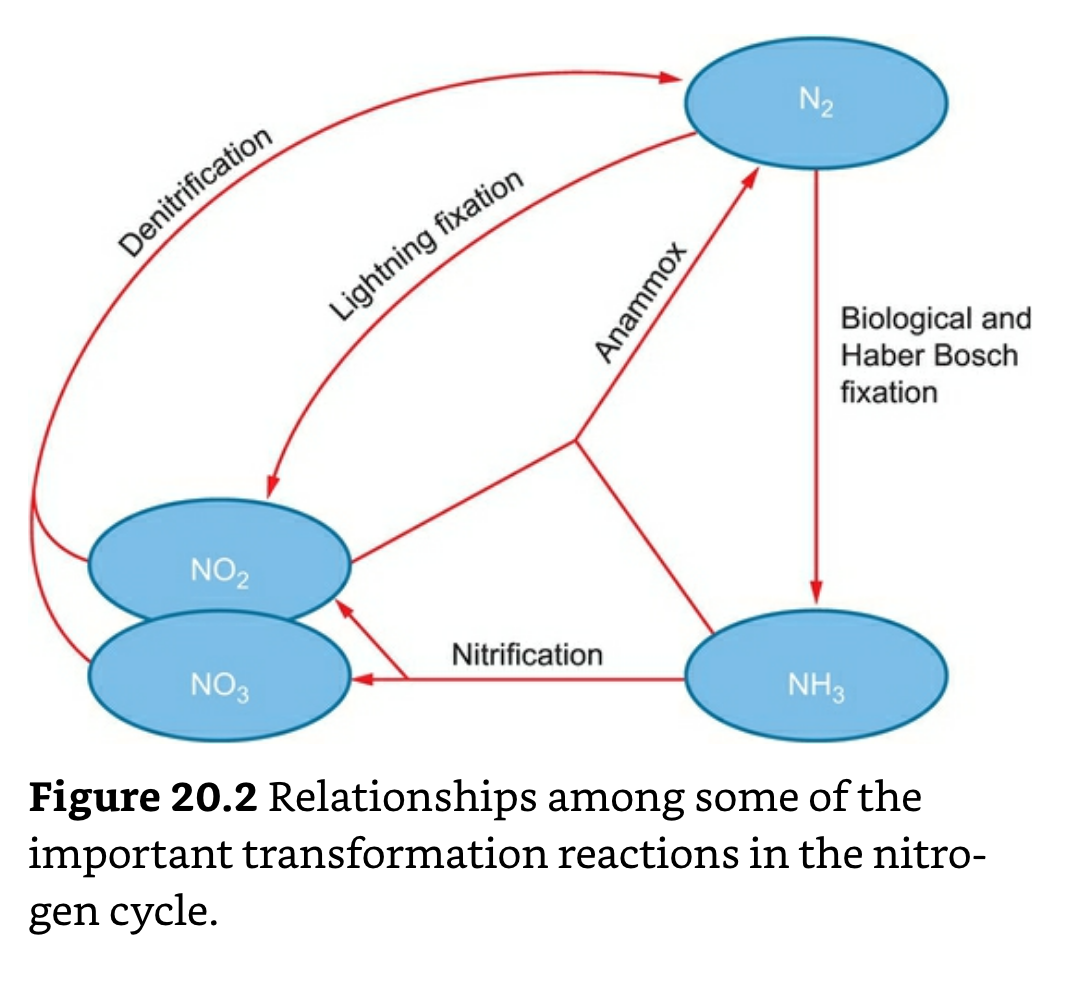
Nitrogen: N enters soils through the process of N-fixation, in which bacteria convert N gas to NH3. Once in soils, N is recycled through uptake by plants, consumption by heterotrophs, and decomposition.
Phosphorus: P enters the soils primarily through the weathering of rocks. The presence of rock, such as limestone, that is rich in P, will lead to high P soil concentrations.
Autotrophs: Organisms including phytoplankton, that synthesize complex C molecules from simple inorganic molecules. These complex C molecules can then be reassembled to synthesize other complex molecules such as proteins, nucleic acids, or fats. They may also be broken down to generate ATP to fuel metabolic processes, including the synthesis of other complex molecules.
Photosynthesis: 6CO2 + 12H2O + radiant energy → C6H12O6 (a 6C sugar) + 6H2O + 6O2 (waste product); the foundation of most ecosystems, because it converts inorganic C to energy-rich carbohydrates, which most organisms use to fuel their metabolic processes via ATP.
Transduction: The conversion of light energy to chemical bond energy, occurs at one of many photosystems – light-capturing units which comprise a central complex with two chlorophyll a molecules surrounded by 200–300 accessory pigment molecules. The chlorophyll a molecules in the central complex are closely associated with a primary electron acceptor molecule. The accessory pigment molecules include other chlorophyll molecules and carotenoids. In contrast to chlorophylls, the carotenoids are effective at absorbing green light. The net effect of numerous spectrally diverse accessory pigment molecules is that the leaf can harvest much more light than it would without these accessory pigment molecules. When light strikes an accessory pigment molecule, the energy is passed to a nearby accessory molecule, ultimately reaching a chlorophyll a molecule in the central complex. One electron of the central pair is boosted to a higher energy level, where it is captured by the special electron acceptor molecule; this is the actual act of transduction. The high-energy electron goes through a series of exergonic, or energy releasing reactions, to generate the high-energy end products of the light reactions, ATP and NADPH. Water comes into play in this process because it supplies the replacement electron to the chlorophyll a molecule that donated its electron to the primary electron acceptor molecule.
C3 Photosynthesis: Photosynthesis used by most plants; employs the Calvin cycle in the mesophyll cells of the leaf, just below the epidermal layer. Open stomata in the epidermal layer allow CO2 to diffuse into the mesophyll cells. In the fixation or carboxylation phase, CO2 from the atmosphere combines with a 5-carbon ribulose bisphosphate (RuBP) molecule to produce a six-carbon molecule, which is quickly broken down to two 3-carbon molecules of 3-phosphoglycerate (PGA). (These products are the source of the name of this type of photosynthesis.)
C4 Photosynthesis: Photosynthesis used by ~5% of all plant species, in at least 19 plant families. Under hot and dry conditions, C4 plants can partially close their stomata, reducing water loss while still importing enough CO2 into the leaf for carboxylation.
CAM Photosynthesis: Photosynthesis used by plants in which they open their stomata at night when temperatures are cool and RH is high, and close them during the day. Plant species in the succulent family Crassulaceae, and ~25 other families use CAM, which is extremely efficient in minimizing water loss.
Because they use so little water, we would expect CAM plants to be most common in very dry environments. This is true up to a point. Almost 2000 species of CAM plants are desert succulents in the family Cactaceae and Agavaceae. However, more than 20K species of CAM plants have been identified as rainforest species (Luttge 2004). This seems to fly in the face of the hypothesis that CAM photosynthesis is an adaptation to reduce water loss.
C3 plants require fewer steps and less energy to assimilate one CO2 molecule than do C4 or CAM plants. In particular, C4 and CAM plants must resynthesize PEP after the 4-carbon acids release CO2, which requires two extra ATP molecules. Consequently, at low temperatures, C3 photosynthesis has the potential to convert more CO2 into plant biomass. However, as temperatures rise and photorespiration increases, C4 plants are, overall, more efficient than C3 plants at converting CO2 into biomass, because they lose very little CO2 ad energy to photorespiration. The performance of CAM in relation to C3 plants also improves at high temperatures; however, growth rates of CAM plants may be limited by their limited storage capacity for the CO2 they take in during the night.
To survive, plants must regulate their water levels. CAM plants only open their stomata at night, so they experience substantially reduced water loss in comparison to C4 plants, which keep their stomata slightly open during the day. Both CAM and C4 plants have substantially reduced water loss in comparison to C3 plants, which need stomata open to maintain high photosynthetic rates.
C3 plants, which are most abundant, live in areas with sufficient water and low to moderate temperatures, whereas C4 and CAM plants are adapted to the demands of drier and hotter environments.
Most plants can regulate CO2 import by opening and closing stomata, which are pores on the leaf's surface through which gas exchange occurs. However, at high temperatures and in dry conditions, open stomata can cause rapid loss of water. But if stomata are shut to reduce water loss, CO2 import slows down dramatically and the plant may not produce enough carbohydrate to fuel its metabolic processes.
Autotrophic bacteria and archeans can transform CO2 into sugar via six different paths. Perhaps the most glamorous and well-known example is the sulfur-oxidizing bacteria of thermal vent communities that generate ATP by oxidizing hydrogen sulfide (H2S) several kilometers below the ocean surface.
Other chemosynthetic autotrophs oxidize iron, diatomic hydrogen (H2), carbon monoxide (CO), nitrite (NO2-), or ammonium (NH4+), to generate energy.
Plant Nutrients
Researchers concluded that the evergreen species were less efficient photosynthesizers than the deciduous species because the N allocated to cell walls is not used for photosynthesis.
Plants grow more quickly if they allocate more N to the photosynthetic apparatus, for example, by constructing more rubisco. But the tradeoff for quick growth is that deciduous leaves don't survive as long as evergreen leaves, which allocate more N to cell wall structure. Though they grow more slowly, evergreen trees retain the N they absorb for a much greater period of time.
Ecologists often report the relative abundance of C:N:P in the form of a molar ratio, which describes the relative number of atoms of each element within an organism.
The high C:N ratio in plants is in part a result of the abundance of two carbohydrates, cellulose and lignin. Cellulose is the most abundant organic molecule in the world, and forms the major structural component of plant cell walls. Lignin is also very abundant, adding mechanical strength to cell walls, and reducing the permeability of vascular tissue, so it can conduct water more effectively.
Heterotrophs: Consume the organic materials produced by autotrophs.
Herbivores: Eat plant tissues or fluids.
Carnivores: Eat other animals.
Omnivores: Eat both plant and animal material.
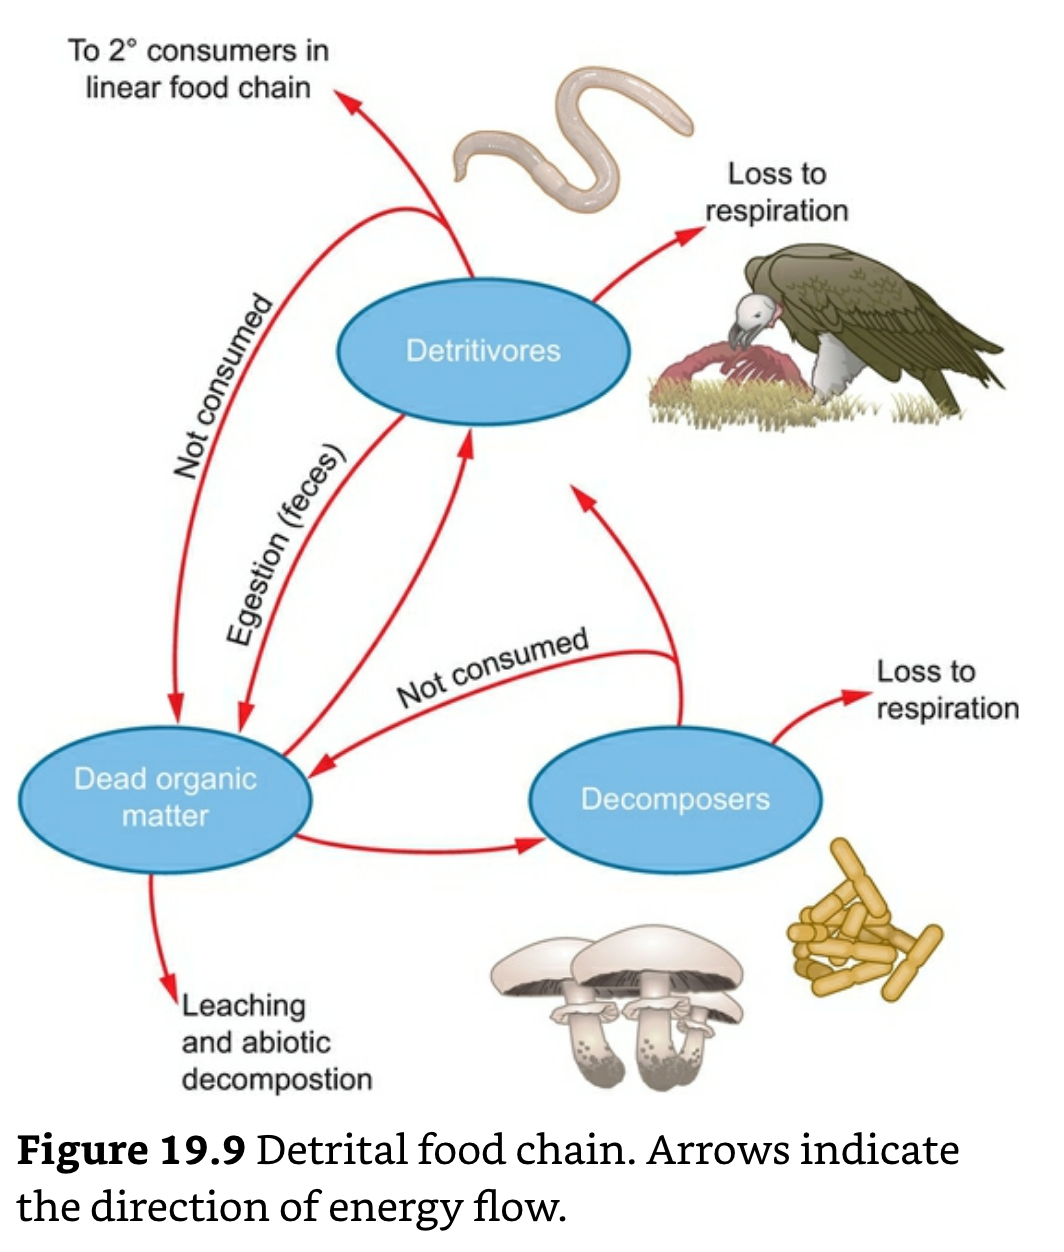
Saprotrophs: Heterotrophs that use already dead organisms or organic matter produced by organisms to meet their nutritional needs. Saprotrophs are further distinguished as either detritivores or decomposers.
Detritivores: Ingest the dead matter, detritus – primarily the remains of plants, but also of other species.
Decomposers: Bacteria and fungi that break down organic matter through physical and chemical means into energy and nutrients, which they use for metabolism and nutrition, and CO2, which is released as waste.
Ocean Nutrients
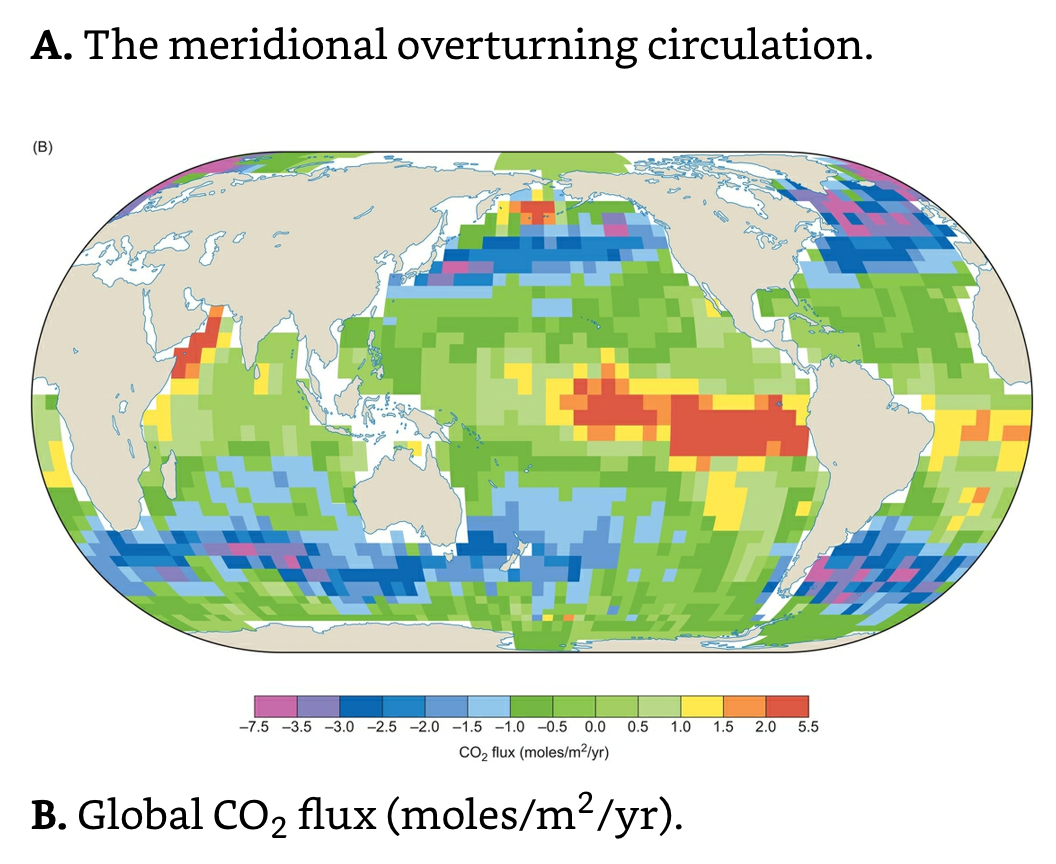
Fe limits the abundance of marine phytoplankton.
Biological Pump: When diatoms and other phytoplankton die, about 85% of the C they have fixed from photosynthesis returns very quickly to the atmosphere from microbial decomposition. But about 15% of the C sinks deeper in the water column and may remain there for several hundred years. Ultimately, most of this C returns to the atmosphere by ocean upwelling.
In 1998, the Sea-viewing Wide Field-of-view Sensor (SeaWiFS) project sponsored by the National Aeronautics and Space Association (NASA) launched a satellite into space with a mission of obtaining color data of the ocean's surface. The color-enhanced picture of the Earth sent back by the SeaWiFS satellite showed that the ocean is not a uniform blue color but also has various shades of green, yellow, and orange. These non-blue colors represent high concentrations of phytoplankton.
Based on the SeaWiFS project color imagery, scientists estimate that these tiny organisms are responsible for approximately 50% of the global photosynthetic activity
The ocean is green because each phytoplankton individual uses molecules of the pigment chlorophyll to trap light energy, and chlorophyll molecules reflect green light.
___________________________________________________________________
Ch 5: Physiological and Evolutionary Ecology of Temperature and Water Relations
There are three major responses organisms may show in response to environmental challenges, such as low temperature or insufficient water availability: the stress response, acclimatization (or acclimation), and adaptation. Each occurs over a different time scale.
Tolerance: The ability to survive and function under stressful or extreme environmental conditions.
Adaptation: A genetic change that occurs within populations over many generations.
Acclimatization: A physiological change that occurs within an individual's lifetime.
Michael Angilletta (2009) identified five measures of physiological performance that are often considered by physiological ecologists: survival, locomotion, development, growth, and reproduction.
Species Phenology: The relationship between climate and the timing of periodic ecological events, such as flowering, breeding, and migration.
Body Temperature
Maintaining a high body temperature generally increases the rate of chemical reactions within an organism. Thus, warmer organisms are expected to function more efficiently than cooler organisms. However, natural selection will favor the evolution of biochemical systems that maximize enzyme efficiency over the range of body temperatures most commonly experienced by the organism. Thus, we can predict that organisms adapted to cooler climates will have enzymes that operate more efficiently at cooler temperatures than do enzymes of organisms adapted to warmer climates.
Endotherms: Organisms that maintain a relatively constant body temperature by conserving metabolic heat.
Ectotherms: Organisms whose body temperature is influenced primarily by the external environment. Because ectotherms do not expend energy for temperature regulation, they generally require less food.
Extended frosts can kill many ectothermic species, by causing the water in their cells to freeze and bursting their cell membranes and/or cell walls.
At low air temperatures it may need to increase the metabolic heat it generates to keep its body warm. At high air temperatures it may need to increase its metabolic rate so that it can dissipate excess heat through sweating or panting to keep its body temperature below lethal levels. The thermal neutral zone defines an environmental temperature range within which an animal's metabolic rate is constant. Outside of this zone, the metabolic rate will increase substantially.
The total amount of heat stored (Hs) within an organism is influenced by several variables. These are: Hm metabolic heat generated from cellular respiration, Hcd heat gained or lost by conductive heat transfer – transfer of heat energy arising from molecular collisions within or between substances (often solids), Hcv heat gained or lost by convective heat transfer – transfer of heat energy arising from the movement of fluids, such as water and air, Hr heat gained or lost by electromagnetic radiation (such as solar radiation, or longwave radiation from Earth) He evaporative heat loss. We can put these variables together to create a simple model of heat storage (Schmidt-Nielsen 1997): Hs = Hm± Hcd ± Hcv ± H – He.
To help with dumping excess heat, elephants have very large and flattened ears that are highly vascularized. At high temperatures, large quantities of warm blood are shunted to the ears, where heat is dumped to the environment by conductive and convective heat transfer. Elephants can also lessen their heat load by moving into the shade, reducing radiative heat transfer (Hr), and by covering themselves with water or mud, increasing evaporative heat loss (He) Sweating is used to cool a wide variety of large endotherms, for example, humans and other primates, large antelope, and camels (Schmidt-Nielsen 1997). Almost 2500 kJ of heat is dissipated with each kg of sweat that is vaporized, so sweating is a highly effective cooling mechanism.
Many smaller mammals – including carnivores and small antelopes – and many birds use panting to cool themselves. No electrolytes are lost in panting, but a great deal of carbon dioxide is expelled, which can cause a dangerous increase in blood pH. A second problem is that panting increases metabolic rate, which increases endothermic heat production (Hm). In most cases, however, the increase in Hm with panting is relatively small.
By allowing body temperature to drop, animals need much less energy to fuel their metabolism. The energy savings can be huge – well over 90% in many species that enter hibernation – a state of torpor that lasts for several months throughout the cold season.
Organisms that live in the ocean are unlikely to exchange any substantial heat from radiative or evaporative processes. Consequently, the heat balance model simplifies to: Hs = Hm ± Hcd ± Hcv.
The whale's secret is that right below its skin is a thick layer of blubber, which can comprise up to 50% of its body weight. This remarkable substance is mostly fat and collagen and is surprisingly highly vascularized (in most animals, fat does not contain many blood vessels).
A 5 cm layer of blubber is generally enough to keep underlying tissue 30°C warmer than the frigid ocean.
Whales can bypass the insulation afforded by blubber by shunting blood to capillary networks located just under the skin. They can then dump the excess heat with conductive and convective heat exchange. When body temperatures cool down, whales can divert blood flow away from the capillary networks under the skin to a second network that is under the blubber. That way, most of the heat is conserved.
Water
The total amount of water stored by an organism (Ws) will be influenced by several variables. These are: Wm metabolic water generated from cellular respiration, Wen water taken in from the environment, Wet water lost from evaporation or transpiration, Wse water lost from secretions or excretion. We can put these variables together to generate a simple model of water regulation: Ws = Wm + Wen-Wet-Wse.
Water enters plants primarily through the roots and exits from the stomata during transpiration. Our simple model of water balance reduces to: Ws =Wm-Wet
If you have pure water on one side of a selectively permeable membrane, and water with dissolved solute on the other side, water will tend to move from the pure water side to the side with dissolved solutes.
One common response of plants to drought is allocating more resources to root growth during periods of water stress.
Root/Shoot Ratio: A measure of the weight of the root system to that of the shoots – is controlled, in part, by the plant hormone abscisic acid (ABA).
Cypress and mangrove trees have pneumatophores, extensions of roots that rise above the water table and are hypothesized to provide O to the root systems.
Succulents: Characterized by widespread but very shallow root systems that can quickly pick up water.
Salmon: As juveniles, salmon live in freshwater streams; hence their cells have a higher salt concentration than the surrounding water. As a result, juvenile salmon are constantly losing salt to the environment and gaining water from the environment. They are able to regulate their salt imbalance by ingesting salt from their prey, and by having special chloride cells at the base of their gills that absorb ions from the water.
When salmon return to their natal stream to mate, they rediscover the osmoregulation challenge of their youth, so they must be adapted to be both hypo-osmotic and hyperosmotic regulators.
The distribution of aquatic and marine organisms is influenced by the composition of solutes in their environment, the distribution of terrestrial organisms is greatly influenced by water availability.
___________________________________________________________________
Ch 6: Behavioral Ecology
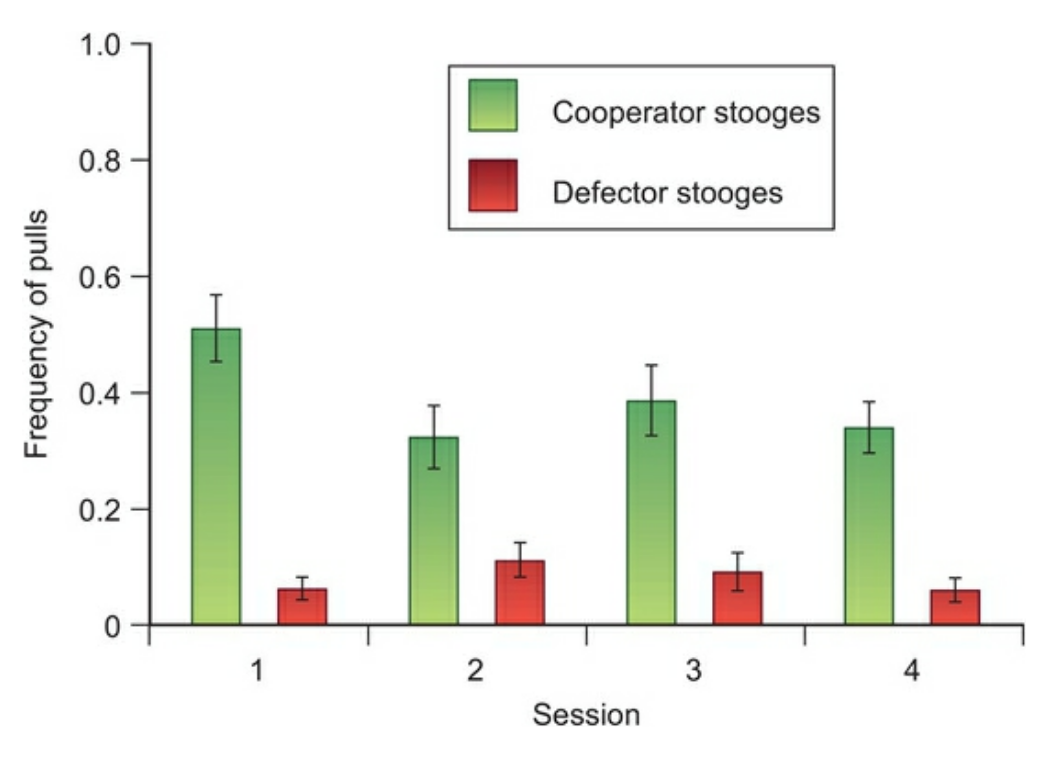
Within a population, individuals who take in the most essential resources should have the greatest survival and reproductive success. Powerful social forces support behavior that favors selfishness and greed at public expense (Hardin, 1968).
Commons: A pasture open to all herdsmen within a community (Hardin).
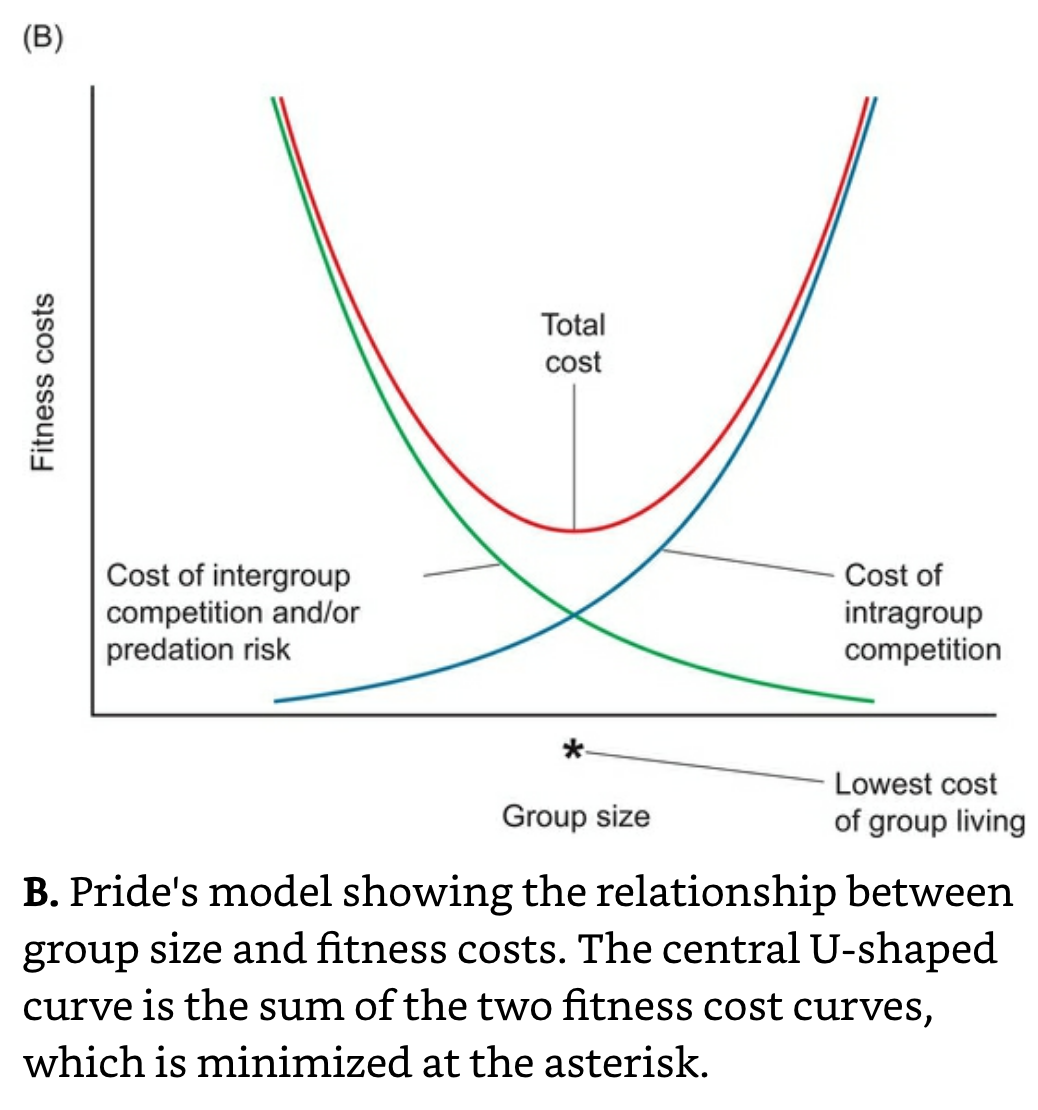
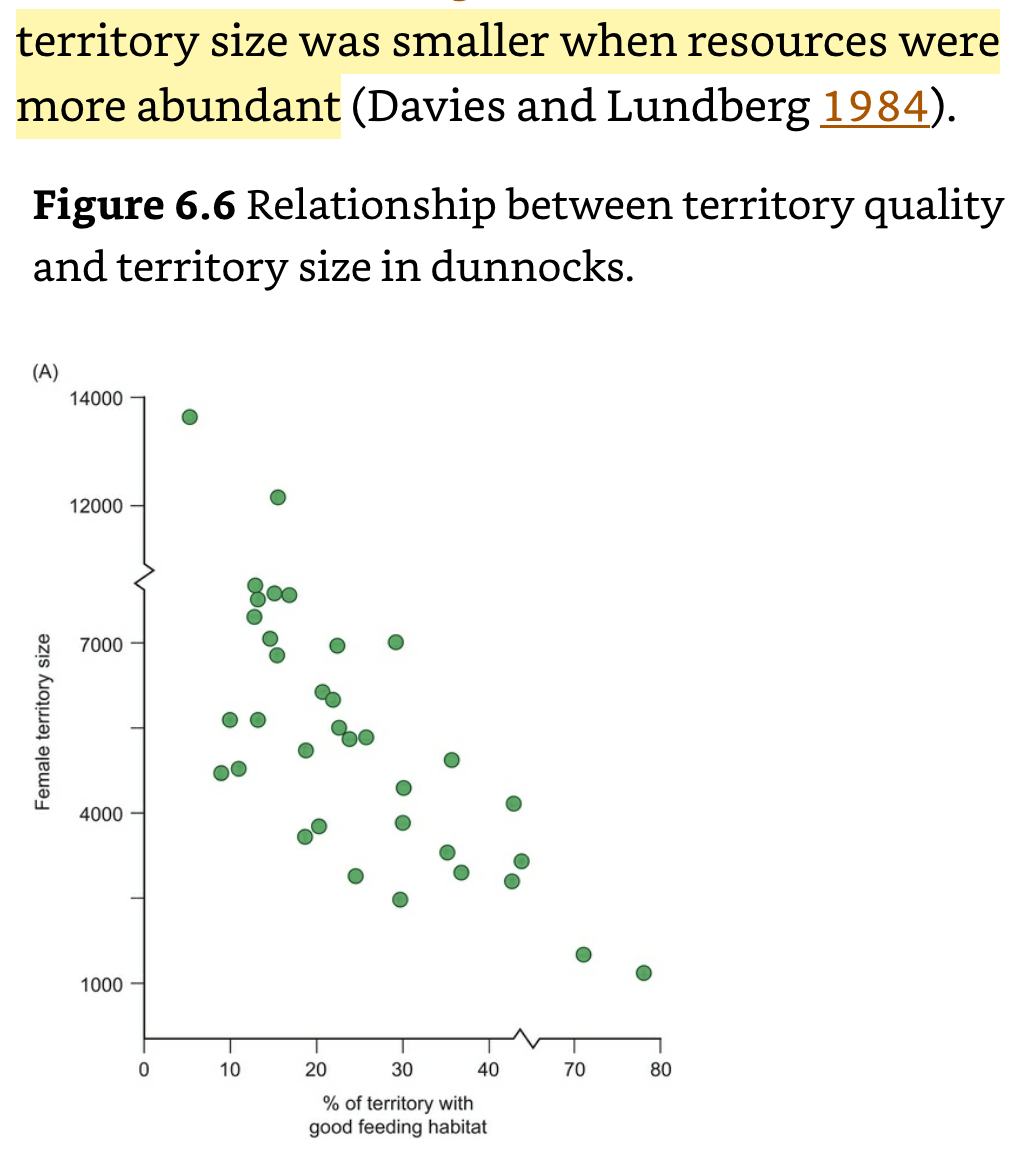
Territoriality: Develop when the benefits of territory defense exceed the costs. Under these conditions the territory is economically defendable (Brown, 1964).
Territory size is smaller when resources are more abundant.
Marginal Value Theorem: Predicts when an animal should move to a new location based on its marginal rate of gain, or the rate of gain expected in the next time period.
In many ecological contexts, the expected gain from a behavior decreases with the amount of time an individual has already spent doing the behavior, causing the individual to move to a new location.
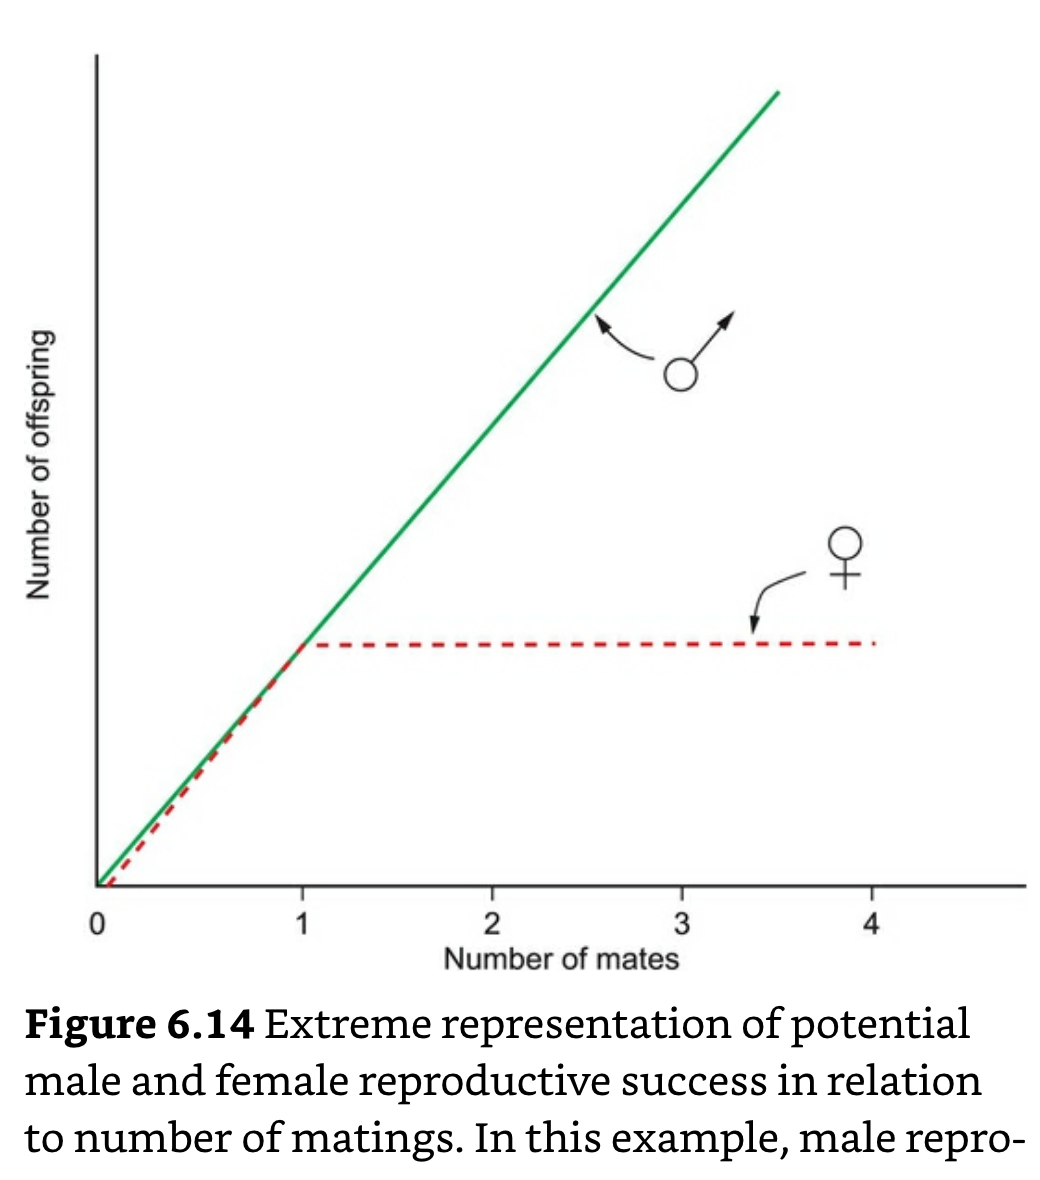
Fitness: Though the extent of the difference in gamete size varies among different animal taxa, females always invest more resources per gamete produced than do males. As a result, a female's reproductive success may be limited by the number of eggs she can produce, while a male's reproductive success is seldom limited by the number of sperm he can produce. While females get very little benefit from multiple mating’s, males, by virtue of their numerous (albeit tiny) gametes, have the potential to increase their fitness considerably with each new sexual partner
Sexual Dimorphism: A difference in form between males and females.
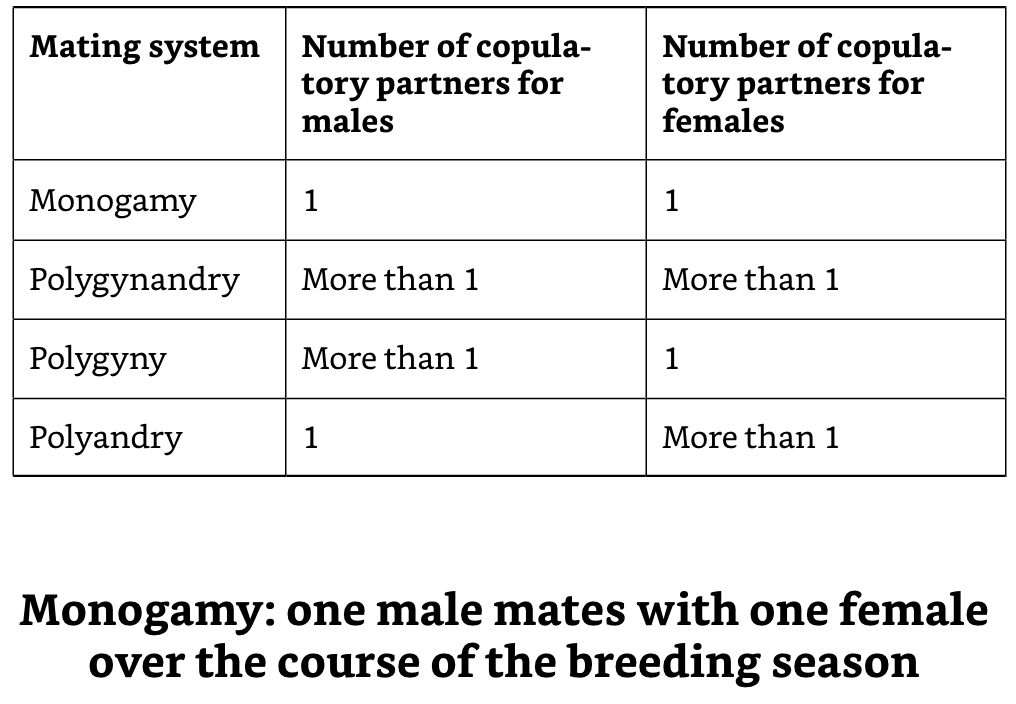
Monogamy: Most prevalent in species that require extensive parental care in order to successfully raise offspring. About 90% of birds are primarily monogamous. Biparental care is needed in many bird species because one parent may need to sit on the eggs while the other parent goes out foraging.
Why should females in monogamous pairs accept mating’s from other males? There are several non-mutually exclusive hypotheses, which may apply to different species: 1) Females may seek out extra-pair copulations to protect themselves against the possibility that their mates are infertile. 2) Females may seek extra-pair copulations to increase the genetic diversity in their offspring, which may increase the possibility that some offspring will survive. 3) Females may be able to recognize high genetic quality in males, and may seek extra-pair copulations from males with unusually good genes. 4) Extra-pair mating’s by females may create a strong incentive for males in the population to cooperate with their neighbors, since there is some probability that neighboring offspring are actually theirs. Natural selection would then favor males who helped provision nests and repel predators from the neighborhood, and that showed reduced territorial aggression and infanticide
Polygynandry: Males and females have multiple mates over the course of the breeding season.
Polygyny: One male mates with more than one female over the course of the breeding season.
Polyandry: One female mates with more than one male over the course of the breeding season.
It is difficult to find good examples of polyandry, in part because it is relatively uncommon in nature,
In studies, there is a substantial reduction in polyandry from almost 50% in the controls to less than 25% for the birds that benefited from food supplementation.
Haplodiploid: Offspring that develop into males.
Diploid: Offspring develop into females.
The hallmarks of eusociality are cooperative care of young, the presence of sterile castes of non-reproductive workers, and the presence of multiple generations of individuals within the colony.
Altruism
Martin Nowak and Karl Sigmund suggest that social systems, particularly human societies, are organized by altruistic interactions in which individuals help each other, even though helping is costly. We've discussed this in terms of direct altruism in which individuals may take turns helping and receiving help (aka TIT for TAT).
Nowak and Sigmund argue that the direct model is a useful starting point, but that within human societies, much of our social existence is influenced by indirect reciprocity, which they define as “I help you and somebody else helps me”
Nowak and Sigmund formulate an equivalent of Hamilton's rule in which C is the cost to the donor and B is the benefit to the recipient. They state that indirect reciprocity can evolve only if B × q > C, where q is the probability of knowing the correct reputation of the potential recipient. Thus, high benefits, low costs, and a high probability of correctly evaluating a person's reputation will favor indirect reciprocity within a population.
___________________________________________________________________
Ch 7: Bernd Heinrich
Flushing: The dumping of excess heat through the skin; when overheated, humans open up their capillaries to increase blood flow to their extremities.
___________________________________________________________________
Part III: Population Ecology
___________________________________________________________________
Ch 8: Life History Evolution
Life history traits are adaptations that influence growth, development, survivorship, and a variety of reproductive parameters for individuals of a particular species.
Endangered Species: Any species which is in danger of extinction through all or a significant portion of its range.
Recovery Rate: Influenced by how long a species survives, how quickly it attains sexual maturity, and how many offspring it produces over the course of its reproductive lifetime.
Reproduction
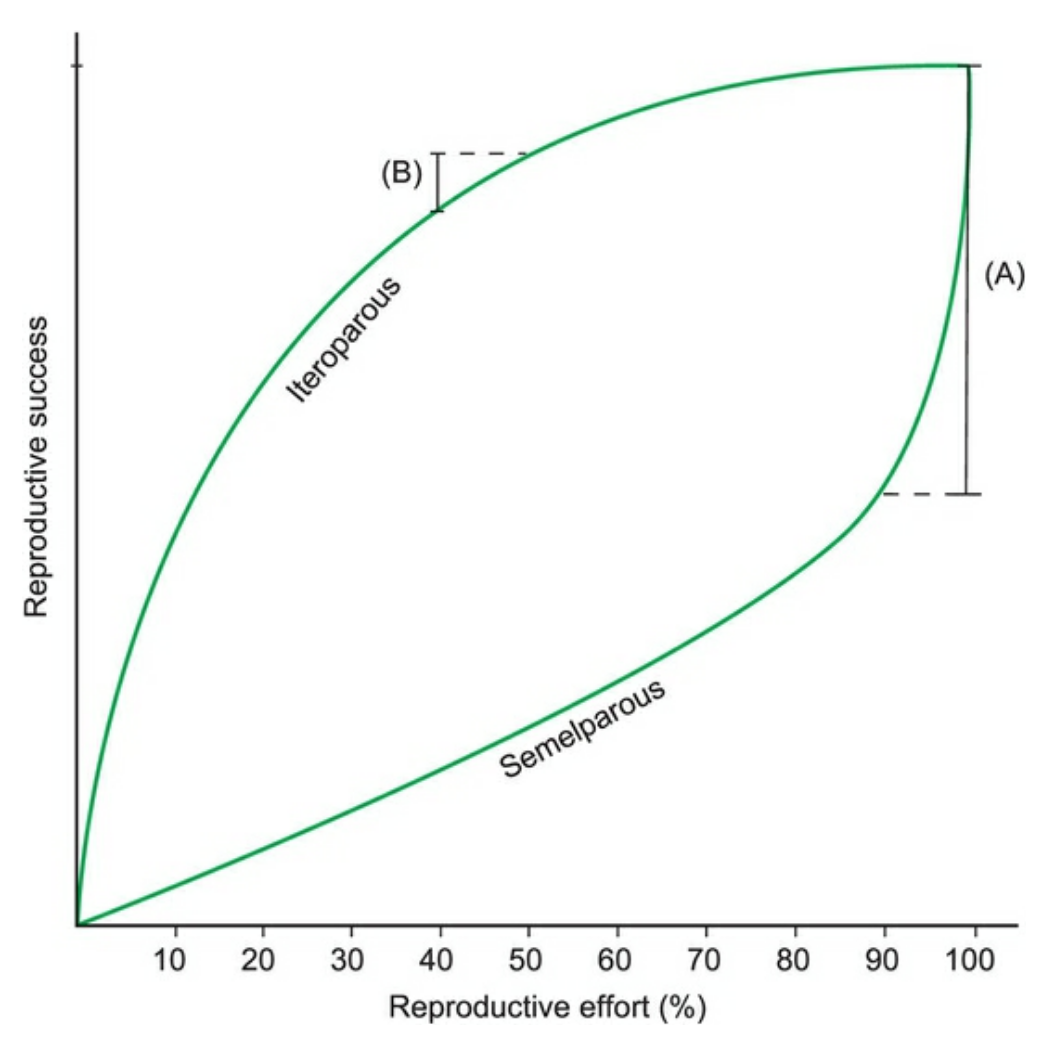
Iteroparous: Multiple reproductive events over the course of a lifetime.
Semelparous: One reproductive event over the course of a lifetime.
Fecundity: The average number of offspring produced. In plants, fecundity is a measure of the number of seeds produced, while in animals it is the number of eggs.
Reproductive Effort: The amount of resources an organism allocates to a reproductive event.
Resource Allocation: The quantity of key resources, such as energy and nutrients, that a parent can devote to reproduction.
The amount of resources a mother can allocate to her offspring will be related to the mother’s size. (Obviously, whales can produce larger babies than mice.) If so, then the litter size (L) should be proportional (α) to the total resources the mother is able to allocate to her reproductive effort (R) divided by the amount of resources invested per offspring (I). L α R/I (Charnov & Ernest, 2006).
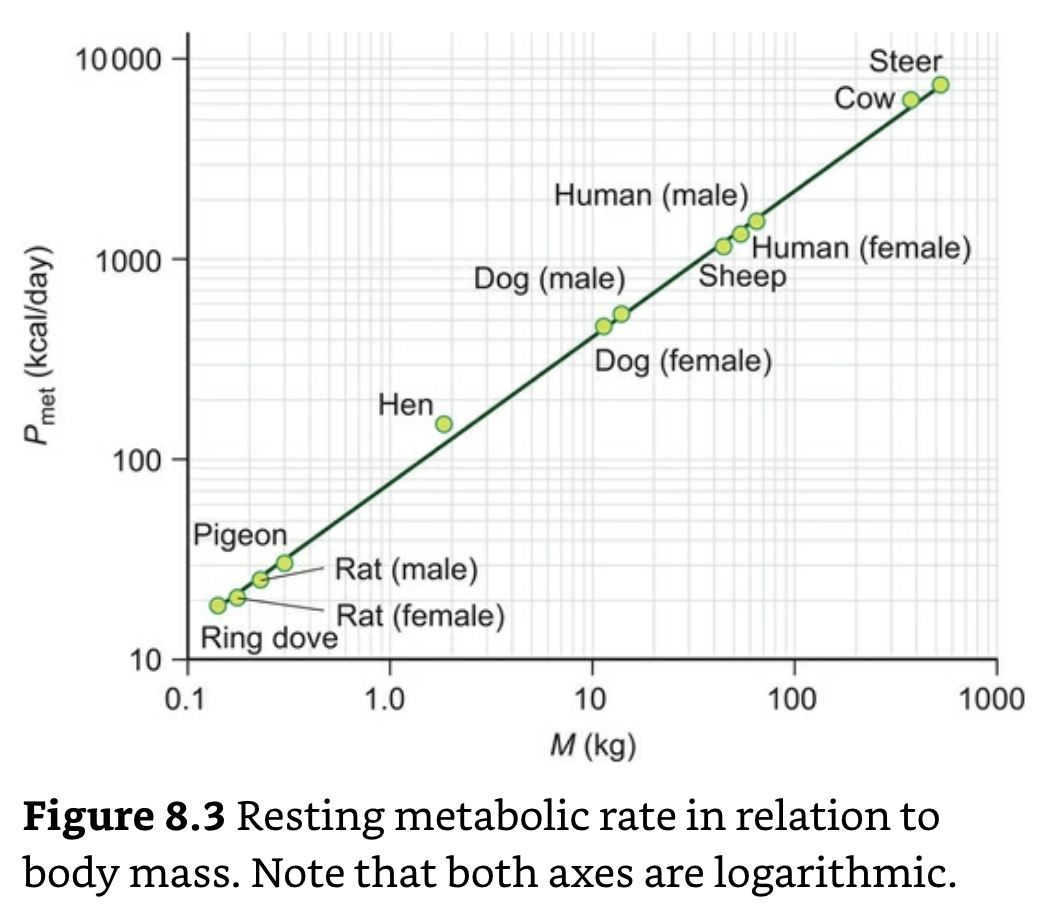
One very early study surveyed resting metabolic rates in mammals in relation to body size. Resting metabolic rate (Pmet) is the amount of energy used by an organism over a given time period while at rest in a thermally neutral environment. Physiologists knew that larger mammals tend to use more energy than smaller mammals, but Kleiber collected data from several researchers and found the following relationship between resting metabolic rate and body mass: Pmet = 73.3M0.75 Where Pmet = the metabolic rate in kcal/day M = individual body mass in kg (Kleiber, 1932).
Oviposit: Lay eggs.
Selection
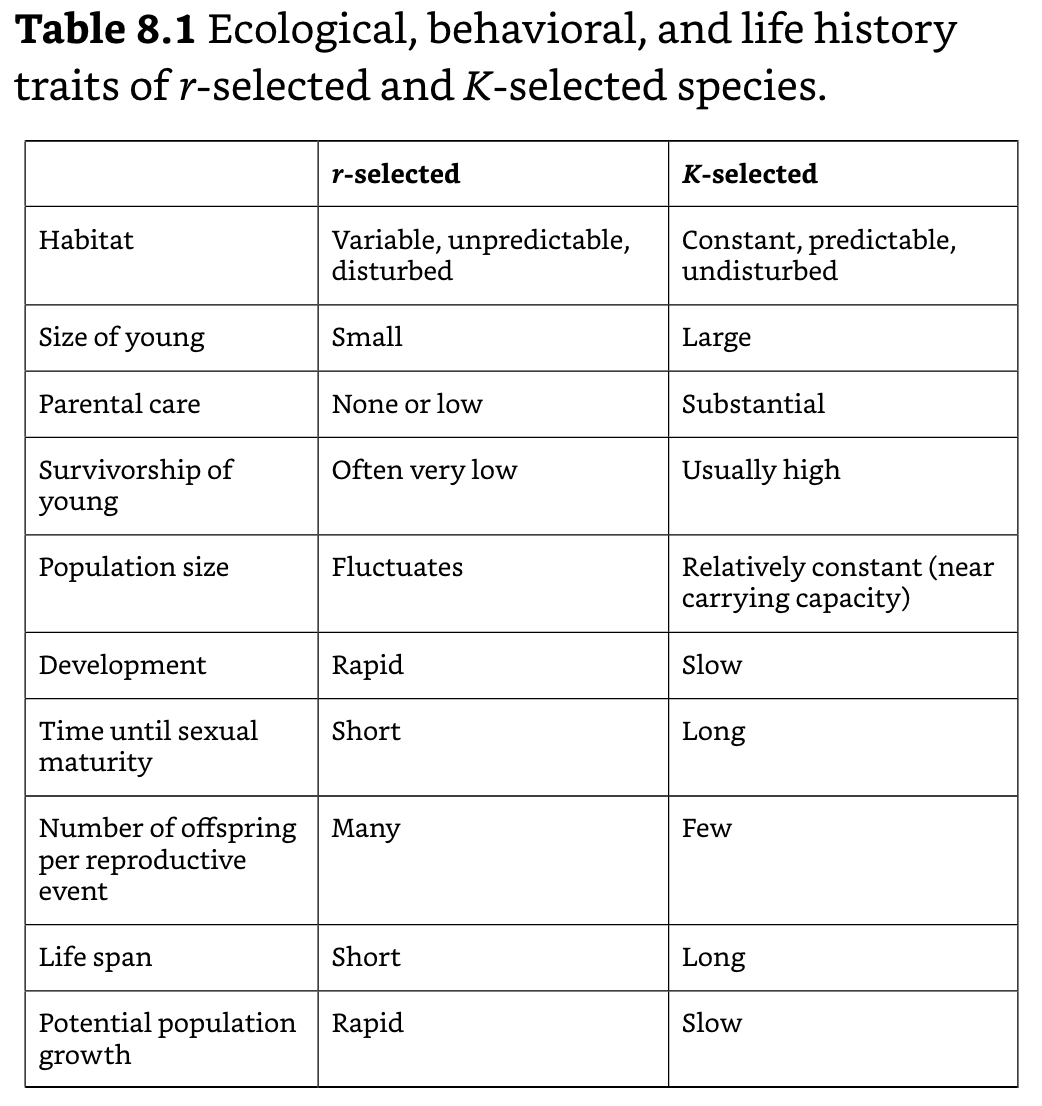
r-selection: “r” refers to per capita growth rate; a measure of how fast a population can grow. r-selected species, those with potentially high reproductive rates, are most successful in unpredictable environments, including those that have been recently disturbed by catastrophic events such as fires or floods. These conditions favor species with rapid development, reproduction at an early age, and the potential to produce a large number of offspring at rapid intervals
K-selection: “K” refers to carrying capacity; the maximum population size that can be supported or sustained by the environment. K-selection favors individuals that compete effectively for resources in predictable and stable environments, which tend to have populations at or near their carrying capacity. K-selected species tend to have greater competitive ability, which can include large body size and parents that channel resources into the production of a few large offspring that can survive and reproduce in a highly competitive environment.
Evolution
Phenotypic Plasticity: Ability to change phenotypes (expressions of developmental, physiological, or behavioral traits) in response to different environments.
Transgenerational Plasticity (TGP): Parents pre-condition the life history traits of offspring to a particular environment.
Transgenerational plasticity might help endangered species adjust to rapid climate change, because it allows parents to provision their offspring with an adaptive program that promotes survival and reproduction in the environment they are most likely to experience (Richer-Box Hypothesis).
___________________________________________________________________
Ch 9: Distribution and Dispersal
Distribution: The geographical range of a population.
Dispersion: Spatial pattern of distribution of individuals within a population.
Random Dispersion: Each individual has an equal probability of occupying any given space in the habitat. Thus the location of one individual is independent of the location of another individual. Random dispersions are unusual in the natural world, because individuals may be attracted by resources, such as food, nutrients, or shelter, and may be attracted or repelled by individuals of the same or other species.
Uniform (Regular) Dispersion: Individuals tend to avoid other individuals, with the result that they are spaced more evenly than in a random dispersion. In animals, territorial interactions can lead to a uniform dispersion, though no dispersion is ever completely uniform.
Clumped Dispersion: A variety of biotic and abiotic factors will attract individuals either to each other, or to the same type of habitat (most common).
Itinerant: Non-territorial.
Dispersal: The movement of individuals from one location to another location.
Migration: A type of dispersal; the back-and-forth intentional movement of individuals or populations between two locations.
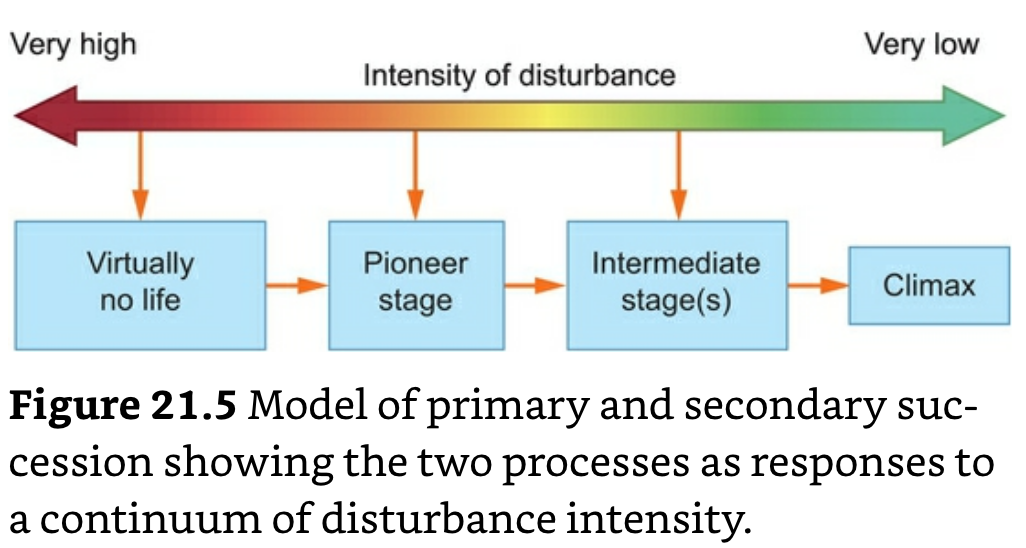
Chronosequences: Habitats that are similar to each other in all respects except for the time since they were colonized.
Invasive Species: A non-native species that is introduced into a new habitat, and that often adversely affects numerous species in the new habitat.
Niche Concept: Population ecologists argue that the niche concept allows us to identify the conditions necessary for the continued survival of a species. If these conditions are maintained, a species has a much higher probability of surviving (but of course will not really exist indefinitely). If these conditions are not maintained, a species’ population will decrease, perhaps to extinction.
Ecological Niche: The set of environmental conditions and patterns of resource availability, in which a species can survive, grow, and reproduce.
Fundamental Niche: The potential set of environmental conditions and resources in which a species can survive, grow, and reproduce.
Realized Niche: The set of environmental conditions and resources in which a species can survive, grow, and reproduce in the presence of competitors and predators.
The minimum level of soil nitrogen defines a fourth dimension of the saguaro niche. If three dimensions describe a volume, then four or more dimensions describe a hypervolume.
___________________________________________________________________
Ch 10: Population Abundance and Growth
An accurate estimate of population size is essential to any study of past or present populations.
Unitary Organisms: Each individual is a unit, and presumably easy to count.
Modular Organisms: Develop an undetermined number of repeated copies of similar structures.
Estimated population size = (number of individuals in the sample)/(estimated probability of detection).
Quadrat Sampling: Used to estimate population size for easy-to-count unitary organisms.
Sessile: Fixed in one place.
Mark–Recapture Method: Used to estimate population size when only a portion of the organisms within a habitat can be counted.
Proportion marked in sample 2 = proportion marked in entire population M2/NS2 = M1/Nest M2 = number of marked individuals recaptured in second sample NS2 = total number of individuals in second sample M1 = number of individuals marked and released in first sample Nest = estimated population size We can cross multiply and solve for Nest, giving us Nest = (M1NS2)/M2.
Accumulation Curve: A graph of the number of samples on the x-axis and the total number of individuals on the y-axis
Asymptote: Estimated population size.
A noninvasive approach for assessing difficult-to-count organisms is to estimate the percent cover of an organism – the percent of its substrate that it covers as you look down at it from above.
Metapopulation: A group of local populations inhabiting networks of somewhat discrete habitat patches.
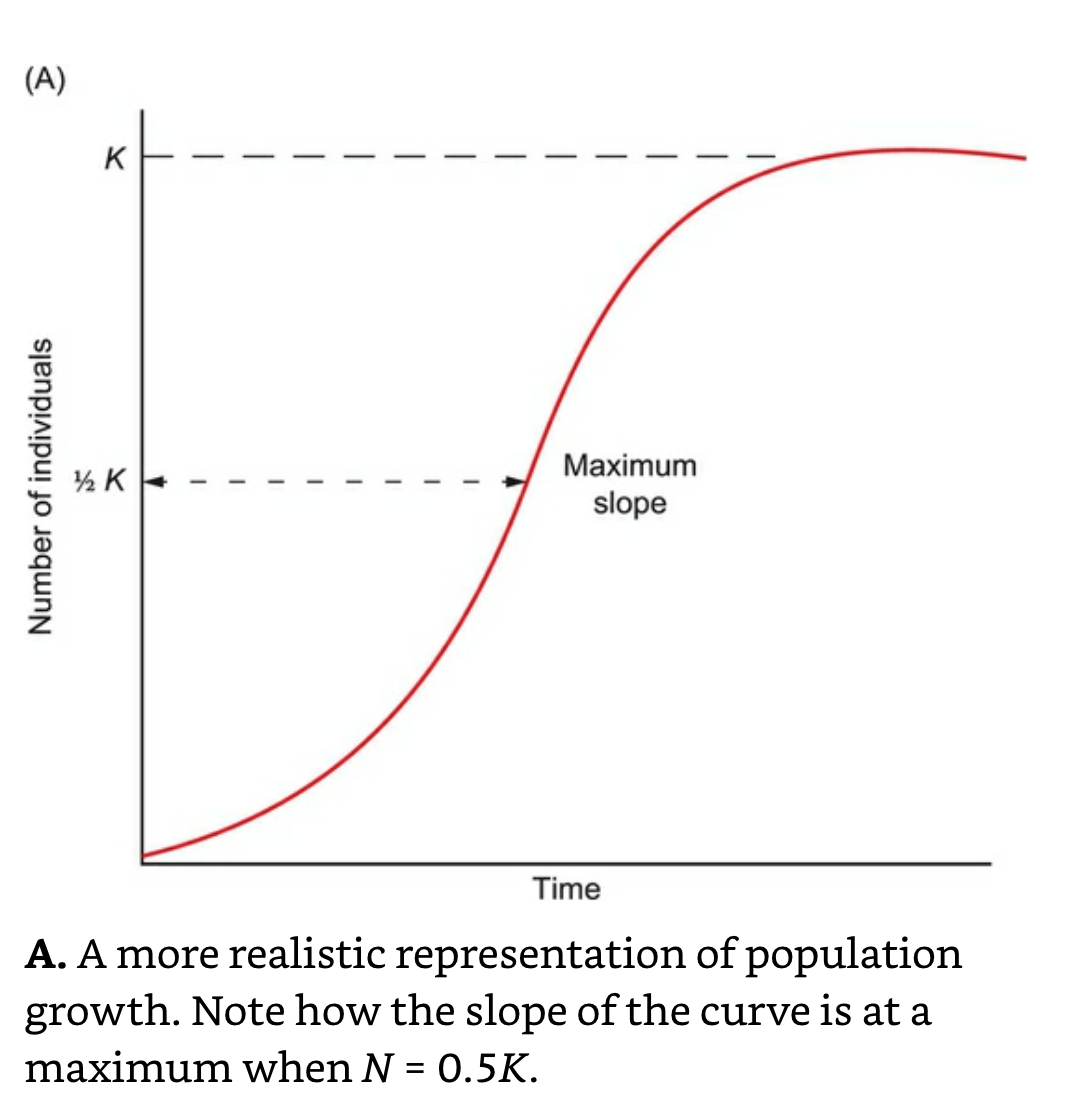
Population Growth: The logistic formula for population growth: dN/dt = rmN((K-N/K)/K); dN/dt = the population growth rate, rm = the maximum per capita growth rate N = population size, K = the carrying capacity.
Many species have discrete reproduction life histories, producing offspring at discrete time intervals – usually during a specific season while some species have continuous reproduction life histories, with individuals having the potential to reproduce at any time during the year.
Nt + 1 = Nt +B-D where Nt + 1 = population size at time t + 1 Nt = population size at time t B = number of individuals born into the population between the time interval t and t + 1 D = number of individuals dying from the population between the time interval t and t + 1.
Population ecologists use the symbol λ (lambda) to designate the proportional change in the population from year to year. If λ > 1.0, the population is growing; if λ = 1.0, the population is stable, and if λ < 1.0, the population is getting smaller. Mathematically: λ = Nt+ 1/Nt We can rewrite this formula as Nt + 1 = λNt Similarly, Nt + 2 = λNt+1 and
Thus, the general formula for geometric population growth is Nt = λtN0 where N0 is the initial population size.
Population growth rate = (Nt+x − Nt)/X.
Population growth rate = dN/dt when dN = change in population size dt = a very short time interval.
dN/dt, is the change in population size over a very short time interval.
If dN/dt > 0, the population is growing; if dN/dt = 0, the population is stable.
If dN/dt < 0, the population is getting smaller.
The number of individuals born into a population (B) and dying within a population (D) will be directly influenced by population size; dN/dt = B − D
dN/dt = bN−dN = (b−d)N Because discussions of b – d are so important in population ecology, ecologists have coined a relationship as follows: r = b – d where r is termed the per capita growth rate.
Where Nt = population size at time t N0 = starting population size e = base of the natural logarithm
One critical assumption of both the geometric and exponential growth models is that there is no immigration or emigration.
Number of offspring is highly correlated with level of economic development, as family planning efforts increase with improved standards of living and higher levels of education.
Carrying Capacity (K): The maximum population size that can be supported or sustained by the environment.
When a population reaches its carrying capacity, then N = K and (1 − N/K) is equal to (1 – 1) = 0.
Population Density: Number of individuals per unit area.
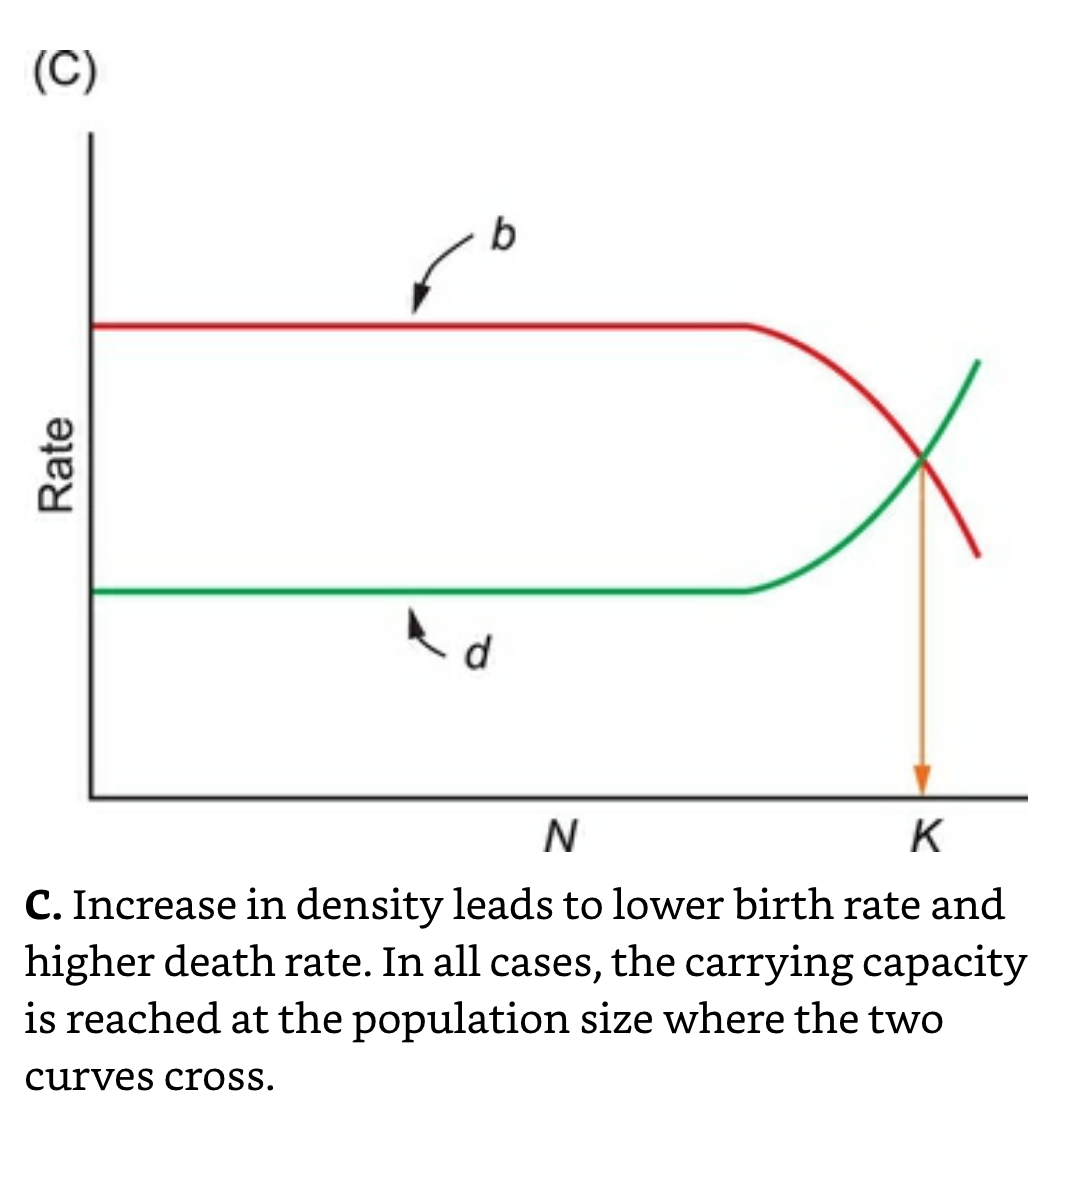
Density-independent factors influence population growth rates the same way regardless of population density. Examples include temperature, moisture, and unpredictable disturbances such as storms, mudslides, and rock falls. In contrast, other factors, which we call density-dependent factors, reduce population growth rates as population density increases, by decreasing birth rates and/or increasing death rates at high population densities. Common examples of density-dependent factors are disease and competition.
From a theoretical standpoint, density dependence can regulate populations in any of three ways. It can decrease per capita birth rates, increase per capita death rates, or both.
Easter Island’s Rapa Nui
Most scientists suggest that first colonization occurred between AD 400 and 900.
But sometime in the 15c, tree populations began to decrease sharply, with extinction of all tree species complete by the 17 or early 18c.
Jubaea palms were clearly an important part of the early Rapanui culture.
Rapa Nui; the “clearest example of a society that destroyed itself by overexploiting its own resources.”
Polynesian colonizers arrived at Rapa Nui at about AD 900.
Terry Hunt and Carl Lipo (2006) have proposed an alternative hypothesis that argues that there is very little evidence for colonization before AD 1200.
___________________________________________________________________
Ch 11: Conservation Ecology
Small populations are at a greater risk of extinction than large populations due to low levels of genetic diversity and fluctuations in population size arising from disturbance and other chance events.
Genetic Diversity: A measure of differences in nucleic acid composition among individuals within a population or species.
Inbreeding Depression: A reduction in survival or viability of offspring produced when two relatives mate with each other. In the case of a brother–sister mating, the coefficient of relatedness (r) is 0.5, which means that there is a 50% chance that the two siblings will have the same allele as a result of being close relatives.
Small populations tend to have more inbreeding, leading to lower offspring viability and a higher incidence of spontaneous abortions and birth defects.
Population Viability Analysis (PVA): A quantitative analysis of extinction risk that allows ecologists to recommend management options to improve the prognosis for continued survival of a population.
Very low-density populations should have reduced per capita growth rates (r) because they have reduced defense against predators, decreased foraging efficiencies, difficulty finding mates, or higher emigration rates. Low per capita growth rates at low population densities will reduce population growth rates and may increase the probability that low-density populations go extinct (W. C. Allee, 1931).
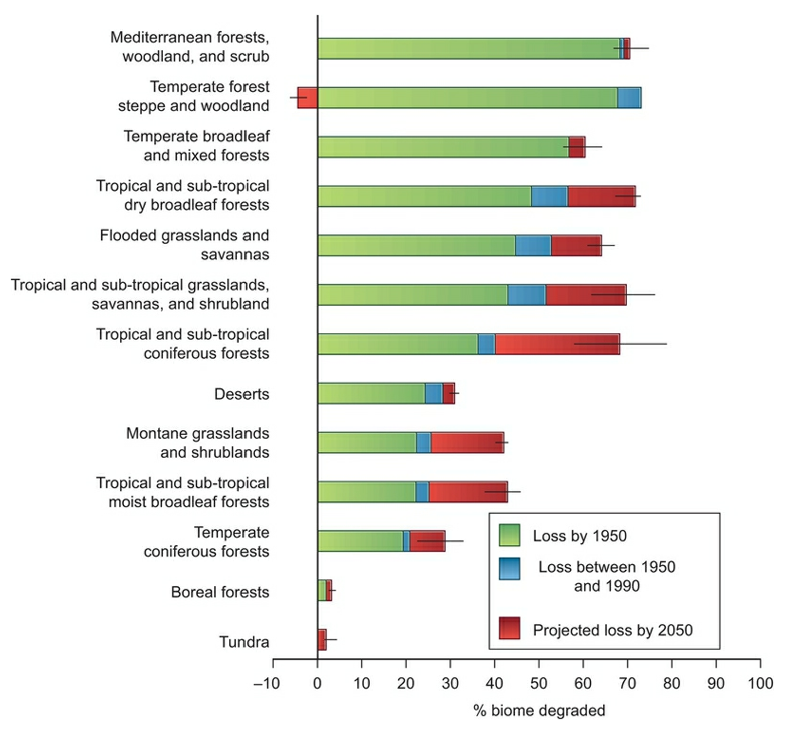
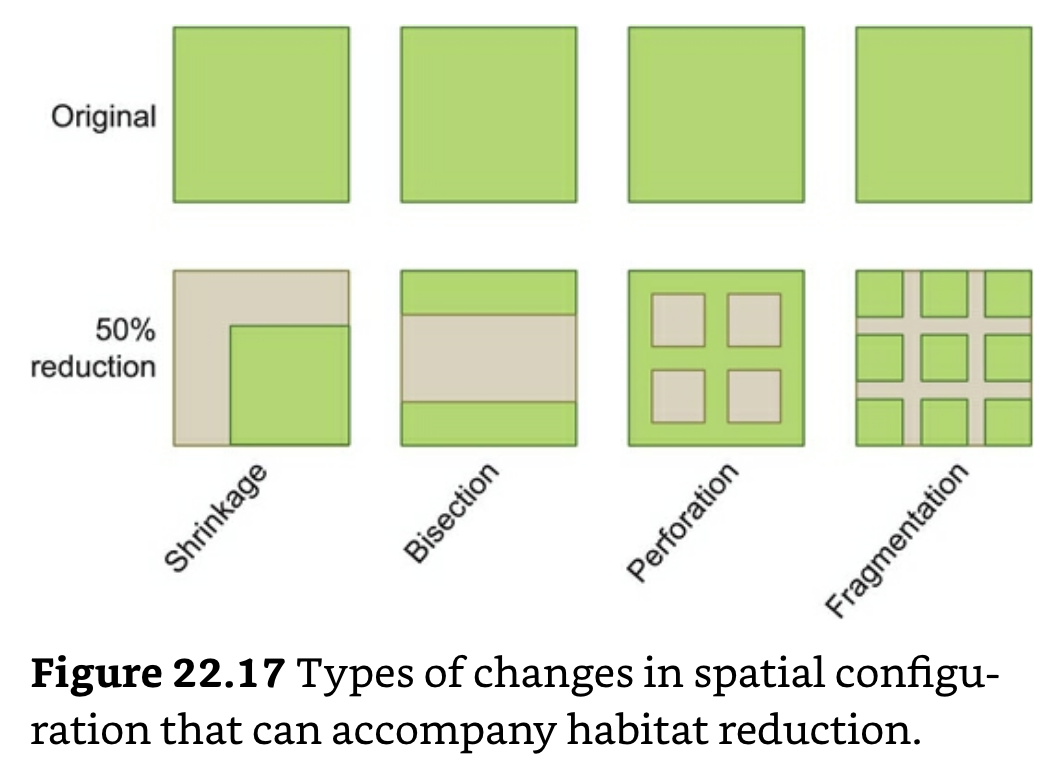
Habitat Degradation/Destruction: The quality of an area is reduced for a particular species, so that its population is no longer viable in that habitat. Habitat fragmentation can lead to extinctions in many different ways. First, small fragments contain fewer types of habitats, and thus fewer ecological niches. Second, small fragments support smaller populations, which can lead to low genetic diversity. Third, small fragments have a much larger portion of their area near the edge of the habitat. Conditions near the edge of a habitat are very different from conditions in the interior, including differences in climate, rates of predation, and interactions with non-native competitors.
Fragmentation: A large, continuous habitat is broken down into small isolated patches.
Human Overexploitation of a Species: Using a species as a resource beyond its ability to replenish itself numerically – may also lead to species extinction.
Enemy Release Hypothesis: Proposes that invasive species are successful in their naturalized range if they can disperse without many of the natural enemies that keep them in check in their native range.
Evolution of Increased Competitive Ability (EICA) Hypothesis: Proposes that invasive plants, because they have fewer herbivores attacking them, can allocate fewer resources to defense, and thus can allocate more resources to survival and reproduction in their naturalized range. This gives them a competitive edge in their naturalized range when competing with native species for resources.
Resource Hypothesis: Argues that most invasive plants succeed because they are already extraordinarily well adapted to the new environment. The combination of temperature, nutrients, moisture, and soil types that they experience in their naturalized range may be better suited to their successful survival and reproduction than what they experience in their native range.
One prediction is that invasive plants will have more pathogens in their native range than in their naturalized range.
Conserving ecosystems is a viable approach to conserving endangered species.
___________________________________________________________________
Ch 12: Jane Goodall and Anne Pusey
1971: Jane Goodall publishes her book “In the Shadow of Man.”
1986: Jane Goodall publishes her book “The Chimpanzees of Gombe: Patterns of Behavior.”
2011: The Institute of Medicine of the National Academies issues a report that concludes that chimpanzees had been a valuable research model in the past, but that they were no longer necessary for most current biomedical research. The use of chimpanzees could only be considered if three conditions were met: 1) the knowledge gained must advance public health, 2) there must be no other suitable research model available, and the research could not be ethically done with humans, and 3) the chimpanzees must be maintained in natural habitats or in an ethologically appropriate physical and social environment – an environment that is conducive to normal behavior.
Goodall firmly believes that the future lies with educating children to become stewards of the environment.
Roots and Shoots: To foster respect and compassion for all living things, to promote understanding of all cultures and beliefs and to inspire each individual to take action to make the world a better place for people, animals and the environment.
___________________________________________________________________
Part IV: Community Ecology
___________________________________________________________________
Ch 13: Interspecific Competition
Ecosystem Engineer: A species that substantially influences the availability of essential resources within an ecosystem by causing important changes to the biotic or abiotic environment.
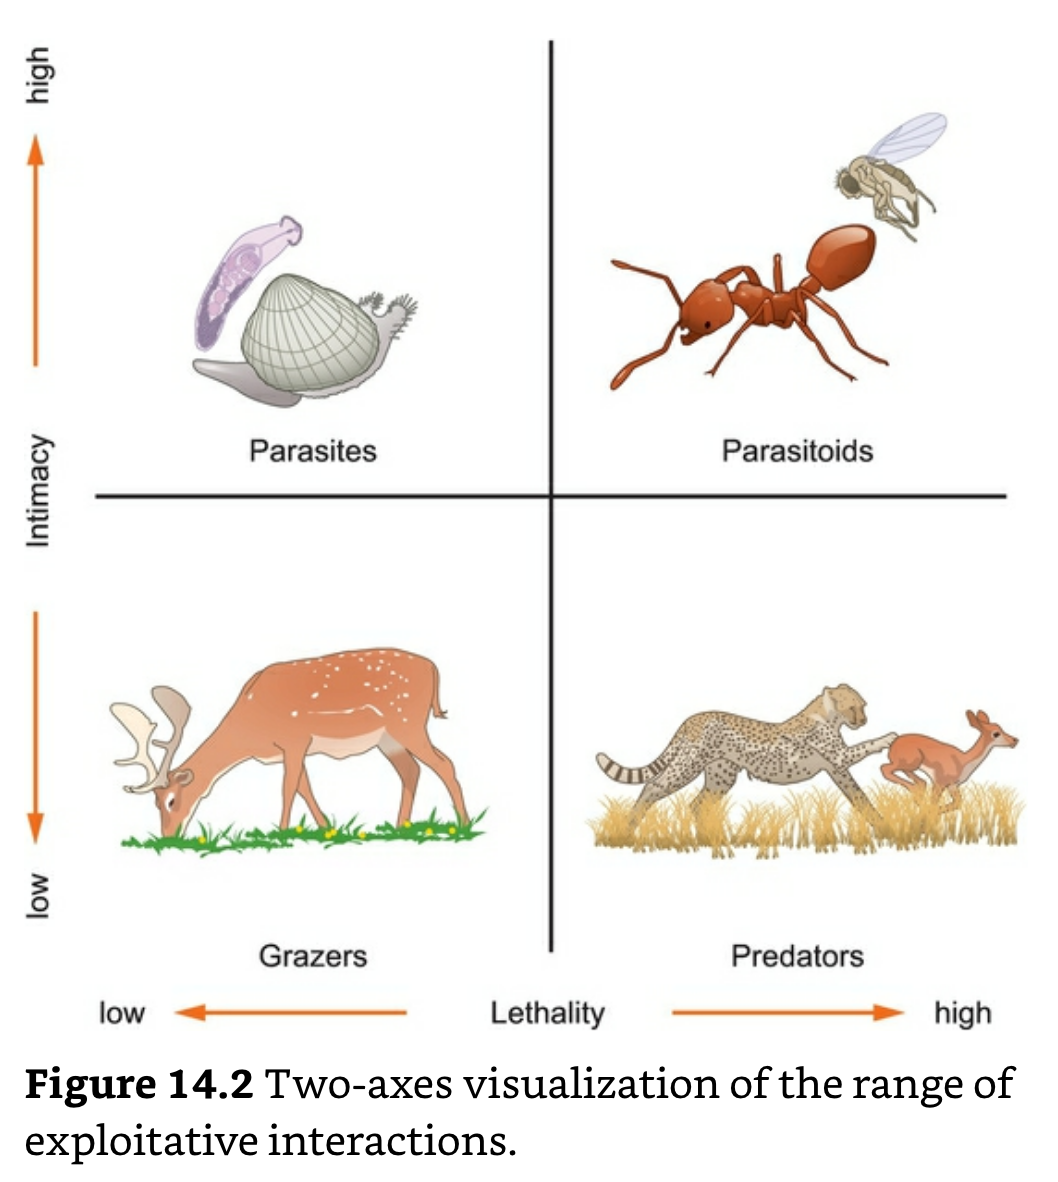
Exploitative Interactions: Interactions in which an organism of one species benefits by consuming all or part of an organism of another species, or by diverting resources that would otherwise nourish the organism.
Grazers: Eat portions of their prey but generally don’t kill them and are similar to predators, in that they lack any sort of intimacy with their prey or hosts.
Parasites: Have a highly intimate relationship with their hosts, living within or attached to their hosts. Unlike parasitoids, most parasites don’t usually kill their hosts.
Microparasites: Tiny, generally live within cells, and multiply directly within their hosts. Viruses, bacteria, some protistans, and simple fungi are microparasites.
Macroparasites: Visible to humans without a microscope, and live outside of the host’s cells. Ticks, nematodes, trematodes, and some fungi are common macroparasites.
Hemiparasite: A plant that is parasitic on other plants.
Imported Parasitoids: Organisms that live attached to or within a host organism, killing it in the process.
Defense
Constitutive Defenses: Defenses expressed continuously.
Induced Defenses: Defenses expressed in response to an injury or a threat.
Secondary Compounds: Molecules that are not essential for growth, development, or reproduction, but that function as constitutive chemical defenses. Some examples of secondary compounds that ironically are consumed by humans, though not necessarily to their advantage, are caffeine, cocaine, and morphine.
Predation
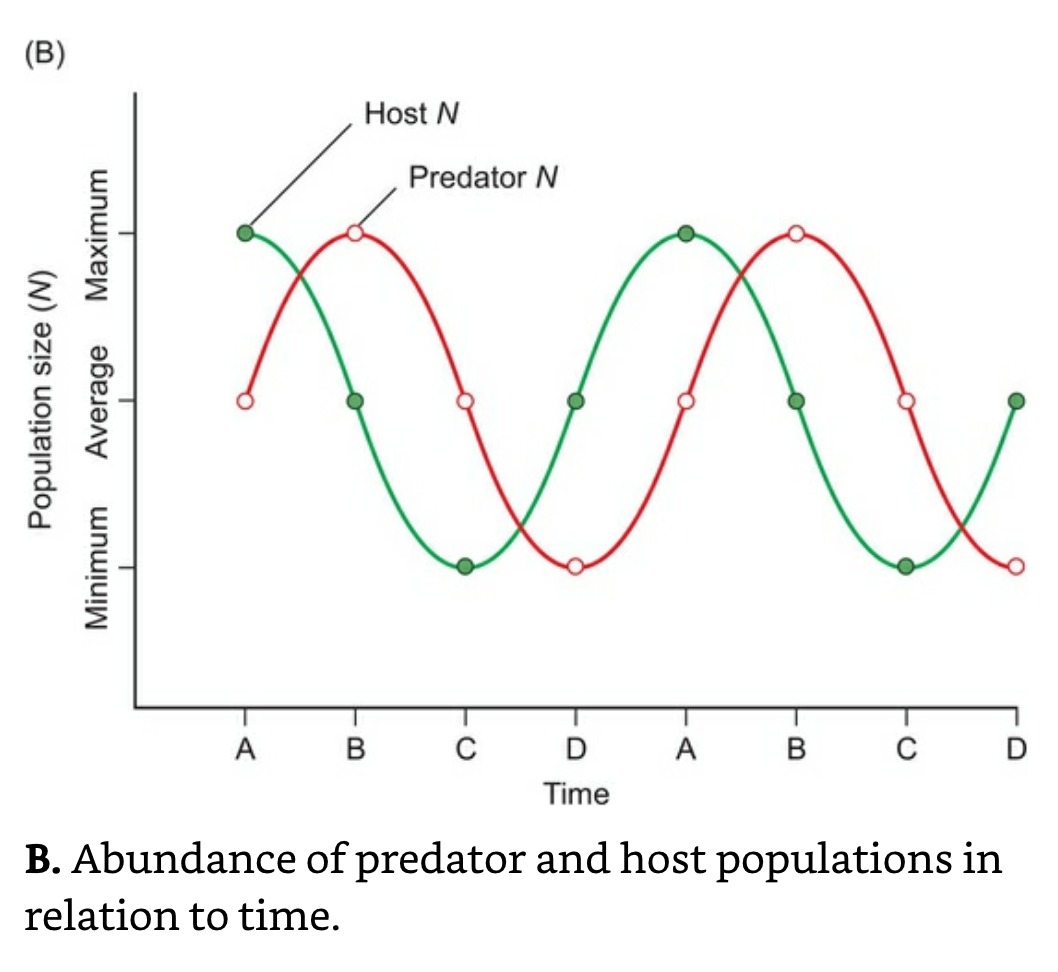
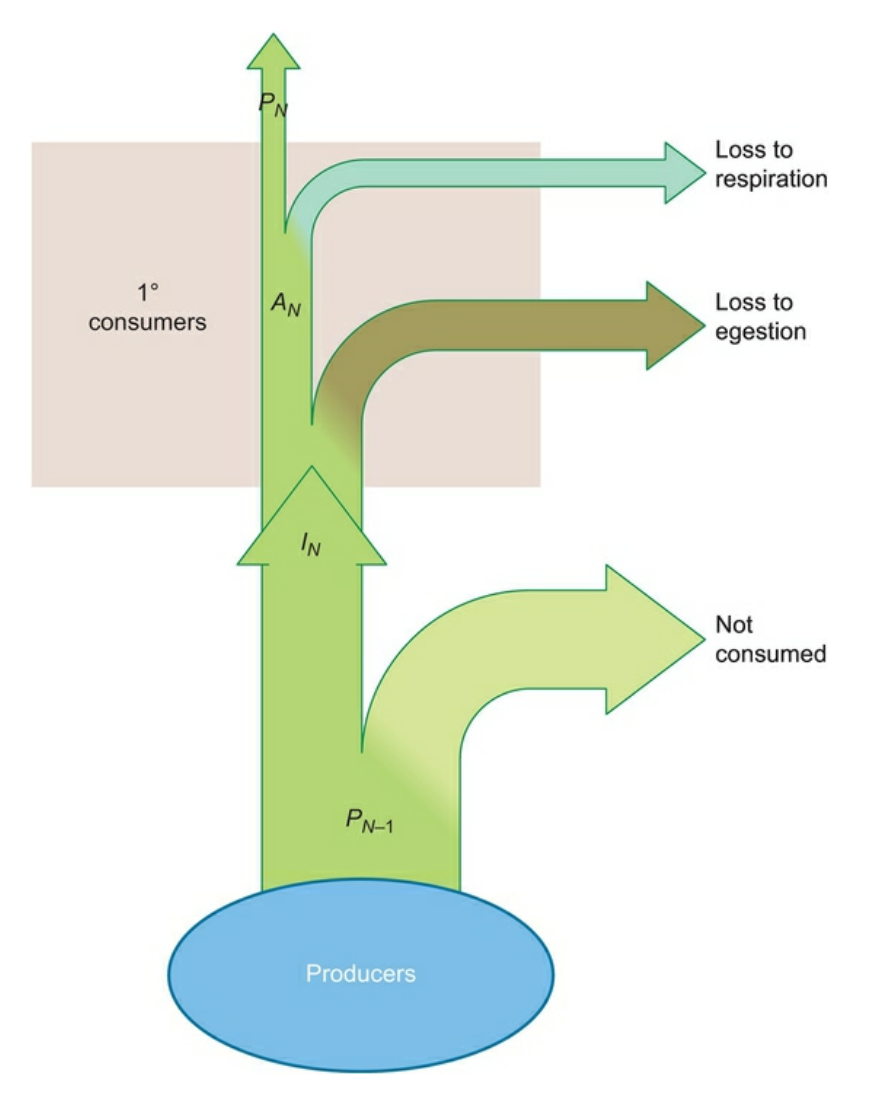
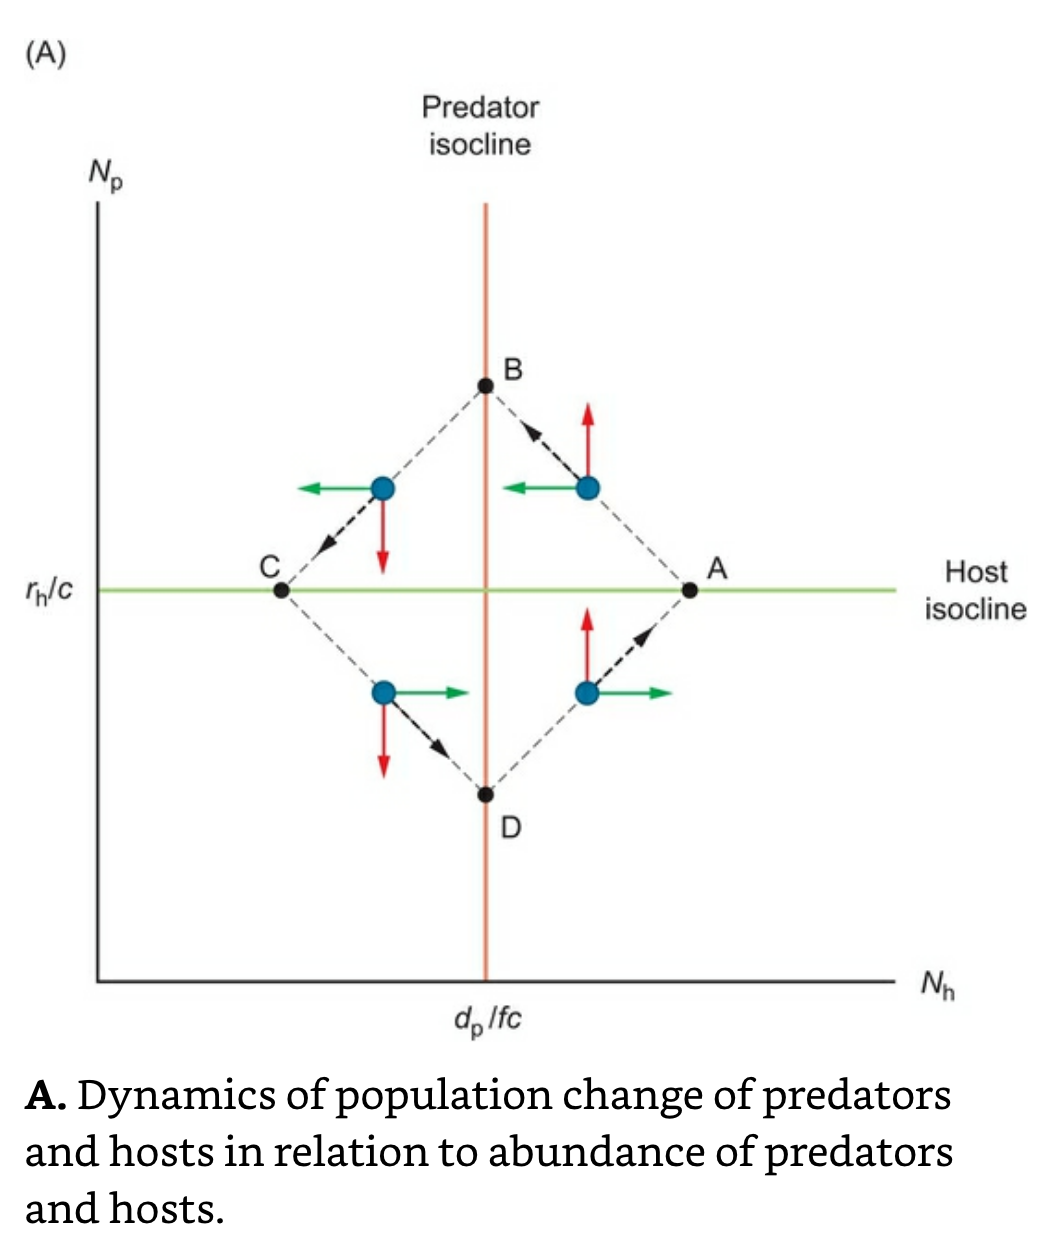
dNh/dt=rhNh = The rate of host population change. The product of these three factors measures the number of hosts removed from the population. Subtracting this product from the exponential growth formula gives the differential equation describing the rate of host population change. dNh/dt = number of hosts born – number of hosts killed by predators or parasites dNh/dt = rhNh − cNhNp
Nh: Number of hosts or prey.
Np: Number of predators or parasites.
C: Efficiency with which a predator captures or infects its host.
The number of predators born into the population will be the number of hosts removed from the population as described above (cNhNp), multiplied by the efficiency with which these hosts are converted into predator babies (f). Thus the number of predators born into the population = fcNhNp. The number of predators dying = dpNp, where dp = the predator death rate. The differential equation describing the rate of predator population change is dNp/dt = number of predators born – number of predators dying dNp/dt = fcNhNp − dpNp
Nonconsumptive Effects: Changes in the behavior, growth, development, or reproduction of prey or hosts in response to the presence or absence of predators or parasites.
Chronic stress leads to high levels of glucocorticoids (primarily cortisol in hares, lemurs, and humans), which can cause an array of symptoms, including low fertility rates, inhibition of growth, and long-term changes in brain structure and function.
Research suggest a hormonal response to chronic stress that could potentially reduce reproductive output.
Functional response is the relationship between prey density and predator per capita consumption rate.
Disease
Hosts are born into the population with rate b, and die naturally with rate d. Susceptible individuals become infected with rate β and recover with rate ν, at which point they are assumed to be immune. But immune individuals lose their immunity at rate γ. The death rate of infected individuals is the natural death rate (d) + the death rate from the disease (α) = d + α.
Anderson and May argued that we could predict the future of a disease in a host population by estimating its value of R0 – the net reproductive rate, which is the mean number of offspring produced by an individual over the course of its lifetime. Applied to microparasitic infection, R0 is the mean number of hosts infected by a host organism carrying the disease. According to Anderson and May’s model, R0 is equal to the product of the number of susceptible host organisms in the population (S), the transmission coefficient that measures how easily the infection is transmitted to a new host (β), and the amount of time the host is infectious (L). Mathematically this gives us R0 = SβL
R0: Reproductive rate.
R0 > 1: Population will tend to increase.
R0 < 1: Population will tend to decrease.
Threshold Population Size (Critical Community Size , ST): The threshold number of susceptible hosts needed to make R0 > 1. Substituting 1 for R0 and ST for S in our formula gives: 1 = STβL or ST = 1/βL
Easily transmitted pathogens (high value of β) should have low values of ST.
Let’s see how these considerations can influence the progression of a disease in a population. If we choose a disease with β = 0.001 per day, and L = 5 days, then ST = 1/(0.001 per day × 5 days) = 200 individuals. Let’s introduce an infected host into a population of 1000 susceptible individuals. This gives us R0 = 5 for our starting conditions, because R0 = SβL = 1000 × 0.001 per day × 5 days. As the number of infected individuals increases, the number of susceptible individuals (S) decreases, ultimately dropping below ST (200 individuals).
We can apply the concept of a threshold population size to developing a logical approach for disease control. First we can reduce transmission rate (β) by using good hygiene. For easily transmitted diseases such as influenza, this can involve washing hands, avoiding contact with other individuals, and sneezing into tissues. Second, we can effectively reduce the number of susceptible hosts by reducing the number of individuals an infected individual comes in contact with. This is the idea underlying quarantine.
Measles: Though infectious for only a few days, has a very high transmission rate, and epidemiologists estimate that completely eradicating measles from the population will require about a 93% vaccination rate at current population levels.
___________________________________________________________________
Ch 14: Predation and other Exploitative Interactions
Competition: Interactions between individuals that have a negative effect on the fitness of the interacting individuals.
Interspecific Competition: Competition between individuals of different species.
Competitive Exclusion: Where one species outcompetes a second species for a limiting resource, and excludes it from a habitat.
Research demonstrates that you can see the effects of competitive exclusion on a community by removing the dominant competitor (Kunte).
Competitive exclusion of poor light competitors is responsible for the loss of species richness that is associated with adding nutrients to communities (Hautier).
Apparent Competition: When each prey species is indirectly having a negative effect on the other, courtesy of their positive effect on the predator.
Resource Competition: When species compete for a limiting resource such as food, space, or nest sites. Interference competition occurs when species engage in direct aggressive acts.
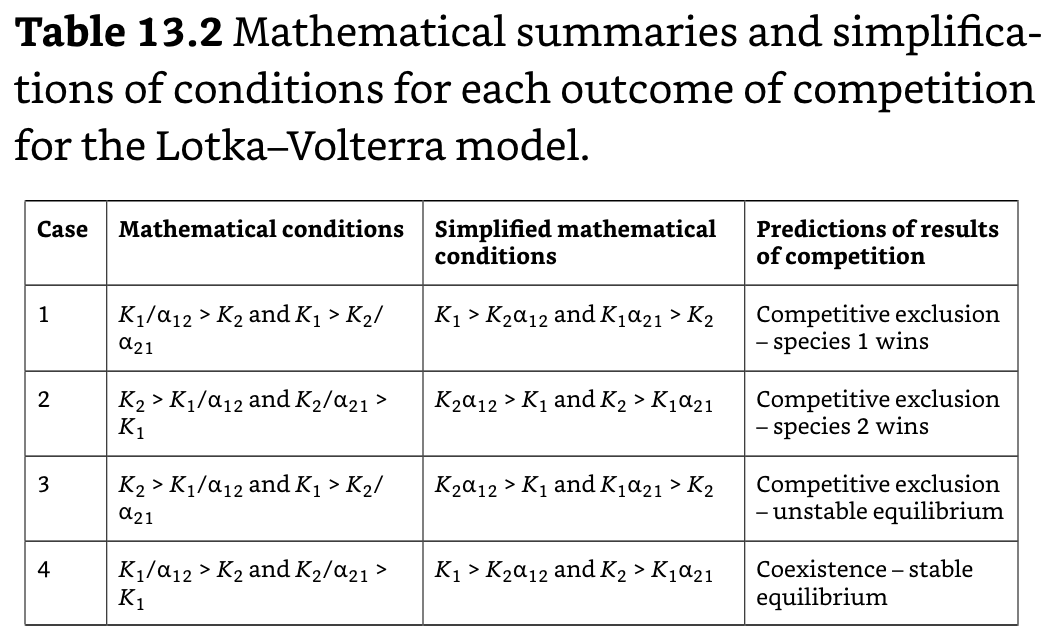
Lotka–Volterra Competition Model: Describes the conditions under which two competing species can coexist, based on the strength of competition and the carrying capacity of each species within a given environment.
Lotka–Volterra competition model: dN1/dt = r1N1(K1 – N1 – α12N2/K1 and dN2/dt = r2N2(K2 – N2 – α21N1/K2.
α: The competition coefficient – the per capita competitive effect of one species on the other.
The Lotka–Volterra model has two possible solutions or outcomes: 1) competitive exclusion, or 2) stable coexistence. The solution depends on the carrying capacity and competition coefficients for each species.
Niche Shift: An adaptive change in a species in one or more of its niche dimensions.
Niche Partitioning: A process in which ecologically similar species coexist by using different resources or specializing on different factors in the environment.
The two logical outcomes of competitive interactions are competitive exclusion or species coexistence.
The effect of one species on another is often indirect, in that the outcome is influenced by the interaction of one or both species with other species.
Intertidal Competition
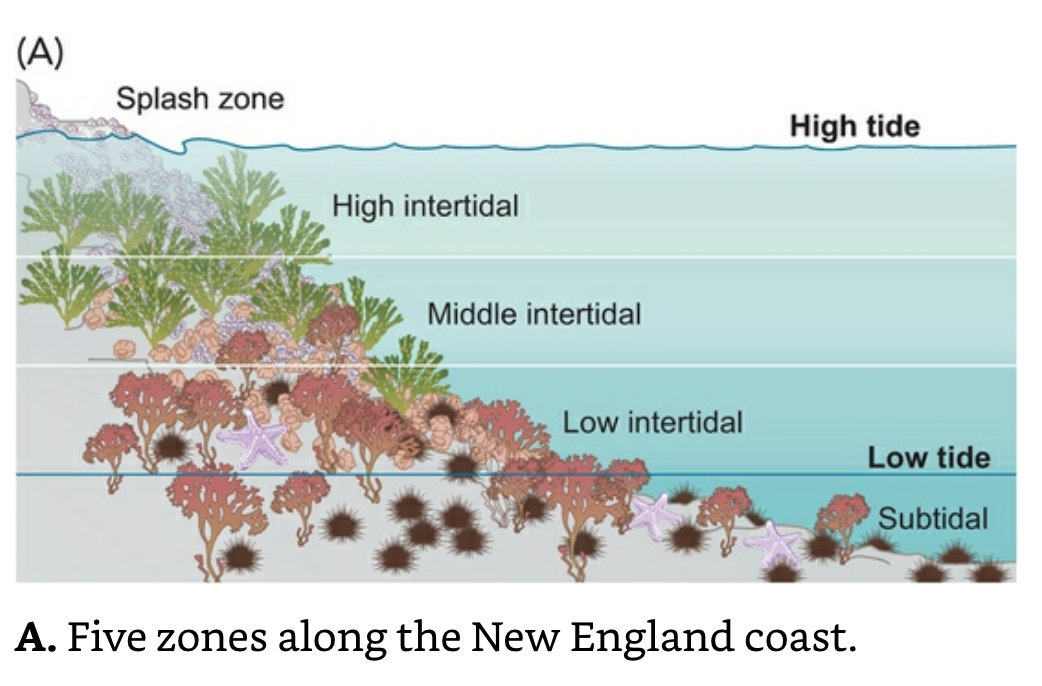
Intertidal zone: The region between the highest and lowest tides along the ocean’s shore.
Because adult barnacles are completely sedentary, they need to contend with the problem of moving their sperm from one individual to another. One adaptation is an ultra-long penis – barnacles are endowed with the greatest penis length/body mass ratio of any animal group.
___________________________________________________________________
Ch 15: Facilitation
Facilitative Interactions: Interactions between two organisms, or two species, that benefit at least one of them and harm neither. First, many facilitative interactions are indirect. Second, interactions between species can cascade through food webs, influencing the success of species far removed from an initial interaction. Lastly, though ecologists discuss ecosystems as separate entities, they recognize that ecosystems interact with each other in important ways.
Mutualism: Occurs when both organisms benefit in the form of food, habits, and/or services.
Pollination of flowers by honeybees is a mutualistic interaction; flowers receive pollen, which they need to develop seeds and fruits, while honeybees obtain both nectar and pollen, which are critical foods for them.
Commensalism: Occurs when only one organism benefits.
Mycorrhizal Associations: Symbiotic and usually mutualistic associations between their roots and various types of fungi (organisms that live in close associations like this are often called symbionts); formed by most terrestrial plant species.
Fungal hyphae form a sheath around the exterior of roots, and also penetrate into the spaces between individual root cells. These hyphae have an enormous surface area, which allows the plant to greatly increase its uptake of essential nutrients, particularly nitrogen and phosphorus. In exchange, the plant provides the fungus with carbohydrates.
In experiments for three different species, the best performers were both of the near soil treatments, and the far soil treatment with the inoculum of ectomycorrhizal fungi added. On average, adding the inoculum to the far soil tripled the growth rate over the 9 months of the experiment. The researchers concluded that adding ectomycorrhizal fungi increased the growth of trees grown in soil collected far from the plantations.
Coral Reef Mutualism
A coral reef’s diversity depends on the mutualism between the coral hosts and the symbiotic zooxanthellae algae that live within the coral’s endoderm cells. All of these algae are in the genus Symbiodinium, which has eight clades (A though H).
Clade: A set of species descended from a particular common ancestor. Consequently, all species in one clade (for example clade A) are more closely related to each other than they are to any species in the remaining clades (B through H).
The coral polyps feed on zooplankton that float in the water, but that only provides the coral with a small fraction of their energetic needs. They get the remaining 90% of their energy from the zooxanthellae, and return the favor by providing the zooxanthellae with a place to live, and a generous allotment of nitrogenous waste. Recall that fixed N is a limiting resource for many organisms, particularly autotrophs.
Coral animals use Ca that is abundantly available in shallow and warm salty water to build their skeletons, while the zooxanthellae are limited to shallow clear waters so they can photosynthesize.
Coral Bleaching: Occurs when coral loses its algal pigmentation, we still don’t know exactly what causes this loss.
Researchers have proposed that high light and high temperatures together prevent the algae from processing the excited electrons generated during photosynthesis. This “roadblock” leads to the buildup of O radicals, which can damage or destroy both host and symbiont tissues. When this occurs, either the symbionts may be expelled from the host, or else the endoderm cells may die and be sloughed off.
Maynard and colleagues interpret the lower level of bleaching as evidence that all three coral genera had increased their thermal tolerance between the two bleaching events.
Plant Mutualism
To see whether this virus conferred thermal tolerance to C. protuberata, the researchers cultured fungi with and without the virus. They then inoculated 25 panic grass plants with CThTV-infected fungus, and another 25 plants with virus-free fungus, and left 25 plants uninoculated. When subjected to a 14-day regimen of 10 h/day at 65°C, and 14 h/day at 37°C, all of the uninoculated plants and all of the plants inoculated with virus-free fungus either became very yellow or died outright. In contrast, all of the plants inoculated with CThTV-infected fungus survived, and only four plants showed signs of yellowing.
For a plant to be successful, pollination must be followed by fertilization, seed development, seed germination, and growth of the new offspring. Germination is problematic, because plants must be dispersed to habitats that are suitable for growth. Plants have evolved numerous mechanisms to increase the probability that their seeds will be dispersed to appropriate habitats.
Animal dispersal of seeds may be highly beneficial to plants. In some cases, plants encase their seeds in fleshy fruits, which provide a nutritious meal for animals that then move the seeds to new locations that may be favorable for germination. This process can be costly to the plant as well. Fleshy fruits are energetically expensive to produce, and consume a large portion of a plant’s energy budget.
In experiments, ant occupation increased the growth and survival of regenerating stumps, supporting the hypothesis that this interaction benefits both species.
Interactions between a plant species and its neighbors shift from facilitation to competition when the physiological stress experienced at high altitudes – temperature extremes, wind scouring and soil instability – is reduced or eliminated at lower altitudes.
Researchers were able to document significantly higher visitation rates of three types of pollinators to a plant species when it grew near ponds with fish in comparison to ponds without fish. The number of visitations by bees, in particular, was much greater near ponds with fish.
Researchers discovered that pollen limitation was more than twice as great in H. fasciculatum near ponds with no fish in comparison to ponds with fish.
Pollination: Honeybees visit flowers primarily in search of nectar – the raw material used to create honey, which feeds the bee colony throughout the year. In the process of collecting nectar, the bees also collect pollen grains, which are in reality very small male plants or male gametophytes. When the pollen-carrying bees visit a second flower of the same plant species, some of these pollen grains may be transferred to the stigma of the second flower – a process that we call pollination. If the process works properly, the pollen grain then transfers its male gamete into an ovule (the female gametophyte) located within the plant’s ovary, where it fertilizes an egg cell that will then develop into a new seed.
Colony Collapse Disorder (CCD)
2006: Commercial beekeepers began noticing that honeybee workers in many of their previously healthy colonies were simply disappearing over a few-week time period, leaving the colonies with only the queen, her brood, and almost no workers.
Winter, 2007-2008: Colony Collapse Disorder (CCD) becomes more of a problem due to extraordinary overwinter mortality rates above 35% in the USA.
Israeli Acute Paralysis Virus: Causes wing-shivering in early stages, and which ultimately leads to paralysis and death, was found in 83% of CCD colonies and only 5% of healthy colonies.
Kashmir bee virus, which causes paralysis and death, and the microsporidian fungus Nosema, which leads to dysentery-like symptoms, were more common in CCD colonies than in control colonies. These and other studies suggest that CCD does not arise from one single causative agent.
In one study exposure to low doses of a widely used neonicotinoid increased honeybee susceptibility to Nosema infection (Pettis et al. 2012). A study on bumblebees, Bombus terrestris, showed that low doses of the same neonicotinoid resulted in much slower weight gain, and an 85% reduction in queen production (Whitehorn et al. 2012). Finally, low doses of a related neonicotinoid interfered with the ability of foragers to find their nests.
___________________________________________________________________
Ch 16: Complex Interactions and Food Webs
Trophic Cascade: the effects of consumption cascade down the food web from higher to lower trophic levels.
OR Coast Food Web: This relationship between sea otter abundance, sea urchin biomass, and kelp density is consistent over relatively long time scales.
Trophic Level 1 (Producers): Numerous species of macroalgae, including kelp.
Trophic Level 2 (Primary Consumers): Sea Urchins, which eat kelp.
Trophic Level 3 (Secondary Consumers): Sea otters, which eat sea urchins.
Community Structure: How the different species within a community interact with each other.
Species: The basic unit within a biological community.
Guild: A group of species that depend on the same resource for survival and reproduction.
Functional Group: A group of species that performs the same function within the ecological community.
Dominant species (‘Foundation species’): Influence community structure primarily by virtue of their great abundance or biomass.
Keystone Species: Have a much greater impact on the community than would be expected by measuring their abundance or biomass. A keystone species has a central function in maintaining the structural integrity of a community.
A keystone species may indirectly influence other species through non-trophic interactions.
Community Importance: The change in the community trait per unit change in the abundance of the proposed keystone species. Examples of community traits might be species richness, productivity of the producers in the community, or the diversity or abundance of functional groups. The total impact of a species is its community importance multiplied by its proportional abundance or biomass in the community.
Interactions Web Model: Shows community structure, which includes not only feeding relations among species from different trophic levels, but also competitive and mutualistic interactions that may occur among species that occupy the same trophic level.
Food Web: The feeding interactions between species within a community.
Linkage Density: The number of links divided by the number of species. In effect it measures the average number of feeding links per species.
Directed Connectance: The number of links in a food web divided by the maximum possible number of links.
Interaction Strength: The strength of the link between two species in a food web. Overall interaction strength within the community is the per capita interaction strength multiplied by the consumer’s natural abundance in the community.
Several researchers have noted that connectivity is generally much lower for species-rich food webs than it is for species-poor food webs. Intuitively, there is some limit to the number of species that an animal can feed on, so a larger web should have fewer links per species, and hence lower connectivity.
Stability: The tendency of a community to retain its current structure and functioning even when it is disturbed by biotic or abiotic forces.
The Bottom-Up Control Hypothesis: Argues that producers are primarily responsible for community structure.
Baez and her colleagues conclude that in this system there is very little evidence of consumer regulation of community structure. Rather, bottom-up effects cascade upward through the community, so that plants respond to recent pulses of precipitation, and rodents respond to increased plant production a year after the precipitation pulse.
The Top-Down Control Hypothesis: Argues that predators are primarily responsible for community structure.
Grass with high fiber content slows down digestion so that the wildebeest cannot ingest as much over the course of a day. This study showed that grass under and around acacia trees had higher nutrient levels than grass from open grassland, presumably, in part, from higher soil nutrient content, though other factors are probably important as well. Thus, herbivory by elephants is causing an overall reduction in grass quality, which may have serious long-term consequences for wildebeests.
___________________________________________________________________
Ch 17: Biological Diversity and Community Stability
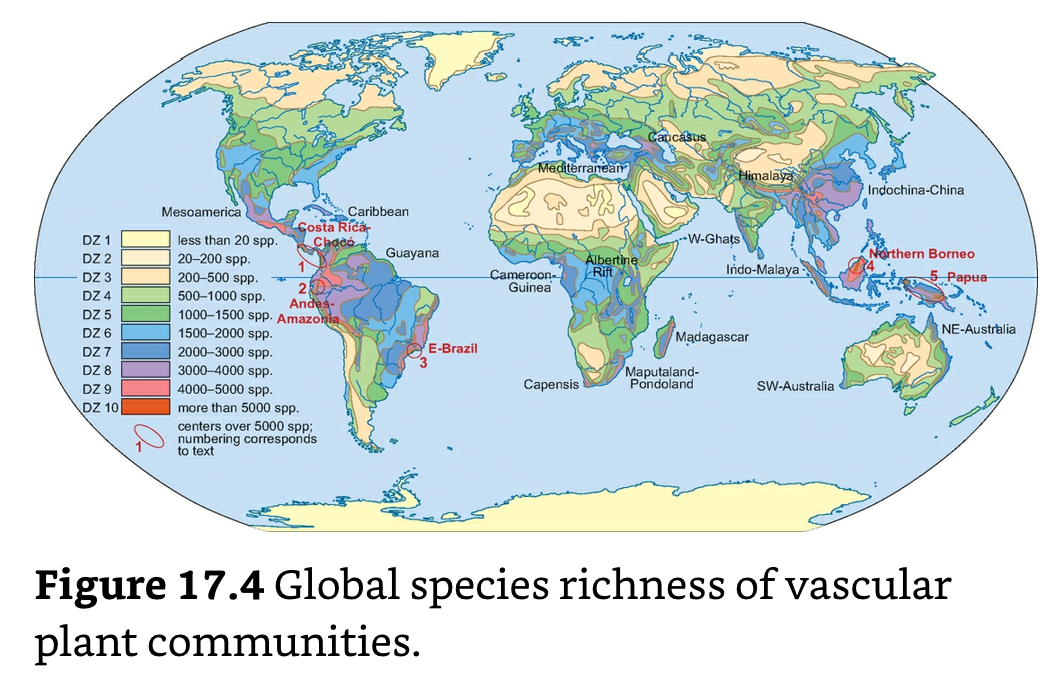
Species Richness: A simple count of the number of species in a community.
Evenness: Relatively less variation in the distribution of abundances of each species.
Shannon Diversity Index: H’ = Shannon diversity index S = the number of species in the community pi = the proportion of species i in the community. Thus, if there are 50 individuals in a community, and there are four individuals of species 1, then p1 = 4/50 = 0.08. ln = the natural logarithm.
Habitat Heterogeneity: A measure of how different a habitat is over space or time.
Alpha Diversity: Species richness within a defined area.
Beta Diversity: A measure of species turnover, or the change in species composition, along an environmental gradient.
Sorenson’s Index: measures beta diversity, how similar two sites are in species composition. The formula is: β = 2Sb/(S1 + S2) Where β = Sorensen's beta diversity index, Sb = the number of species shared by both samples S1 = the number of species in sample 1, and S2 = the number of species in sample 2. Let's calculate β to compare Sites 1 and 2. Sites 1 and 2 have eight species in common with each other. Thus β = 2(8)/(15+13) = 16/28 = 0.57.
Sorensen's Index has a maximum of 1.0 when both communities have identical species composition (no species turnover), and a minimum of 0, when both communities have no species in common (complete species turnover). Thus beta diversity is greatest at low values of β.
Gamma Diversity: Total species richness at all sites.
Terrestrial vs. Maritime Species Richness: Water is thicker or more viscous and has much higher specific heat than air. Because air is less dense, gases tend to diffuse much more rapidly and efficiently in air than in water, which results in O having a diffusion coefficient approximately 10,000x greater in air than in water. Vermeij and Grosberg argue that small animals such as arthropods can navigate more easily and more rapidly, expending less energy as they pass through the relatively unresistant air. Animals will lose much less heat to air than to water, allowing them to maintain a high body temperature and consequently a high metabolic rate. In addition, the high diffusion coefficient in air makes O more available in air than in water, which also increases a terrestrial animal's potential metabolic rate.
Over the past 50 years, the amount of N and P available to plants has approximately doubled, mostly due to human activities such as intensive farming and the production of synthetic fertilizers. Many studies have shown two effects of this fertilization process – an increase in primary productivity, and a decrease in species richness within plant communities.
Niche Dimension Hypothesis: Proposes that there are more niche dimensions when there are a greater number of limiting resources within a community, because each limiting resource opens up opportunities for a species that competes well when that particular resource is in short supply. This hypothesis predicts that decreasing the number of limiting resources will decrease species diversity.
Researchers found that plots with high levels of all four nutrients tended to have lower species richness than plots with lower levels of these four nutrients. Harpole and Tilman remind us that human activities are adding large quantities of nutrients to communities and thereby reducing niche dimensionality. If we extrapolate from a small scale to a large scale, resource supplementation may reduce species diversity within communities and across the globe.
Biodiversity and Tree Coverage
Giraffes and elephants reduce subcanopy tree coverage by more than 50%.
Mammalian herbivores reduce bird species diversity indirectly, by reducing tree canopy area and by reducing insect abundance.
Overall, trees in temperate forests averaged 29.0 species of folivorous insects, while trees in tropical forests averaged 23.5 species of folivores.
Higher tropical insect diversity is simply a reflection of higher tropical forest tree diversity.
Treefall Gaps: Openings in the canopy formed when an overstory tree falls down.
Community Stability
Intermediate Disturbance Hypothesis: Proposes that highest species diversity is maintained at intermediate levels of disturbance.
Stable: Tending to retain its current structure and functioning even when disturbed by biotic or abiotic forces. Stability can have a number of different meanings.
Resistance: A community's ability to avoid significant change in structure or function when disturbed, while resilience is the speed with which a community returns to its former structure and functioning following a shift caused by disturbance.
Two different predictions: 1) high species diversity should decrease the stability of individual populations of species within a community, and 2) high species diversity should increase the stability of communities as a whole.
For each species, researchers defined species stability (S) as equal to μ/σ, where μ is the mean biomass value for a time period and σ is the sample standard deviation over the same time period. A high value of S for a species indicates that the population biomass was relatively constant from year to year, while a low value of S indicates extreme fluctuation in biomass from year to year.
Niche Differentiation Hypothesis: Communities with more species will partition resources more efficiently, and use a greater proportion of the available resources.
Facilitation Hypothesis: Proposes that a diverse community is more likely to have at least one species that enhances some aspect of ecosystem function. These facilitators can create conditions that support the presence of other species within the community.
Sampling Effect Hypothesis (‘Portfolio Effect, Selection Effect): Proposes that more diverse communities are more likely to contain a highly productive species that responds quickly to disturbance.
Overyielding: An increase in ecosystem function in response to high species diversity.
___________________________________________________________________
Ch 18: Dan Janzen and Winnie Hallwachs
Janzen–Connell Hypothesis: Predicts that the peak of the population recruitment curve will be a considerable distance from the parent tree, the implication is that at least in tropical forests, it is unlikely that trees of the same species will be close to each other, thereby leaving space for other species. This could be one important explanation for high species richness in tropical forests.
The solution for distinguishing animals is a 650-base-pair segment of the mitochondrial cytochrome c oxidase subunit 1 (COI) gene. Each animal species’ COI base pair sequence is its barcode. Individuals of the same species will usually have a very similar or identical COI base sequence. Because mitochondrial DNA has a high spontaneous mutation rate, even very closely related species will usually have distinct COI base pair sequences. Thus, the DNA barcode is one tool to distinguish among very closely related species.
___________________________________________________________________
Part V: Ecosystem and Global Ecology
___________________________________________________________________
Ch 19: Ecosystem structure and Energy Flow
Ecosystem Services: Services that ecosystems provide that improve human well-being.
Applied Ecologists: Use ecological principles to evaluate threats to ecosystem structure, and ultimately to ecosystem services.
Millennium Ecosystem Assessment (MA): Focuses on four types of ecosystem services – the benefits people receive from ecosystems. 1) Provisioning services are essential material goods such as food, water, wood, timber (fuel), and fiber. 2) Regulating services influence components of the environment, such as climate, floods, disease, waste, and water quality. 3) Cultural services provide recreational, educational, spiritual, and aesthetic benefits. Underlying these three services are 4) supporting services, which include functional properties of ecosystems such as soil formation, photosynthesis, and nutrient cycling. Together, these four types of services form important linkages to human well-being. The MA identifies seven drivers of ecosystem change – factors that directly or indirectly cause a change in ecosystem processes. These drivers are: 1) changes in local land use and cover; 2) species introduction and removal; 3) technology adaptation and use; 4) external inputs such as fertilizer, pest control, and irrigation; 5) harvest and resource consumption; 6) climate change; and 7) natural, physical, and biological drivers.
The MA report is mixed; overall, 15 of 24 ecosystem services are being degraded or used unsustainably. The good news is that global food production has increased 160% since 1960, while human population has only doubled. This increase results from improvements in agricultural technology, and from increased conversion of natural biomes to agriculture. In theory, this translates to more food per person, but recent trends are mixed. Globally, the number of undernourished people has declined steadily from more than 1 billion in 1990–2 to 842.5 million in 2011–13. However, the number of undernourished people has actually increased over the same time period in some of the economically poorest countries or regions, for example increasing 28.7% in sub-Saharan Africa and 69.4% in the Near East and North Africa.
Production (Ecology): The amount of C that is fixed by the autotrophs (via photosynthesis) in a particular area.
Net Primary Production (NPP): Describe ecosystem production, which is equal to GPP minus the amount of C used by autotrophs for metabolism. NPP is most commonly expressed in terms of grams of C per m2 per year (g C/m2/yr). Net Primary Production (NPP) is primarily influenced by climate and nutrients.
NPP increases with mean annual precipitation up to about 2000 mm of precipitation, but levels off and begins to decline above 2500 mm. In contrast, NPP increases with mean annual temperature up to 30 degrees C, which was the highest mean annual temperature of studies that Schuur analysed.
Secondary Production: The amount of C that is passed on to the heterotrophs that live within an ecosystem.
Precipitation: At most precipitation levels, forested ecosystems fix 100–150 g C/m2/yr more than non-forested ecosystems.
Temperature: At low air temperatures, ectotherms such as decomposers have reduced metabolic rates. One consequence is that decomposition rates of litter on the forest floor are much lower in polar and subpolar regions than they are in tropical and subtropical biomes.
Researchers calculated the response ratio (RR) = ln (E/C), where ln is the natural logarithm, E is the measured value of the response to the supplement received by the experimental group, and C is the associated value in the unsupplemented control system. A value of RR less than zero indicates the control has higher production, and an RR value greater than zero indicates that the supplemented ecosystem has higher production. Because RR is a logarithmic function, RR = 1 indicates that the supplemented ecosystem has 2.718 (base of the natural logarithm) times the production of the control.
Overall, NPP is limited by both N and P in terrestrial, freshwater, and marine systems. P limits production to the same extent in all three types of ecosystems. In support of the prevailing doctrine, N does limit production to a greater extent in marine than in freshwater systems, but N limitation clearly is important in many freshwater systems as well.
Nitrogen-Mineralization: The process that converts organic N from decaying organisms into inorganic N that can be taken up by plants.
Eutrophication: Increased production resulting from adding nutrients to lakes.
Dead Zones: Extreme overproduction of phytoplankton.
Energy in Trophic Webs
Primary consumers ingest producers and occupy the second trophic level, secondary consumers ingest primary consumers and occupy the third trophic level, and tertiary consumers ingest secondary consumers and occupy the fourth trophic level.
The detritivores that eat dead organic matter, and the decomposers, primarily bacteria and fungi, that break down dead organic matter, use the energy released to fuel their metabolic processes, and absorb the released nutrients to build complex molecules.
A great deal of energy is lost to cellular respiration at all levels, with producers generally losing less than consumers.
The amount of energy available to one trophic level is a small fraction of what is available to the trophic level below it. This relationship, the trophic efficiency, is equal to (PN/PN − 1) × 100, where PN is equal to the production of one trophic level, and PN − 1 is equal to the production of the trophic level below it.
Trophic efficiency ranged from 5 to 20% for each energy transfer.
Biomass Pyramid: Higher trophic levels have the lowest biomass.
Some of the initial energy is consumed (IN), but the rest is not consumed and is lost to this food chain. Ecologists define the consumption efficiency as the percentage of available energy that is actually ingested or consumed (=(IN/PN − 1)100 in Figure 19.12). Second, some of the consumed energy is egested in feces and urine and not assimilated. Ecologists define the assimilation efficiency as the percentage of energy in food that is assimilated by the organism for metabolic processes (= (AN/IN)100). Because consumed energy must be either assimilated or egested, the assimilation efficiency is also equal to (100% − % egested). Lastly, a substantial portion of the assimilated energy is lost in cellular respiration. Ecologists define the production efficiency as the percentage of assimilated energy that is allocated to growth or production of offspring (=(PN/AN)100). The product of these three efficiencies = (consumption efficiency)(assimilation efficiency)(production efficiency), which defines the trophic efficiency, which is equal to (PN/PN − 1)100.
~62% of the organic matter in temperate forests is dead organic matter, mostly plants.
NPP in Temperate Forests
Furthermore, carnivores have a higher assimilation efficiency than herbivores (56% compared to 33%), which reflects the generally higher nutrient content of meat.
There are three important messages in this analysis. 1) Dead organic matter has a central role in temperate forest ecosystems. It receives input from every other trophic level and at any point in time contains the bulk of the production. 2) Most ecosystem production is actually passed onto decomposers, who process the bulk of the energy stored in the dead organic matter. 3) Consumption efficiencies are highly variable among trophic levels, ranging from 3.7% of producers consumed by primary consumers, to almost 90% of primary consumers and detritivores consumed by secondary consumers.
Microbial decomposers lose > 90% of their energy to respiration.
Production efficiency of most endotherms is a remarkably low 1–3%, while many ectotherms average between 20 and 50%
Energy Transfers
Food Chain Length (FCL): Measures the mean number of transfers from the base to the top of a food web.
Biomagnification: The tendency for substances, particularly toxins, to have higher concentrations at higher trophic levels.
CO2 Flux: The rate at which CO2 is exchanged with the atmosphere.
Lipophilic: Substances not easily broken down in the body; include novel organic substances, such as DDT.
Researchers now routinely use stable isotope analysis to estimate the trophic position of each species in an ecosystem.
There are three major hypotheses to explain what factors control FCL in ecosystems. The ecosystem size hypothesis proposes that larger ecosystems should have longer food chains because their greater habitat heterogeneity provides more ecological niches for a diversity of species. The environmental stability hypothesis proposes that food chains will be shorter in highly variable environments, because long food chains are less stable and more easily disturbed or disrupted. The resource availability or energy supply hypothesis proposes that FCL is limited by an ecosystem’s production. Because trophic efficiencies are generally quite low, less productive ecosystems will tend to have shorter FCLs.
The hypothesis that larger ecosystems have greater FCL, because island area varied from about 500 m2 to 2.6 × 10⁶ m2. They were able to test the hypothesis that more productive ecosystems have greater FCL, because the islands varied enormously in their production as a result of fecal N contributed by nesting and roosting seabirds that frequented some islands.
More productive islands had a greater abundance and greater species richness of insects that could feed the top predators, which were two species of spiders and two species of geckos.
___________________________________________________________________
Ch 20: Nutrient cycles
In the Black Sea, eutrophication appears to be the primary cause of massive phytoplankton blooms. Between 1950 and 1980, levels of both N and P compounds more than doubled in the Danube and Dnipro River systems as a consequence of agricultural runoff and emissions from fossil fuel use. Huge pig farms produced large quantities of nitrogenous waste, and growing urban populations of humans generated increased N-rich sewage and phosphate-rich detergents, all of which ran off into the river systems, and ultimately into the shallow shelf in the northwest corner of the Black Sea. Elimination of the red algae fields was an early step in the formation of a dead zone, causing the death of most aerobic benthic organisms. When the massive assemblage of phytoplankton die off, their bodies are decomposed by large communities of bacteria and eaten by detritivores, both of which use the oxygen in the water for cellular respiration. Under these conditions the water may become anoxic. When this happens, the water is unsuitable for aerobic organisms for several months during the spring and summer.
Eutrophication: The addition of excessive nutrients such as N and P into bodies of water, which leads to massive phytoplankton blooms.
Dead Zones: A region in a body of water in which dissolved oxygen levels drop below 2.0 ml/l for an extended period of time, causing the death of most aerobic benthic organisms.
Anoxic: A body of water that’s lost virtually all of its dissolved oxygen.
Mnemiopsis: A native fish species to the western Atlantic Ocean, and a voracious and effective predator on many zooplankton species in its native habitat. It has an unusually high reproductive rate, producing up to 8000 eggs at 13 days after its own birth. It did not reach its highest population in the Black Sea until 1989, which coincided with the collapse of the anchovy fishing industry there. Anchovies had constituted about 60% of the total Black Sea fish catch in the second half of the twentieth century. Ahmet Kideys and his colleagues (2005) propose that Mnemiopsis outcompeted the anchovies for zooplankton, leading to the precipitous decline in this critical fishery, and at the same time, increasing phytoplankton abundance. Looking closely at the photograph of the Black Sea, you will notice the narrow Bosphorus Strait, which provides the only outflow from the Black Sea into the much larger Mediterranean Sea. Because this connection is so small, averaging 1.6 km wide and 36 m deep, water in the Black Sea has an unusually long turnover time, taking an average of 300–400 years to renew itself. This contributes to small tides and weak currents; consequently, nutrients are slow to disperse from their origins, enhancing the impact of eutrophication.
Nitrogen Cycle: Characterized by the transformation or conversion of molecules from one chemical form to another.
N gas (N2) makes up 78% of our atmosphere, but the N2 molecule is held together by a powerful triple bond, which makes it inaccessible to most organisms. N fixation is the reaction that transforms N2 into a form that is biologically accessible to most organisms.
Biotic Fixation: Several types of microorganisms have adaptations that allow them to break the triple bonds of N2 gas and convert N2 to ammonia (NH3). Ammonia can be further processed to construct biologically important molecules such as proteins and nucleic acids.
There are many free-living bacteria and archaeans that can fix N. All of them use some form of the nitrogenase enzyme complex to catalyze the following reaction: N2 + 8H+ + 8e- → 2NH3 + H2 This is an energy-demanding process, which requires the conversion of at least 16 ATP to ADP (ATP → ADP). Oxygen (O2) inactivates nitrogenase, thus aerobic nitrogen fixers have evolved a variety of mechanisms to protect nitrogenase from O2 inactivation.
Haber–Bosch Process: An industrial application that converts N2 to ammonia (NH3), and allows large-scale production of inorganic fertilizers.
A second source of NH3 in the N cycle arises from the decomposition of complex N-rich molecules – such as proteins and nucleotides – that are released from dead organisms. The NH3 generated by this process of ammonification is readily assimilated by plants and microorganisms, and is often kept within the ecosystem.
Nitrification: The conversion of ammonia to nitrate and nitrite (NO2−).
A byproduct of natural selection leading to the evolution of these metabolic pathways is that much of the NH4 within ecosystems is ultimately converted to NO3 by nitrosifying and nitrifying bacteria working in tandem.
Denitrification: the reduction of nitrates and nitrites to nitrogen gas. The complete denitrification process is expressed as: 2 NO3− + 10 e− + 12 H+ → N2 + 6 H2O.
Anammox (Anaerobic Ammonium Oxidation): The anaerobic oxidation of NH4+. Anammox is a complex process, involving the coordinated efforts of more than 200 genes (Strous et al. 2006). We don’t have the space here to go into the details of this reaction, which is outlined as: NH4+ + NO2- → N2H4 (hydrozine) → N2 + H2O
Researchers such as Tage Dalsgaard and colleagues (2005) have argued that given that 87% of the ocean is more than 1000 m deep, and that two-thirds of marine N2 production occurs in sediments rather than in the water column, then we can extrapolate that about half of marine N2 production occurs from anammox.
One important flux in the N cycle is fixation of N2 by cyanobacteria in the genus Trichodesmium. These organisms are extraordinarily abundant and have been identified as making substantial contributions to the amount of fixed nitrogen in the oceans.
In the atmosphere, N2O has a mean residence time of 120 years, during which time it acts as a powerful greenhouse gas, and contributes substantially to global warming. In addition, N2O is now the most potent destroyer of ozone molecules in the stratosphere.
Diet Optimization: Occurs when humans switch their meat intake to animals that more efficiently convert N to protein.
Phosphorous Cycle
There is a great deal of P in the world, and most of it is inaccessible to organisms. The problem with P is physical rather than chemical, with the vast majority stored in marine sediments or in deep ocean waters.
Mycorrhizal fungi substantially reduce the loss of phosphate in this greenhouse experiment and, more importantly, would have the same effect in nutrient-poor grassland ecosystems, such as are typically found in sandy grasslands. Preventing losses from leaching retains phosphorus in the local nutrient cycle, so that it remains available to other organisms in the food web (Van der Heijden).
Nutrient flux: The rate of nutrient movement from one pool or reservoir to another.
Influx: Movement into a pool
Efflux: Movement out of a pool.
Nutrient Sink: A pool in which influx is greater than efflux.
Nutrient Source: A pool in which efflux is greater than influx.
There are two ways for an organism to compete successfully for a nutrient that is in short supply. One way is to be better at taking it up, and the second way is to use much less of it than its competitors.
Leaching: Loss of nutrients as they move vertically through the water column.
Decomposition
When an organism dies, saprotrophs, which comprise decomposers (bacteria and fungi) and detritivores (animals), use the free energy locked in these macromolecules to drive their metabolic processes. The process of mineralization breaks down organic molecules into inorganic molecules, and allows these molecules to be taken up by cells. The reverse process, immobilization, occurs when inorganic molecules (what we have been calling nutrients) are taken in by an organism and converted to organic molecules.
Recall that decomposers in forested systems use the chemical bond energy in C-based macromolecules such as lignin and cellulose to convert ADP to ATP and fuel their metabolism. In this process CO2 is released, and there is an overall decrease in litter mass.
Decomposition rates are greater in the leaf litter with the highest N content.
Parton and his colleagues conclude that initial N content in leaves plays a critical role in net N immobilization and release during long-term litter decomposition.
Finding that total nitrate uptake velocity and that nitrate uptake velocity due to denitrification decrease sharply with nutrient loading, indicates that streams are able to be efficient nitrate sinks up to a point, but that additional nutrient loads are handled very inefficiently.
The researchers explain this lack of NH4 export as arising from rapid nitrification of NH4 into NH3, which then ran off into the stream. Nitrification also generates an excess of H ions; if these ran off, they could be responsible in part for the decrease in pH observed in the stream in the clear-cut watershed.
___________________________________________________________________
Ch 21: Disturbance and Succession
Following an extreme disturbance, the ecosystem may go through the process of primary succession, which is characterized by a predictable series of developmental stages that culminate in a climax community – a stable biotic community that represents the final stage of succession.
Disturbance: A relatively discrete event that disrupts the structure of an ecosystem, community, or population by changing either the physical environment or the resources it contains.
Regime Shift: A relatively rapid change in ecosystem structure and functioning.
Forest Fires
Crown Fires: The most severe of forest fires; kills all canopy trees, their needles burning completely, leaving only bare ground and no soil litter.
Severe Surface Burn: Less intense than crown fires with extensive canopy tree mortality but many needles unconsumed, and some surface litter present.
Light Surface Burn: The least severe of forest fires; trees have scorched stems but little mortality, and most of the soil organic layer is intact.
Serotinous Cones: Cones which remain closed for many decades, are retained by the tree, and only open when heated by intense fire, releasing seeds onto the mineral soil that becomes available after fires. Serotiny may be favored when fire intervals are long enough to burn hot enough to open the cones, but are shorter than a tree's expected lifespan.
Succession
Primary Succession: The recovery process that follows disturbances of high intensity.
Secondary Succession: The pattern of recolonization following a disturbance in which only some of the organisms are killed, such as occurred in the 1988 fires at Yellowstone National Park.
Climax Community: A stable biotic community that is in equilibrium with existing environmental conditions and represents the last stage of succession.
Succession post disturbance
Facilitation Model: Proposes that the first colonizers are shade-intolerant pioneer species, with life history traits such as high fecundity, good dispersal powers, efficient germination in open spaces, and rapid growth, that modify the environment in such a way that it becomes less suitable for future pioneer species but more suitable for later successional species.
Over time, late-succession species, which can tolerate conditions of limiting resources, tend to dominate the community.
Inhibition Model: Proposes that early- and late-succession species colonize a habitat following disturbance, with the majority of early colonizers having the characteristics of pioneer species. Once an individual secures a space or other limiting resource, it inhibits the invasion of all other plant species.
Red Alder (Alnus rubra): Has an important mutualism with N-fixing Frankia bacteria. The mutualism allows red alder to survive in the N-deficient soils characteristic of the debris-avalanche zone.
Cryptophytes: Species with dormant buds located below the surface.
Coral Recovery: There are two possible avenues for coral ecosystem recovery. One is for propagules from other reefs to disperse into the ecosystem. The second is to produce a large number of broods locally.
Coral Recruitment: The process in which tiny planulae (larvae) attach to a substrate and establish themselves in the reef.
___________________________________________________________________
Ch 22: Geographic and Landscape Ecology
Species-Area Relationship: S = cA^z; S: number of species, c and z are constants fitted to the data, A: area.
z: describes how quickly species richness increases in relation to island area. In almost all cases the z-value is much less than 1, indicating, for example, that if one island has 10 species, a second island that is twice as large might be predicted to have 12 or 13 species, rather than 20 species. A high z-value indicates that species richness increases rapidly with area, while a low z-value indicates a more gradual increase.
c: A constant that depends on a variety of factors including the units of area being considered, the taxonomic group being considered, and several other factors whose importance is debated by geographical ecologists.
The meta-analysis reveals that the steepness of the species–area curve tends to decrease with latitude, with higher latitudes having the shallowest species–area relationships and tropical habitats showing the steepest species–area relationships.
High tropical z-values indicate that species ranges tend to be smaller in tropical than higher latitudes.
Disjunctions: Distributions of closely related species or species groups over widely separated regions of the world.
Retroposons: Pieces of DNA that are transcribed to RNA, then reverse transcribed to DNA, and reinserted back into the genome at a random location. These retroposons are wonderful genetic markers, because it is very unlikely that two independent events would retropose identical sequences back into identical, randomly selected locations. So, two species sharing the same retroposon are likely to be related to each other.
Molecular Clock Hypothesis: Assumes that DNA base substitutions occur as a linear function of time. By counting the number of different bases in the six chosen genes for each species, its possible to estimate how long ago each species shared a common ancestor (Bonacum).
Landscape Ecology: Explores how variation in landscape structure, such as configuration or scale, influences the distribution and abundance of species.
Landscape: An area that is spatially heterogeneous in one factor of interest.
Shrinkage: A reduction in habitat size without fragmentation or subdivision.
Bisection: Division of a habitat into two smaller areas.
Perforation: Introduction of holes of unsuitable habitat into a native habitat.
Fragmentation: Division of a habitat into a larger group of smaller unconnected pieces.
Scale: Described by grain and extent.
Grain: The finest resolution used for viewing a phenomenon. It could be the pixel size of a remote camera, or the cell size of a GIS map.
Extent: The overall size of a study area.
Ecological Trap: An area in which individuals of a species actively select habitat based on some attribute and that chosen area results in lower fitness than alternatives.
Biological Dynamics of Forest Fragments Project (BDFFP): A study designed by a group of scientists in 1979 to assess the effects of fragmentation on the Amazonian landscape. The project's original goals were to assess the effect of fragment size on species richness and ecosystem processes, to determine a minimum size for effective rainforest reserves, and to resolve a related debate over whether it was best to have a small number of very large reserves or a large number of smaller reserves.
___________________________________________________________________
Ch 23: The Carbon Cycle and Climate Change
There is always some uncertainty associated with scientific conclusions; science never absolutely proves anything. When someone says that society should wait until scientists are absolutely certain before taking any action, it is the same as saying society should never take action.
The United Nations Environment Programme (UNEP) and the World Meteorological Organization (WMO) established the International Panel on Climate Change (IPCC) to provide a clear scientific view on the current state of knowledge in climate change and its environmental and socioeconomic impacts.
Using terms like “very likely” makes the public believe that the evidence for human-caused global warming is weak, and that there is serious debate in the scientific community about the IPCC's core finding.
Carbon-Cycle: Describes how C moves between the atmosphere, the oceans and the land. Most of the world's C is stored in 1) carbonate rocks and 2) deep ocean waters. C in both of these reservoir’s cycles very slowly, though upwelling of ocean waters contributes considerable quantities of C to the C cycle.
Ocean Carbon: Oceans hold a considerable amount of CO2 because CO2 is a weak acid, and ocean water is somewhat alkaline. CO2 tends to diffuse rapidly into cold water, such as found in high latitudes, and out from warm tropical water into the atmosphere, particularly in areas of upwelling. Dissolved inorganic C is used by photosynthetic marine organisms (primarily phytoplankton) at the rate of ~50 Pg/yr (Pg = petagram = 10e15 g). When these organisms die, much of this organic carbon (37 Pg/yr) is metabolized by decomposers and returned to the ocean surface C pool. But a smaller portion (11 Pg/yr) sinks deeper in the ocean to join the intermediate and deep ocean reservoir.
Most of the CO2 uptake from the atmosphere reacts with ocean water to form H2CO3 (carbonic acid), which is converted into HCO3− (bicarbonate) and CO32- (carbonate), as described by the following two equations: CO2 + H2O ⇌ H2CO3 (carbonic acid) ⇌H+ + HCO3- (bicarbonate) ⇌ 2H+ + CO32- (carbonate) and CO2 + H2O + CO32- ⇌ HCO3- + H++ CO32- ⇌ 2HCO3- The approximate ratio of CO2, HCO3−, and CO32- (collectively known as dissolved inorganic carbon) in the ocean is 1:100:10.
Since industrialization, and the consequent increases in atmospheric CO2 levels, the ocean has become an important CO2 sink, currently importing 80 Pg/yr and exporting 78.4 Pg/yr of CO2, which yields a net influx of 1.6 Pg/yr.
Carbonate is alkaline, and serves as a buffer in the ocean. Adding CO2 to the ocean reduces the amount of carbonate (as a result of the last equation above), which reduces the buffering capacity of the ocean and causes more (acidic) H+ ions to remain in solution. The upshot is that high atmospheric CO2 levels make the ocean more acidic.
CO2 diffuses into cold surface waters very quickly. Cold water is denser than warm water, so these CO2-rich waters sink into the ocean depths, beginning a very slow southern journey that is part of the meridional overturning circulation, also known as the great ocean conveyer.
Most of the CO2 exchanges between the atmosphere and terrestrial systems are a result of the interplay of photosynthesis, which takes up CO2 in the process of carbon fixation, and cellular respiration, which generates CO2. Plants and decomposers in the soil do almost all of the cellular respiration.
Anthropogenic Carbon
Since industrialization, humans have increased the global CO2 flux, by burning fossil fuels and by manufacturing cement, which together add about 7.8 Pg/yr of CO2, and by land-use changes, which add another 1.6 Pg/yr. The land-use changes include converting forests to less productive ecosystems, and using agricultural practices that reduce soil production and may lead to soil erosion and desertification, and further reduction in production. The fossil fuel flux is still increasing steadily, from an average of 5.4 Pg/yr during the 1980s to 6.4 Pg/yr during the 1990s, to 7.8 Pg/yr in the 2000–9 decade. The value for 2013 was up to 9.9 Pg/yr.
Using data from Mauna Loa in 1958-1995, Keeling reasoned that total global photosynthetic activity declined in fall and winter, allowing CO2 to build up gradually in the atmosphere, peaking in late winter and early spring. By May and June, photosynthesis rates were increasing, and atmospheric CO2 levels began to decline.
Since 2000, the annual increase in atmospheric CO2 levels has averaged about 4.2 Pg/year (~2 ppm/year).
The flux of CO2 between the atmosphere and the ocean is determined by a variety of environmental factors, which differ at each location. The reaction is expressed as follows: Flux =-KgK0 (pCO2sur – pCO2at) Where Kg = the air–sea gas transfer coefficient, which varies in relation to temperature, wind speed, and salinity, K0 = the solubility of CO2 at a particular temperature and salinity pCO2sur = partial pressure of CO2 in the surface water pCO2at = partial pressure of CO2 in the atmosphere.
Increasing CO2 concentration will increase CO2 partial pressure. The flux equation tells us that CO2 diffusion into the ocean (influx) happens more quickly when the difference between the concentration of CO2 in the atmosphere above the ocean and the surface water [pCO2sur – pCO2at] is at a maximum. As humans increase the amount of CO2 in the atmosphere, [pCO2sur – pCO2at] becomes more negative, making total flux more positive, and increasing the influx of CO2. In contrast, there are regions of the ocean with unusually high pCO2sur, which results in a positive value for [pCO2sur – pCO2at] and a negative flux value, causing an outgassing of CO2.
The solubility of CO2 in water is greatest at cold temperatures (which is why some of our favorite carbonated beverages tend to go flat if we leave them out on a summer day).
Since industrialization, anthropogenic, or human-caused, sources are fossil fuel burning and cement production, and land-use changes that reduce global photosynthesis.
Greenhouse Gas (GHG): A molecule in the atmosphere that warms Earth's surface because it absorbs some of the longwave radiation emitted from Earth's surface. GHG’s include CO2, CH4, CFC’s, NOXs, NO2, H20 (g), and O3.
Longwave radiation emitted by Earth is key to understanding the greenhouse effect. Under current conditions, about 10% of Earth's longwave radiation escapes into space, but the remainder is absorbed by GHGs in the atmosphere (and H2O in clouds), which then re-emits this radiation in any direction. Some re-emitted radiation escapes into space, and some returns to Earth's surface and may be reabsorbed and re-emitted, thereby increasing surface temperatures by about 21°C above what they would be without any GHGs in the atmosphere
Neither N2 nor O2, the atmosphere's two most abundant gases, absorb significant longwave radiation. Rather, water vapor and CO2 are the world's most important greenhouse gases, because they are relatively abundant in the atmosphere and they absorb longwave radiation at several different wavelengths.
O3: Most effective at absorbing longwave radiation with wavelengths between 9.5 and 10 μm.
With the exception of ozone's activity, no natural GHGs absorb in the wavelength range of 8.2–14 μm, which because of its transparency to radiation is known as the atmospheric window of the spectrum.
Most atmospheric O3 resides in the stratosphere between 12 and 30 km above Earth's surface. This O3 layer is critical to life on Earth, because O3 absorbs UV-B radiation from the Sun, protecting organisms from UV's harmful carcinogenic and mutagenic effects.
Dobson Units (DU): A measure of ozone (O3) concentration.
Halocarbons: Includes CFCl3 and CF2Cl2 (CFCs); present in the atmosphere almost entirely as a result of humans using them to pressurize spray cans and as refrigerants. Because they destroy O3 in the stratosphere, several types of halocarbons were banned by the Montreal Protocol, which required them to be phased out and completely eliminated by 1996 in industrialized countries and by 2006 in developing countries.
Water Vapor: A powerful GHG; warmer temperatures cause higher water evaporation rates, leading to increased atmospheric water vapor, so the direct effect of higher surface temperature is to increase the absorption of Earth's longwave radiation, thereby increasing Earth's surface temperature. This positive feedback interaction is a very important source of global warming.
Exposure to high CO2 concentrations increases photosynthetic rates by 31% and C uptake during the day by 28%. In addition, transpiration efficiency – a measure of the amount of biomass produced in relation to the amount of water lost from transpiration – increases by 50% in comparison to controls. Presumably, at higher CO2 levels, plants are able to keep their stomata closed or partially closed for extended periods of time, which reduces their transpiration rates.
Rubisco, the enzyme that binds CO2 in C3 plants, is less efficient than PEP carboxylase, the corresponding enzyme in C4 plants. Consequently, C3 plants must keep their stomata open for longer periods, and thus tend to lose more water through transpiration, so we would expect C3 plants to benefit more than C4 plants from CO2 enrichment.
Crop yield increases 17% overall, but only significantly in one crop (cotton) and not significantly in the three food crops (rice, wheat, and sorghum). This value is much lower than was found in CO2 enhancement studies conducted in isolated chambers, and is disappointing from the standpoint of projecting yields under the high atmospheric CO2 conditions that we expect to experience in future years.
High atmospheric CO2 levels cause plants to use water more efficiently, losing less water to transpiration. One possible consequence is that soil moisture should increase, which in some ecosystems could reduce the O content of the soil. Anoxic soils are hospitable environments for anaerobic organisms, including methanogens that generate CH4 as a byproduct of their metabolic processes, and anaerobic denitrifying bacteria that produce nitrous oxide. The upshot is that high CO2 levels could indirectly generate more GHGs.
Across species, organisms are changing latitudes about as quickly as temperatures are increasing – about 16.9 km per decade. However, organisms are increasing elevation at an average of 11.0 m per decade, which is considerably slower than climate is warming. Importantly, for both latitude and elevation, range shift is greatest where warming is most rapid.
Researchers concluded that one possible outcome of climate change is fragmentation of populations which can lead to a loss of genetic diversity and an increase in the probability of extinctions.
Researchers propose that climate warming directly enhanced growth by lengthening the growing season, increasing soil temperature, deepening the layer of unfrozen soil, and thus increasing nutrient availability.
Climate Modeling
Radiative forcing (W/m2): Describes the influence that a change in a climatic factor, such as a GHG, has on altering the balance of incoming and outgoing radiation, as measured at the top of the troposphere. A radiative forcing of ~1.0 W/m2 should increase global surface temperatures by about 0.5°C.
Global Warming Potential: Measures the radiative forcing by a known mass of a GHG in comparison to the radiative forcing of the same amount of CO2 over a certain time period (usually 100 years). Because it is a relative measure that compares gases, the global warming potential is expressed numerically without units.
Climate models simulate planetary heat exchange using equations that were derived and tested by physicists more than a century ago, coupled with more recent data and equations that describe the movement of the atmosphere, such as Hadley and Ferrell cells and the Coriolis effect, SST, humidity, friction, and gravity.
Most of the models project an increase in the intensity of storms, because cloud formation releases thermal energy into the atmosphere, resulting in a more intense hydrological cycle and in more severe storms. Somewhat counterintuitively, most of the models project an increase in droughts, partially from high rates of water loss from evapotranspiration, and partially from most precipitation falling during relatively few very intense storms that are scattered throughout the year. With these intense storms, much of the water will run off without being absorbed by the soils.
A second finding, captured by both models, was that volcanic eruptions tended to lead to brief periods of global cooling. This happens because volcanoes belch large quantities of aerosols – small solid or liquid droplets – that tend to cool Earth by reflecting incoming solar radiation back into space.
James Orr and his colleagues (2005) project that carbonate depletion will become critical when atmospheric CO2 levels climb above 550 ppm, which will occur by the year 2100, according to most IPCC scenarios.
___________________________________________________________________
Ch 24: Jane Lubchenko
Applied Research: Research that has the potential of benefiting society.
The Sustainable Biosphere Initiative (SBI): Published in 1991 and established a framework for the acquisition, dissemination, and utilization of ecological knowledge based on three processes: 1) basic research for the acquisition of ecological knowledge, 2) communication of that knowledge to citizens, and 3) incorporation of that knowledge into policy and management decisions. The SBI established three research priorities: 1) global change, included “the ecological causes and consequences of changes in climate; in atmospheric, soil and water chemistry (including pollutants); and in land and water use patterns,” 2) biological diversity, included “natural and anthropogenic changes in patterns of genetic, species and habitat diversity; ecological determinants and consequences of diversity; the conservation of rare and declining species; and the effects of global and regional change on biological diversity,” and 3) priority, sustainable ecological systems, included “the definition and detection of stress in natural and managed systems; the restoration of damaged systems; the management of sustainable ecological systems; the roles of pests, pathogens and disease; and the interface between ecological processes and human social systems”
___________________________________________________________________
Animalia
Mammals
Ruminants: Mammals, such as buffalo and wildebeest, that digest plant-based food by initially softening it within their rumen, where it ferments with the help of microorganisms that live there. They then regurgitate the semi-digested mass, chew it, and swallow it again.
Marsupials: There are two marsupial superorders;
Ameridelphia: A superorder of marsupials that comprise the orders Didelphimorphia (opossums) and Paucituberculata (shrew opossums), which live in South and Central America.
Australidelphia: A superorder of marsupials which comprise the orders Dasyuromorphia (many species including the Tasmanian devil), Peramelemorphia (bandicoots), Notoryctemorphia (marsupial moles), and Diprotodontia (koalas, wombats, possums, and kangaroos) which live in Australia.
Rabbits: (and many other mammals) Use coprophagy, reingestion of their feces, to extract nutrients from grass. Microorganisms living within the rabbit gut produce substantial metabolic waste, and several types of B vitamins and lactic acid. Feces-deprived rabbits show depressed weight gain and reduced protein and nitrogen utilization (Schmidt-Nielsen 1997).
Amphibians
Amphibian populations are declining at an alarming rate worldwide (Stuart et al. 2004). There are numerous reasons underlying this decline, including habitat loss and habitat fragmentation, as well as a host of non-landscape-related causes such as the virulent fungus, Batrachochytrium dendrobatidis, UVB radiation, introduction of exotic species, and pollutants.
Amphibian species with aquatic larvae experience a major niche shift during development, switching from aquatic to terrestrial habitats as they mature, and returning to aquatic habitats to breed. In undisturbed habitats, suitable aquatic and terrestrial habitats are often near each other. However, in disturbed habitats, there may be a large spatial separation between these two types of habitats. This division is described as habitat split, and may underlie a substantial portion of the decline in amphibian populations (Becker, 2007).
Birds
Passenger Pigeon (Ectopistes migratorius): Previously the most abundant bird in North America, with a population of ~4B individuals in 1800. Just over 100 years later, the last known individual died in the Cincinnati Zoo.
Insects
Cicadas: Larvae in the genus Magicicada live underground for 13 or 17 years, eating root xylem sap. They emerge and metamorphose in tremendous numbers (in some cases several million individuals per hA) to live a relatively brief adult lifespan of about 3 weeks’ duration. Adults form large groups, where males sing and mating occurs. Most females mate only once, as males provide them with copulatory plugs that block the female’s reproductive organ, and presumably inhibit future mating’s.
Fireflies: Male Photinus greeni fireflies fly at dusk, and emit two flashes about 1.5 s apart. Females are flightless, and if responsive, flash back at a signaling male with a single flash. When he is receiving flashes from a receptive female, a male continues his flash sequences as he gradually gets closer and closer to the female. Sometimes an initially responsive female stops flashing when the male gets closer, effectively ending the courtship sequence.
Bees: The queen controls the sex of her offspring by choosing to lay unfertilized eggs, which develop into haploid male drones, or to fertilize eggs, which develop into diploid female workers.
Monarch Butterflies
1992: Project Monarch Watch is established to continue the study of the fall migration of monarchs.
March, 2012 is the warmest on record throughout many sections of the north central United States. Journey North's data showed that the first milkweed emerged in early April, about a month earlier than usual.
Damselflies: Males remove the sperm that the previous male ejaculated into the female's sperm-storage organ.
Caterpillars: Feed adaptively in ways that minimize their probability of being detected by birds that use “messy leaves” as a cue for the presence of tasty prey.
Poriphera
Sponges: Transfer substantial quantities of N to adventitious mangrove rootlets, while the rootlets are leaking substantial quantities of C compounds that are absorbed by the sponges.
___________________________________________________________________
Protista
Kelp: Large brown algae that live in shallow nutrient-rich waters in temperate latitudes, in water temperatures generally between 5° and 20°C. Kelp are anchored to the seafloor with holdfasts – structures that superficially resemble roots.
___________________________________________________________________
Monera
Bacteria
Hypolithic Cyanobacteria: Photosynthetic microorganisms able to subsist on the moisture absorbed by stone.
Mycobacterium tuberculosis: The bacterium that causes tuberculosis.
In 2012 the WHO estimates a global infection rate of one in three people. Approximately 10% of people carrying the bacterium will actually become symptomatic over the course of their lifetimes, presenting symptoms that include fever, a bad cough (sometimes with blood), night sweats, and weight loss over the course of a few weeks. TB is most prevalent in Africa and Asia, and is most likely to be expressed in people with immune systems that are already weakened by diseases such as HIV infection, and by poor nutrition. >1.5M people die from TB each year.
___________________________________________________________________
Eukaryotes
Malaria: Kills ~2M people per year, will be particularly difficult to eradicate, because it is infectious for a very long period of time (very high L) and is transmitted very effectively by its mosquito vector (very high β).
___________________________________________________________________
Terminology
Abiotic Factors: Disturbances such as fire, floods, windstorms, and droughts.
Acetylcholine: A neurotransmitter that plays an important role in stimulating muscle contraction in many animals. After binding to receptors on the muscle cell membrane, and possibly stimulating the muscle cell to contract, acetylcholine is released back into the synaptic cleft, and broken down by the enzyme acetylcholinesterase (AChE) into acetate and choline. The acetate is taken up again by the nerve cell, and used to synthesize more acetylcholine.
Anadromous: A fish that spends much of its life at sea, and moves into freshwater to breed.
Hypothesis: Provisional Explanations for observations. observations. To be worthy of study, hypotheses must be plausible and generate testable predictions. Predictions are logical outcomes that are likely to be true if the hypothesis is true.
Null Hypothesis (H0): A hypothesis a researcher tries to disprove.
Research Hypothesis (HR): A hypothesis a researcher tries to prove.
Meta-Analyses: Systematic analyses of data collected independently by other researchers.
Modeling
Sensitivity: The number of correct positive predictions.
Specificity: The number of correct negative predictions.
Pluvial: A period of increased rainfall.
Power Functions (Power Laws): The relationship between two variables, x and y, in the form of y = kxc, where k and c (the exponent) are constants.
Predator Saturation: Prey survival rates are high because there are simply too many species present in an area for predators to eat them all.
Regression Line: Line of best fit.
Coefficient of Determination (R2): Measures the proportion of the variance of the data explained by the line of best fit in a regression analysis. R2 ranges between 0 and 1 – higher R2 values indicate closer fit between the observed data and the regression
Solute: The minor component in a solution, dissolved in the solvent.
Solvent: Able to dissolve other substances.
Ultraviolet-B (UVB): Light with wavelengths of 290–320 nm; higher energy and potentially more destructive than UVA radiation (320–400 nm).
___________________________________________________________________
Chronology
2011: The Institute of Medicine of the National Academies issues a report that concludes that chimpanzees had been a valuable research model in the past, but that they were no longer necessary for most current biomedical research. The use of chimpanzees could only be considered if three conditions were met: 1) the knowledge gained must advance public health, 2) there must be no other suitable research model available, and the research could not be ethically done with humans, and 3) the chimpanzees must be maintained in natural habitats or in an ethologically appropriate physical and social environment – an environment that is conducive to normal behavior.-Ecology by Singer.
2007: The US suffers 3630 cases of the most severe type of West Nile virus, which kills 124.-Ecology by Singer.
2003: Camille Parmesan and Gary Yohe explore the impact of climate change on natural systems finding that a) global warming associated with climate change has caused an advance of phenologically related events over recent history; advancement in the date of frog breeding, bird nesting, first flowering, tree budburst, and the arrival of migrant birds and butterflies, and b) that global climate warming has shifted the distribution of species over recent history, showing that first, species in the N. hemisphere expand their range in a N direction. Second, species in the S. hemisphere expand their distribution in a S. direction. Third, species on mountains move higher in elevation. Fourth, species adapted to very high altitudes or latitudes decline in abundance because there would be less suitable habitat available to them.-Ecology by Singer.
1999: West Nile Virus first appears in North America in NYC.-Ecology by Singer.
1998: The Sea-viewing Wide Field-of-view Sensor (SeaWiFS) project sponsored by NASA launches a satellite into space with a mission of obtaining color data of the ocean's surface. The color-enhanced picture of the Earth sent back by the SeaWiFS satellite showed that the ocean is not a uniform blue color but also has various shades of green, yellow, and orange. These non-blue colors represent high concentrations of phytoplankton.-Ecology by Singer.
1997-1998: The Strongest El Nino on record.-Ecology by Singer.
1989: Collapse of the Black Sea’s anchovy fishing industry as Mnemiopsis outcompete anchovies in the sea for zooplankton.-Ecology by Singer.
1988: Yellowstone National Park endures 3 months of fires, which burns ~36% of the park. ~80% of the park had been covered with forests of lodgepole pine, Pinus contorta, which under very dry conditions can fuel large and devastating crown fires. Historical evidence from pollen cores and tree rings reveal that these intense conflagrations have occurred, on average, every 100- 500 years over the past 10,000 years.-Ecology by Singer.
1979: A group of scientists begin the Biological Dynamics of Forest Fragments Project (BDFFP) to assess the effects of fragmentation on the Amazonian landscape.-Ecology by Singer.
1977: Peter Lonsdale discovers a benthic ecosystem in some of the ocean’s deepest trenches, where tectonic plates are separating and molten rock heats the water to over 400°C. Hot water passing through the underlying rocks releases many nutrients, including vast quantities of H sulfide. Chemosynthetic sulfur-oxidizing bacteria are adapted to the HP in the ocean depths and to the glut of a dependable sulfur source, oxidizing the H sulfide and using the energy released from this process to synthesize carbohydrates. A diverse array of organisms either feed on these bacteria or have symbiotic relationships with them.-Ecology by Singer.
Spring, 1975: A boat carrying ~40 heavily armed members of the Parti de la Révolution Populaire enter the Gombe research camp at night and kidnap four American students. The invaders’ goal was to overthrow the government in Zaire, and replace it with a Marxist society, using the students as valuable hostages for securing funding for this operation. Ultimately, the kidnappers exchange their hostages for money and the release of several political prisoners. 22 years later, the rebel leader, Laurent Mobuto, became president of Zaire, which he renames the DRC.-Ecology by Singer.
1973: The USG passes the Endangered Species Act (ESA). Once listed as endangered, a species must be treated following certain guidelines, which include designation of critical habitat essential to species survival, and establishment of a scientifically sound recovery plan.-Ecology by Singer.
1969: Robert Paine coins the term “Keystone Species” to describe the role of the sea star, Pisaster ochraceus, in Mukkaw Bay off the northern WA State coast.-Ecology by Singer.
1969: The Santa Barbara oil spill.-Ecology by Singer.
1968: The US National Park Service (NPS) opts for a policy of natural regulation, which results in a dramatic increase in Yellowstone elk herds until wolves are reintroduced in 1995.-Ecology by Singer.
1966: Commercial whaling for humpbacks is banned in the N. Pacific.-Ecology by Singer.
1956: Walter Plowright, a veterinarian working for the East African Veterinary Research Organization, helps develop a vaccine against rinderpest, and begins inoculating cattle in East Africa.-Ecology by Singer.
1950-1951: The “Winter of Terror” in the European Alps; 649 avalanches kill at least 265 people and cause tremendous property damage.-Ecology by Singer.
1944: The ivory-billed woodpecker is last observed in nature.-Ecology by Singer.
1911: The International Fur Seal Treaty is enacted to protect the few surviving colonies of Fur Seals.-Ecology by Singer.
1890: The Great Rinderpest Plague (originated in Europe) kills ~95% of cattle in southern and eastern Africa.-Ecology by Singer.
1845: ~20 red foxes (Vulpes vulpes) are introduced to Australia to provide sport for European colonists. Since that time, the red fox has spread throughout Australia, and in many areas, it has become an important predator on small and medium-sized mammals.-Ecology by Singer.
1803: Europeans settle in Tasmania.-Ecology by Singer.
5700 BCE: Crater Lake in OR is formed following the massive eruption of Mt. Mazama. The lake has a max depth of ~600m.-Ecology by Singer.
50-35 Ma: Australia and Antarctica break apart.-Ecology by Singer.
55 Ma: The Paleocene–Eocene Thermal Maximum (PETM); mean surface temperatures increase by about 5°C over a time period of 1000–10,000 years. The most plausible explanation is that there was a sudden release of C that had a low concentration of 13C (probably in the form of CO2 or CH4 or both) into the atmosphere that caused this universal decline.-Ecology by Singer.
110 Ma: Diversity in Angiosperms (flowering plants) explodes.-Ecology by Singer.
125 Ma: The first known marsupials evolve in China.-Ecology by Singer.
600 Ma: Earth’s atmospheric O levels are close to present values (~21% Atmospheric O).-Ecology by Singer.
___________________________________________________________________