Best Things First by Lomborg
Ref: Bjorn Lomborg (2023). Best Things First. Copenhagen Consensus Center.
www.copenhagenconsensus.com/bestthingsfirst
___________________________________________________________________________
Summary
The point of this book is simple. We all want a better world. Unfortunately, our efforts are often hampered by wanting to achieve not just some but all good things at once, many of which are near-impossible, prohibitively expensive, or terribly inefficient, or all these things at once. So, this book outlines how to do the best things first.
Saying no is uncomfortable, so often, the human response- especially from politicians- is to pretend to say yes to everything…Disappointingly, our public policy conversation rarely talks about which policies will actually deliver the most good per dollar, shilling, or rupee spent.
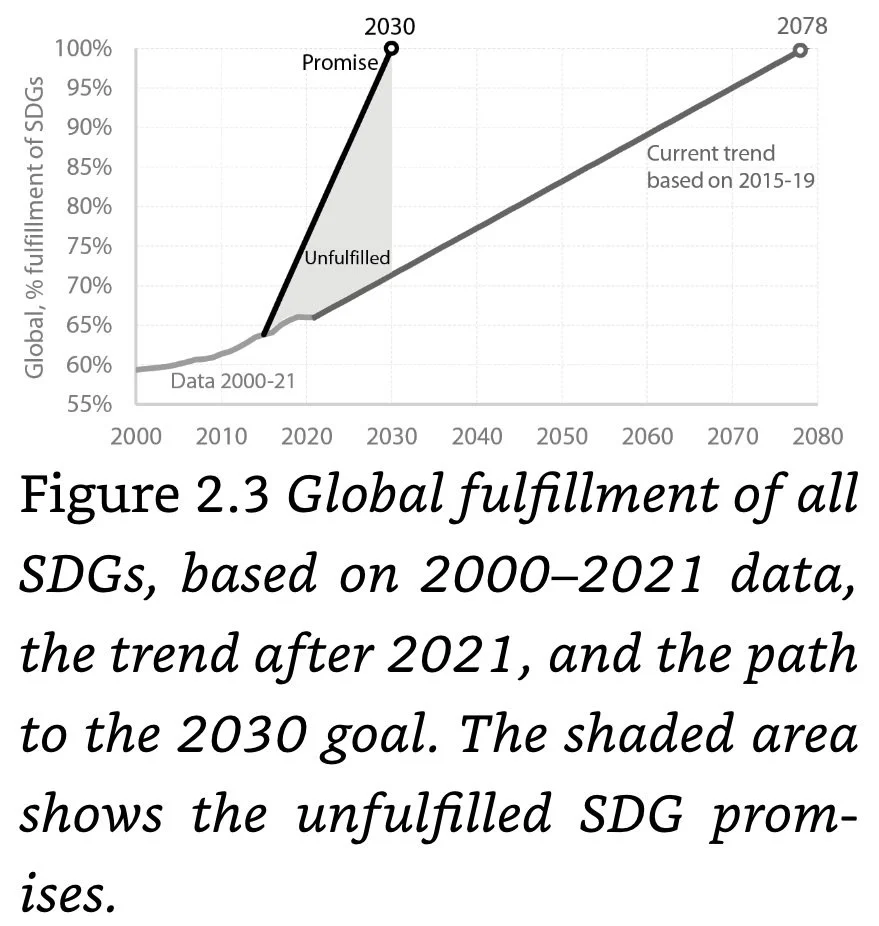
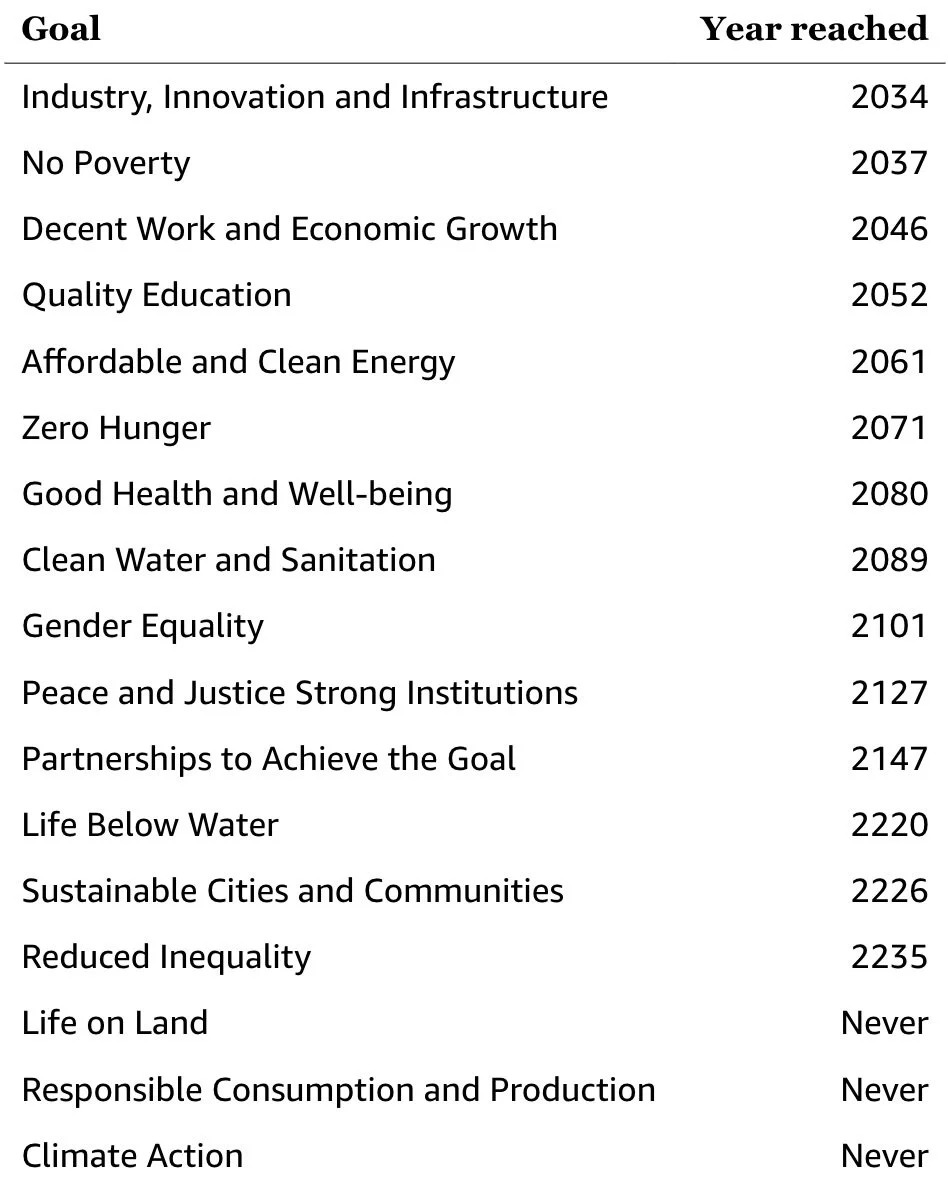
Across the world, most policy conversations continue to pretend that it’s possible to say yes to everything. Nowhere is this more obvious than in the Sustainable Development Goals (SDGs). With 169 sprawling vows and more than 4,000 words, everything has been promised to everyone. The goals go from 2016 to 2030, meaning that in 2023 the world is at halftime, yet nowhere near halfway. We are failing on most of our promises. That’s why we started the project Halftime for the SDGs, the foundation for this book…Building on our previous project for the start of the SDGs, we have investigated more than 100 potentially great policies to find the very best solutions.
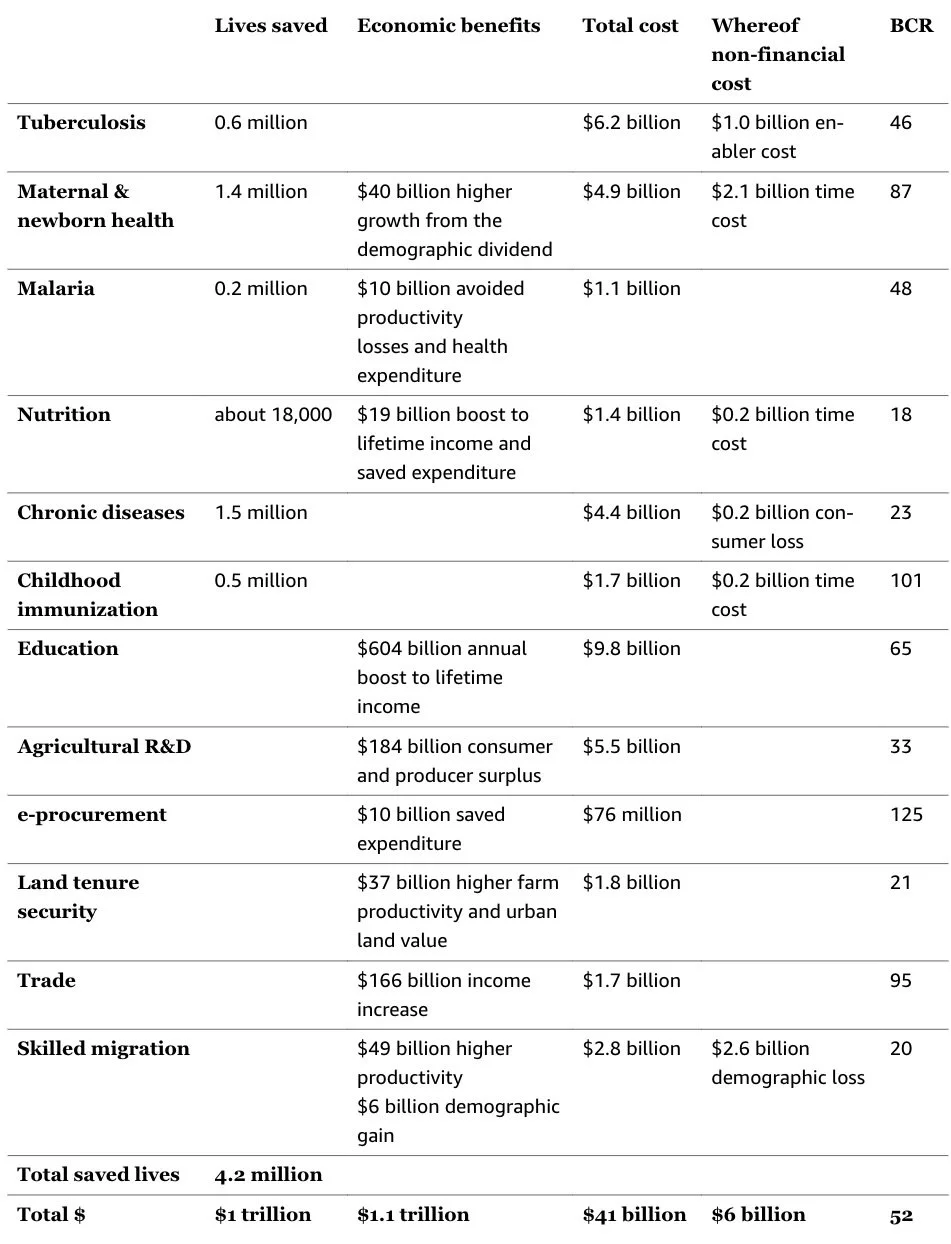
The papers use benefit-cost analysis to identify the “best” or most efficient policies. This approach identifies all the benefits and all the costs in dollars (or rupees or any other currency). These are not just financial costs and benefits like the cost of a vial of vaccine or the salary benefit of increased productivity. There are also non-financial costs like lost time for a mom having to take a morning off to take her baby to get vaccinated or the non-financial benefit of not being sick with malaria or not dying from heart disease. Specialist researchers tally all the benefits and costs and divide the two numbers; the result then reveals how much total benefits society gets for each dollar or rupee spent. The result is the benefit-cost ratio or the BCR.
I’m here asking the more limited and much more relevant question: If we are going to spend a few tens of billions more dollars, where could these additional funds help the most?
___________________________________________________________________________
---Section I: The overarching argument
___________________________________________________________________________
Ch 1: Doing the Best Things First
___________________________________________________________________________
Ch 2: Promises, promises
The Millennium Development Goals (MDGs) were created by UN Secretary-General Kofi Annan and a close circle of aides with little public deliberation or government participation. Annan and his staff worked behind closed doors with technocrats at the IMF, the OECD, and the World Bank. The resulting plan was short and powerful: Eight goals and 18 specific targets…They set out targets that almost everyone in the world would agree are priorities: To reduce poverty and hunger, fight disease, provide access to clean water, and get every boy and every girl in school. All were subject to a hard deadline: December 31, 2015. When 100 heads of state and 47 heads of government- then the largest meeting of world leaders in history- gathered in New York for the UN Millennium Summit, they agreed to this simple list of ambitious promises.
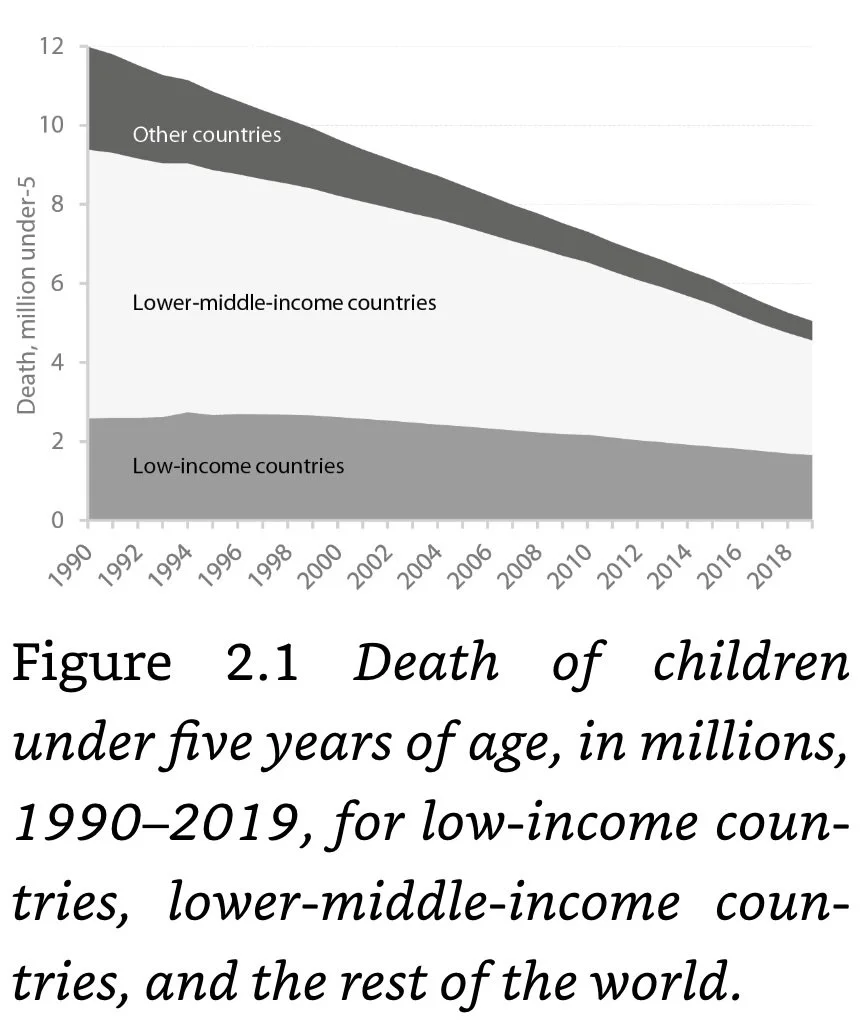
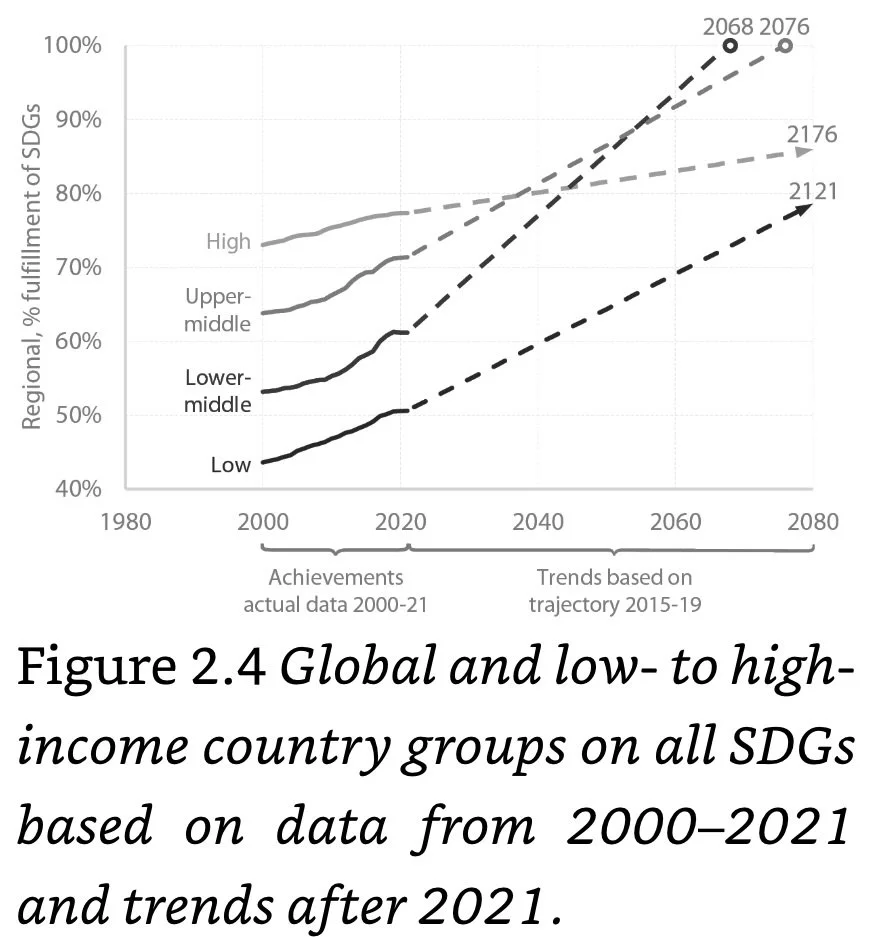
Low-income countries are the world’s poorest, where each person, on average, makes less than $1,085 a year (~$3/day). In lower-middle-income countries, people earn up ~$12 a day. To put all these figures into context, the average daily income in China is $33, and across high-income countries (the rich world), it is $132.
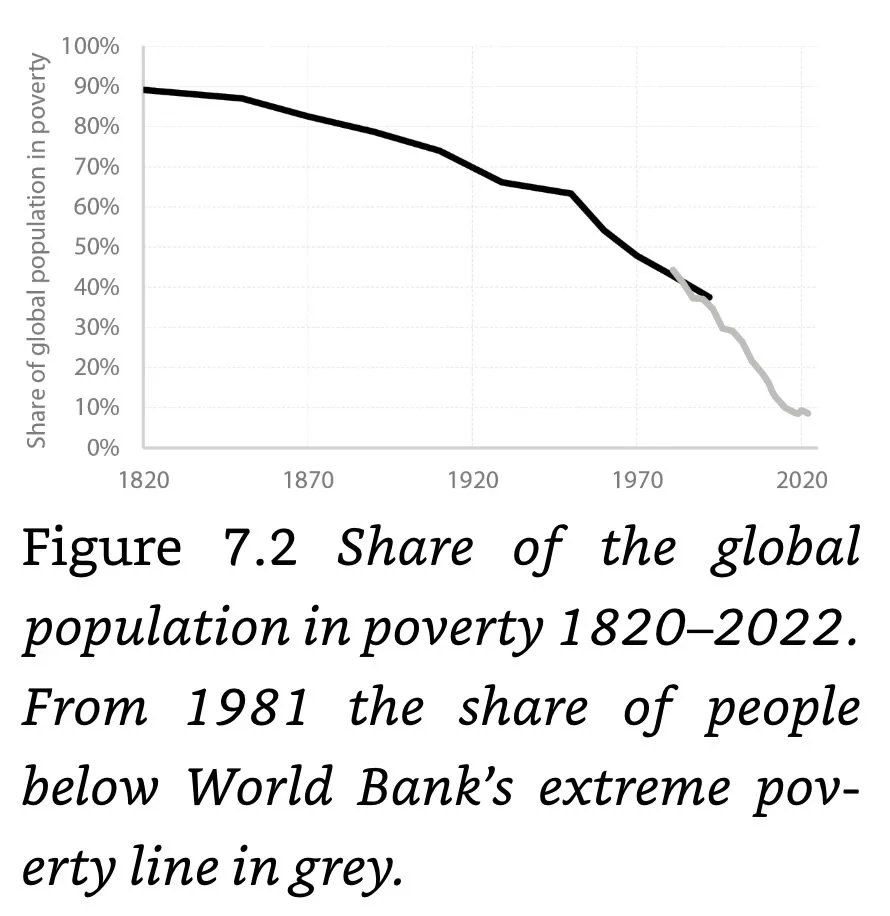
Extreme Poverty: People living on < $2.15/day. In 1990, 1.9 billion people — a third of the world — lived in grueling extreme poverty. By 2015, this number had more than halved to 836 million. Today, it has been reduced further to 674 million. Over the past 32 years, poverty has declined by 113,000 people every day.
Recently, the UN adopted the Sustainable Development Goals (SDGs). Running from 2016 to 2030, the SDGs have 169 targets, spread out across 17 goals or themes, far beyond the MDGs’ 18 targets and eight goals…Many of the SDGs revolve around issues that are particularly important to well-meaning and well-off people who live relatively comfortable lives in wealthy communities around the world, a long way from imminent hunger or death from infectious diseases…Almost all SDG goals measure an underlying factor of an improving society (people getting richer, better educated, less hungry, healthier, etc.). These factors are interrelated: When health goes up, education tends to improve as well, as do most of the goals. But this is not so for two of the goals: Responsible consumption and climate. The data shows that progress on these two goals tends to be associated with decreases in almost all other goals.
The negotiations for the SDGs ended up being conducted by a large group of UN ambassadors. I met individually with many of them in New York to share our research. I pushed for them to focus their SDG promises on the top policies we’d identified. Every ambassador I met told me that the research was very useful and agreed that, ideally, the world would focus more on the most efficient policies. However, the ambassadors quietly explained to me that their job wasn’t really to find the best policy investments for the world. They were there to highlight their government’s particular policy focus, which was often ideas that played well at home, regardless of how efficient (or not) they were at solving global problems.
It’s not surprising that the SDG targets gets lost among this wide array of complex goals. They read more like a wish list of everything the world would possibly like to see done than a concrete set of goals. While well-intentioned, these targets are staggeringly unrealistic in a world with limited means. They are all the more unrealistic given that the SDGs include similarly expansive and near-impossible promises across every other area of development.
___________________________________________________________________________
Ch 3: Do the smartest solutions first
Delivering drinking water returns only about $4 in benefits for each dollar spent, and sanitation only $3. This is because both are quite expensive. Sanitation is particularly resource-heavy, and toilets need to be maintained at a significant daily cost in order to be regularly used. Moreover, you can only have a substantial reduction in disease if fecal contamination is almost completely eliminated.
Climate change is a significant global concern and a real problem, but climate policies deliver far less than $15 on the dollar. One of the most effective solutions- delivering a globally coordinated, efficient C tax — produces about $2 of benefits for each dollar spent. Stricter climate policies, for example, achieving net zero C emissions, struggle to even produce more benefits than costs. One reason for this is how long it takes for the benefits of climate policies to materialize. All the costs are upfront, whereas the returns only arrive slowly and incrementally over centuries. According to one study, the benefits of climate policies will only surpass their costs after 2080. Another suggests this date will first occur sometime in the next century.
The 12 best policies our experts have identified cover a wide range of areas: TB, education, maternal and newborn health, agricultural research and development, malaria, e-procurement, nutrition, land tenure security, chronic diseases, trade, child immunization, and skilled migration…Over this decade, the top 12 solutions will cost $35B annually and incur an additional $6B in non-financial costs. The benefits are $1.1T in economic benefits along with 4.2M avoided deaths, worth an additional $1T. In total, the benefit will amount to $2.1T per year.
Private philanthropy in the USA is $485B annually, though most go to religion, education, and health inside the USA.

___________________________________________________________________________
---Section II: The 12 most efficient policies
___________________________________________________________________________
Ch 4: Tuberculosis
Ref: Pretorius et al (2023).One million lives saved per year: A cost-benefit analysis of the Global Plan to End TB, 2023-2030 and beyond. Cambridge University Press. Journal of Benefit-Cost Analysis, Vol. 13, S1, 2023.
Policy: Invest ~$6.2B annually ($65B by 2050) to increase TB screening and use TB rapid gene testing (as opposed to sputum microscopy- which fails to detect ~40% of cases including MDRTB) to find most of the missing 4M TB cases annually. Additionally, address the difficult of taking TB treatment prescriptions.
Outcome: Additional spending will ensure that 50M more people will access appropriate treatment over the period 2023-30, including 4.7M children and 3.3M people with MDRTB, and will save ~1M lives per year over the next decades. In addition, 35M people will access preventive treatment. Overall, this would achieve the 90% death reduction promised in the SDGs by 2030. The intervention will prevent some 27M deaths over that period, generating benefits worth $2.6T. Each dollar spent will create a phenomenal $46 of social benefits.
Background
Tuberculosis (TB): A disease caused by the bacterium Mycobacterium TB that spreads through coughing. TB usually attacks the lungs, but it can affect the kidneys, spine, and brain- any part of the body. Today, TB kills ~1.4M per year.
One study found that the number of TB deaths was significantly larger than smallpox, malaria, the plague, influenza, cholera, and AIDS combined. In total, TB killed 1B people over the past two centuries.
From the 1850s, TB declined in the rich world. This was due to better living standards, better nutrition, rudimentary public health measures, and isolation practices after the long-delayed realization that TB is infectious.
The BCG vaccine (developed in 1921) has been administered >3B times, making it the most-used vaccine ever. The vaccine offers some protection for young children, reducing infections by about 40%. Unfortunately, it is ineffective for adolescents and adults.
Why haven’t we tackled TB yet? For more than half a century, we have known how to cure TB. Yet, it persists and even today kills a record number of people in the poorer part of the world. Why is this so hard? To simplify, there are two main challenges to fixing TB. First, it’s difficult to get diagnosed people to complete their treatment. Part of this is simply that you must take medicine every day for 4-6 months for it to work properly. That is a big ask. Many people have trouble taking pills consistently for a week or two. Doing so conscientiously for many months is arduous. Another challenge is that people will drop out because the treatment can be fantastically costly. Despite healthcare mostly being free, a treatment course typically entails many additional costs.
Curing one person prevents, on average, 5–15 new TB infections each year.
___________________________________________________________________________
Ch 5: Education
Ref: Angrist et al (2023). Improving learning in low-and lower-middle income countries. Cambridge University Press. Journal of Benefit-Cost Analysis, Vol. 13, S1, 2023.
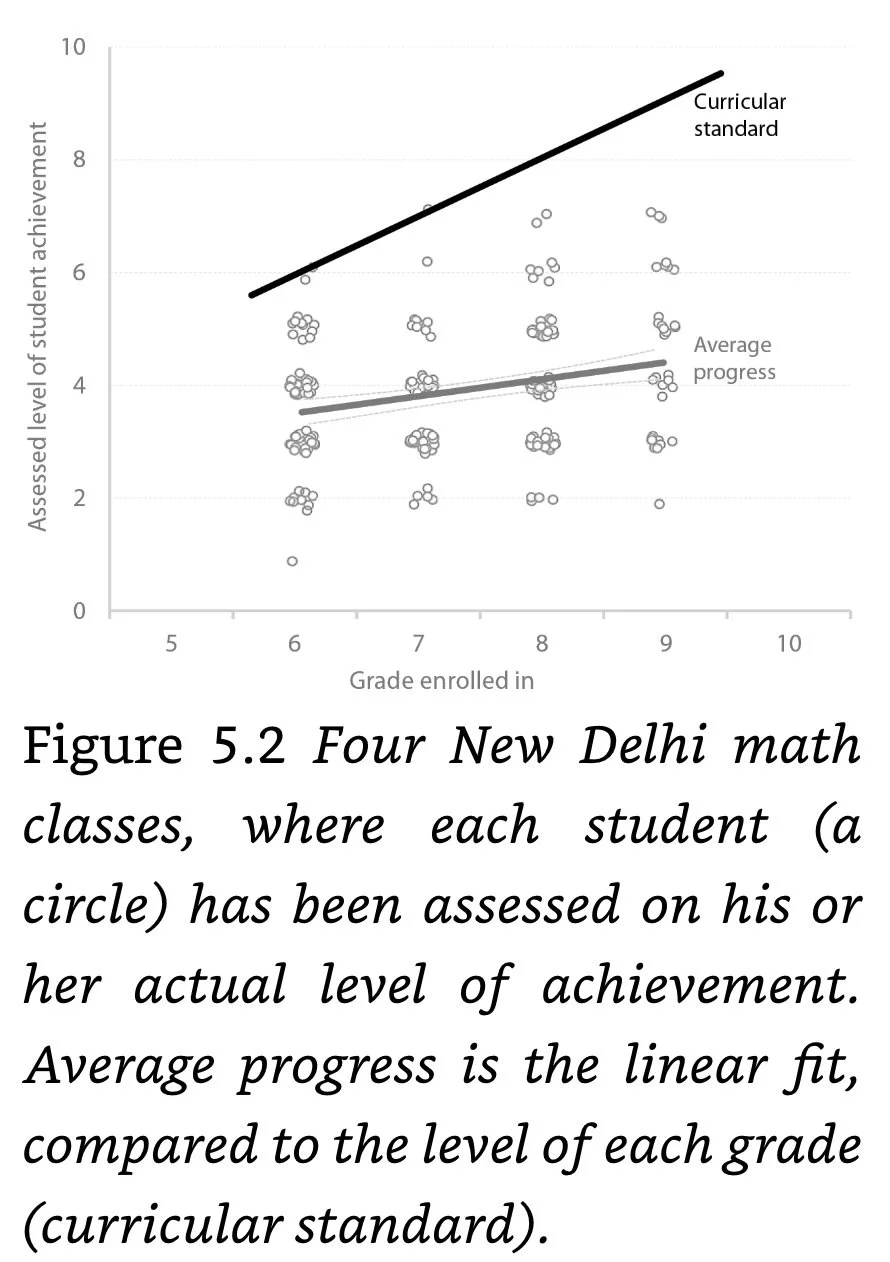
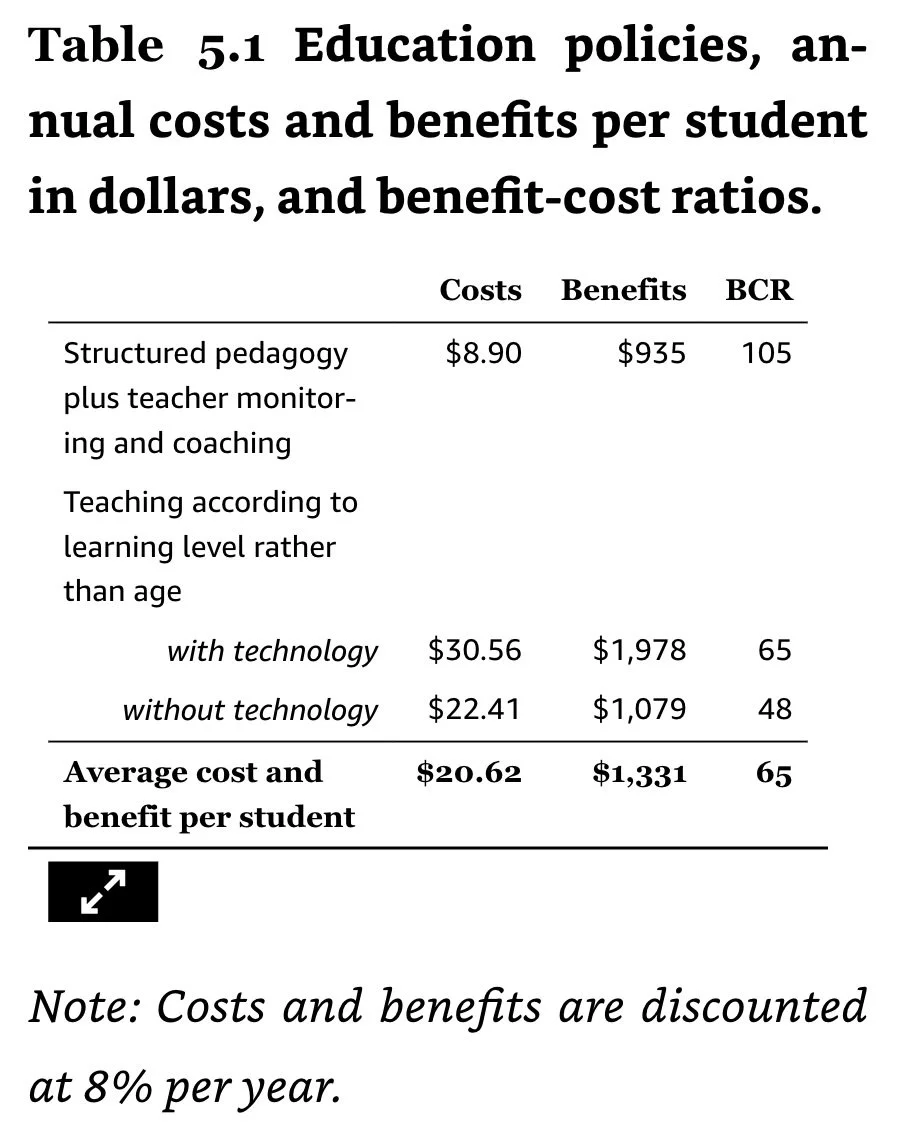
Policy: Increase educational spending to 1) help students learn more effectively by teaching to their level rather than age by shuffling classes for 1 hr each day so all students go to the class that is at their actual level, and 2) help teachers teach better, through online technology- for 1 hr/day, the students sit down, each with their tablet. The tablet contains software in the native language, and it can quickly assess the level of the student and start teaching right at that level. Since the software will be used by millions, it can be made to administer a best-practice education that delivers very efficient and engaging instruction. Several such software packages exist, and they are easy and cheap to translate into other languages.
Structured Pedagogy: Helps teachers to teach better by providing them with a set of semi-scripted lesson plans, training in how to use them, and coaching them as they are used…Implementing structured pedagogy is very affordable, and it delivers learning that is equivalent to almost one extra year of schooling.
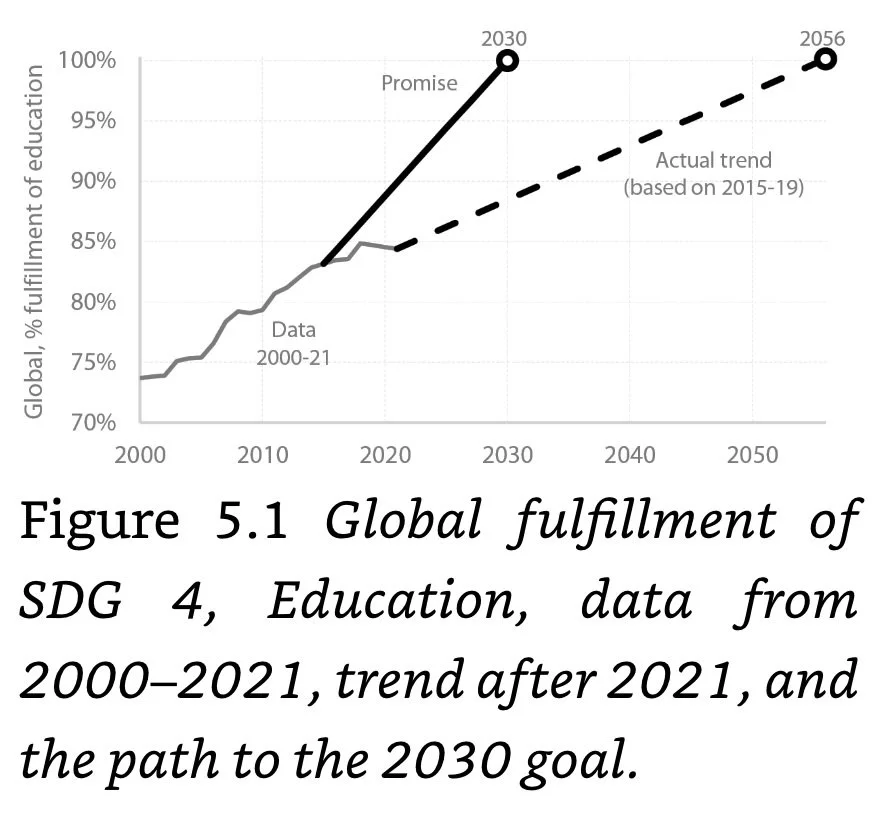
Benefits: Teaching students at their own level (1 hr per day) for 1 yr delivers a learning equivalent of 2 yrs of normal schooling. Using technology to enhance learning (1 hr per day) for 1 yr delivers a learning equivalent of 3 yrs of schooling.
Background
Education is possibly the single most important factor in determining whether a nation is rich or poor.
In sub-Saharan Africa, primary school enrollment expanded from 52% in 1990 to 80% in 2015. The gender gap in enrollment was almost eradicated in many parts of the world and reduced in Africa and southern Asia.
A substantial portion of students in poor and rich nations alike don’t achieve a basic competency in math or reading (the Minimum Proficiency Level- MPL)…Achieving a MPL for lower-primary students, for instance, involves reading the sentence, “Vijay has a red hat, a blue coat, and yellow socks.” and being able to correctly answer the question: “What color is the hat?” Similarly, a basic level of math involves understanding that if two people equally share six pieces of cheese, each person gets three pieces of cheese. Of the 467M primary school pupils in the poorer half of the world, 364M cannot pass even these simple tests.
A common underlying assumption in education policy has been that more spending is the key. If we just pay for more teachers, pay each teacher more, and buy bigger and better classrooms, learning will improve. Yet, the evidence shows otherwise. Spending has certainly increased. From 1990 to 2015, total government spending on education almost tripled from $63B to $173B. Part of this is due to the almost 50% increase in the number of children brought into school, from 324M to 467M, mostly because of higher enrolment. But even when adjusted for more children, government spending almost doubled per primary school student in low- and lower-middle-income countries, rising from $196 to $352 per student.
The International Commission on Financing Global Education Opportunity estimates that the extra funding required to meet the SDG targets will mostly be allocated to inefficient, business-as-usual approaches that are unlikely to generate much extra learning- including raising teacher salaries, lowering student-teacher ratios, and expanding inputs. Specifically, it suggests the world would need to spend an extra $146 per child in low-income countries and $310 in lower-middle-income countries by 2030 to reach the SDG goal. This adds up to about a $100B annual increase with little or no likely learning benefits.
In 2009, India passed landmark legislation promising free education for all children while increasing teacher numbers and setting up infrastructure requirements for schools, such as libraries and gender-specific toilets so that female students had safe and private bathroom facilities. The best estimate shows that reading and math test scores “declined sharply” after 2009…In 2001, the Indonesian government devoted 10% of its budget to schooling, and 4 yrs later, the Indonesian parliament amended the nation’s constitution to require that 20% of the budget be spent on education…It had absolutely no impact on student learning outcomes.
One of the most highly visible global education campaigns in recent times was “One Laptop per Child,” which generated vast attention with charismatic proponents, political buy-in, and satisfying narratives of poor children being provided with their very own computers. When the policy was finally evaluated with the gold standard of a randomized controlled trial, it revealed “no impacts on academic achievement or cognitive skills.” Teachers even reported that pupils who received laptops were less likely to make an effort at school- a finding that has since been supported by larger studies.
___________________________________________________________________________
Ch 6: Maternal and newborn health
Ref: Madise et al (2023). Achieving maternal and neonatal mortality development goals effectively: A cost-benefit analysis. Cambridge University Press. Journal of Benefit-Cost Analysis, Vol. 13, S1, 2023.
Policy: Invest ~$3.7B annually to reduce maternal and newborn deaths, through various policies, including 1) increasing coverage of basic emergency obstetric and newborn care to 90%; 2) increasing unmet needs for family planning to 90%; 3) getting more pregnant women in for pregnancy check-ups, 4) prescribing more Fe supplements, 5) having more and better birth facilities or more health worker visits to counsel the mother and child after birth.
Benefits: ~161K mothers lives saved each year and 1.2M infants saved each year. Having fewer children lowers the amount of time women spend on child rearing, freeing time to participate in the labor market. In total, the reduction in fertility is estimated to yield a demographic dividend benefit equivalent to $28B annually.
Background
This year, ~300K women will die from pregnancy-related complications, while 2.3M newborn babies will die within the first month of their lives…Many of these women and children do not die because of some complex issue but because of a basic lack of skilled birth attendants and emergency care.
Basic Emergency Obstetric and Newborn Care (BEmONC): A package of staff, knowledge, and resources offered at healthcare facilities that make it possible to treat some of the most typical complications around birth. It requires women to give birth in a health facility, and this by itself has substantial costs for healthcare providers and time costs for the women. But beyond that, the facility also has to offer a whole list of basic BEmONC services, as defined by the WHO: Clean birth environment Immediate drying and additional stimulation Thermal protection Clean cord care Uterotonics Controlled cord traction/removal of placenta Parenteral administration of anti-convulsants Antibiotics for preterm or prolonged premature rupture of membranes Parenteral administration of antibiotics Assisted vaginal delivery Neonatal resuscitation Removal of retained products of conception Induction of labor for pregnancies lasting 41+ weeks Antenatal corticosteroids for preterm labor…Of all the BEmONC services, neonatal resuscitation is the most surprising and simple. Of the world’s 2.3M newborn deaths each year, more than a third are due to birth asphyxia — basically, the baby fails to start or keep breathing. About 5% of all babies need ventilation, even in high-income countries. The low-cost and efficient solution is a resuscitator, a mask with a hand pump that can push air through the infant’s mouth and into its lungs. The cost is just $75. If used 25x a year, the cost per use is $3. Adding health worker time, the total provider cost per child is in the order of $6. This year, 3.5M children in these 55 nations will need resuscitation, but only a third will be at a facility with access to one.


___________________________________________________________________________
Ch 7: Agricultural R&D: More and cheaper food
Ref: Rosegrant et al (2023). Benefit-cost analysis of increased funding for agricultural research and development in the global south. Cambridge University Press. Journal of Benefit-Cost Analysis, Vol. 13, S1, 2023.
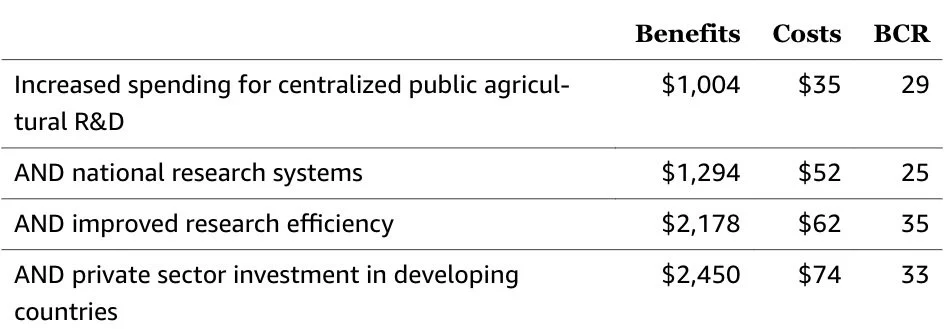
Policy: Invest $74B (over a 35-yr period) to provide funding for agricultural R&D including 1) financing towards internationally aligned research centers on innovation, technical, and policy support to improve food security, poverty, and ecosystem services globally (CGIAR centers); 2) investments by national agricultural research systems which conduct locally relevant research for improving agricultural efficiency; 3) private sector spending to improve food options for consumers in developing countries.
Benefits: The full package, which` includes a 30% increase in private sector investments in developing countries, would cost $74B over the 35-yr period. That is equivalent to an annual increase of $5.5B. But this investment would generate $2.45T in benefits- a $33 return for each dollar invested.
Background
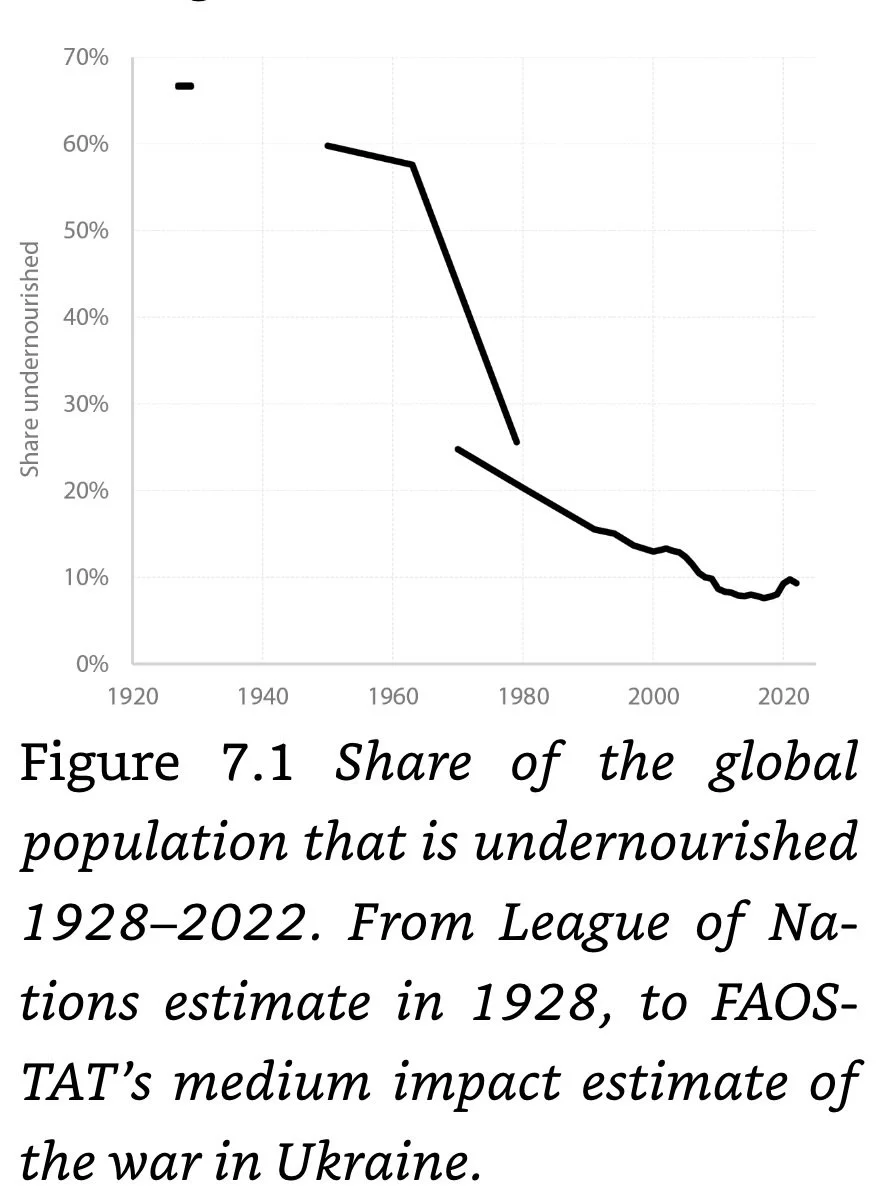
Hunger affects 768M people, killing 2.7M mothers and children and costing the world > $5T annually.
Generally, when a country’s annual GDP per person rises above $10,000, practically no one goes hungry.
In 1820, ~9 in 10 people in the world were extremely poor. In 2022, it was < 1 in 10 with 9.3% malnourished.
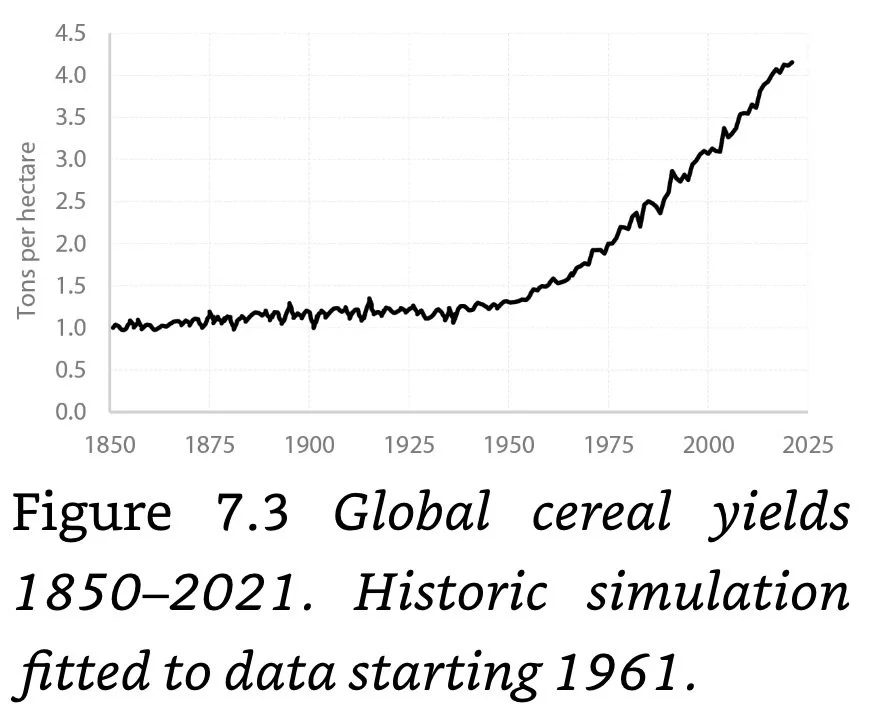
At a research station in England, the best agricultural yields were quite constant for more than a century from 1852 but then doubled after 1960 and, with even better treatment, almost quadrupled today.
Most of the world’s farmers produce far below the best attainable yields. More irrigation and fertilizer can help. The global area under irrigation has doubled since 1961. After the chemists Haber and Bosh invented the process to extract NH3 from the air in the early 1900s, the world has increased its N fertilizer use 100-fold.
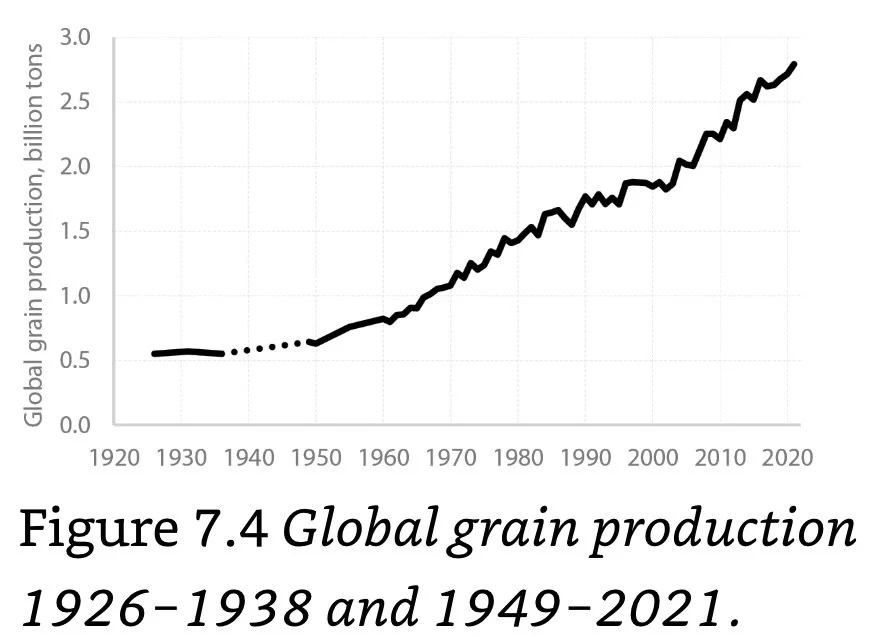
From 1900 to 2000, there was a six-fold increase in total crop harvests. Over that same period, the global population increased less than four-fold; on average, each person has around 50% more food available.
Since 1961, global cereal production has increased by 249%, while we have only increased the total cereal land area by less than 12%.
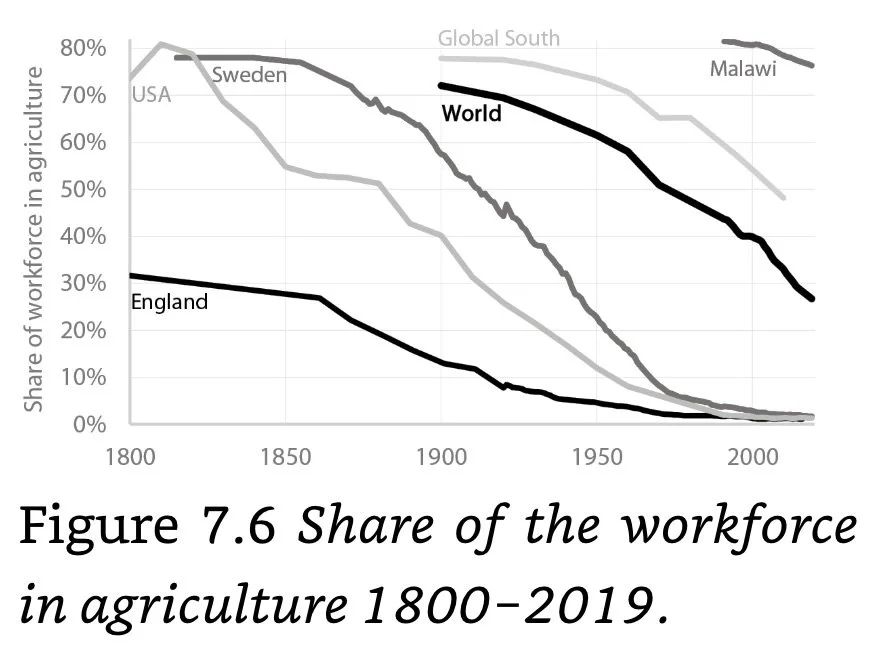
In 1900, ~75% of the world’s labor force worked in farming. Today, it’s <25% of the world’s workforce.
Many farmers across the world are so poor that they cannot survive if just one harvest of a single crop goes badly. This leads them to plant ‘safe’ crops, which consistently produce some food but- on average- far less than better but more temperamental crops…Some conclude the government should fund insurance for these poorer farmers…Our research in Haiti and several states in India found that while this sort of intervention does help, the impact is rather small, and the cost is fairly high. Each dollar delivered less than $2 of social benefits…Our research for Haiti found that fertilizer subsidies generate only about a $3 benefit per dollar…Extension services- extending practical, agricultural knowledge to farmers- created only $3.50 of benefits for every dollar invested, our research on Bangladesh concluded. Other widespread policies do literally waste money, such as waiving farmers’ loans- loan waiver scheme produce benefits below its costs, delivering just 95¢ of value to society for each dollar spent. And though these policies are cast as an aid to the poorest, loan waivers typically help bigger, already better-off farmers the most. In fact, previous waiver schemes have led banks to reduce credit for small farmers, thereby diminishing their chances of obtaining future formal loans. Small farmers are then forced to turn to informal loans, the rates for which are often far more expensive.
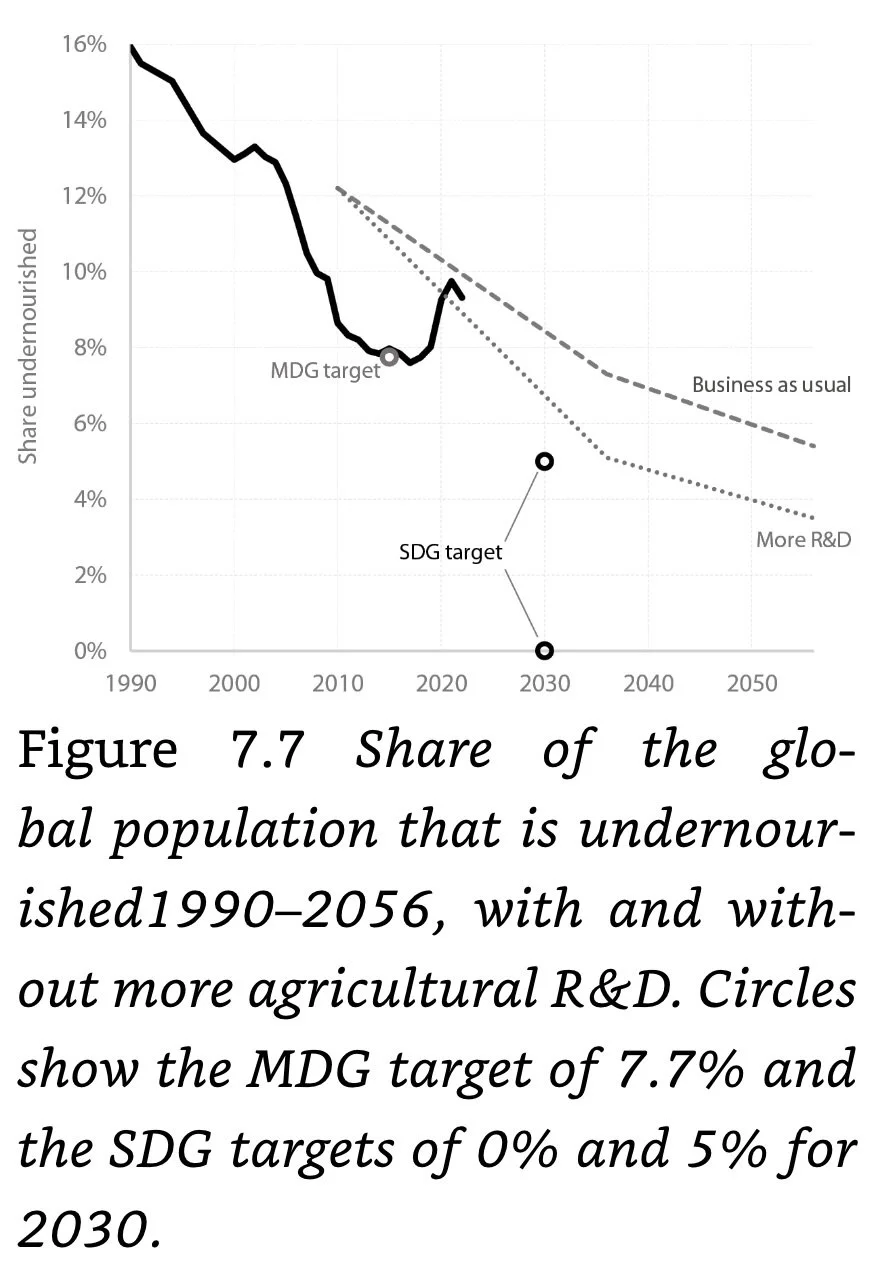
The issue isn’t that poor countries can’t grow much more food but that they don’t have sufficient investment in the technology to do it…Investing in agricultural R&D can result in more food being produced more efficiently, pushing down prices while reducing the number of malnourished.


___________________________________________________________________________
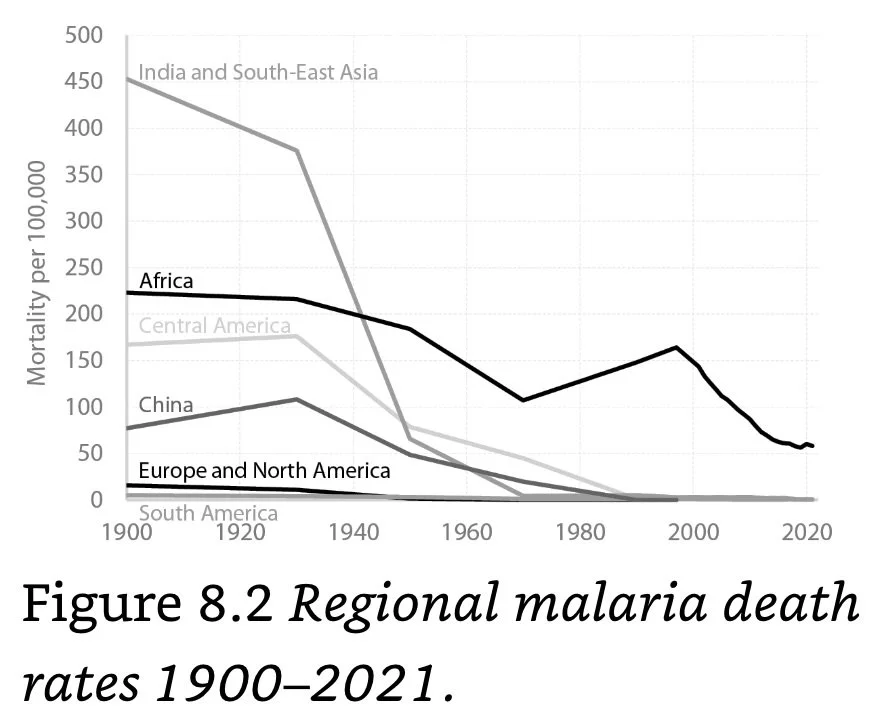
Ch 8: Malaria
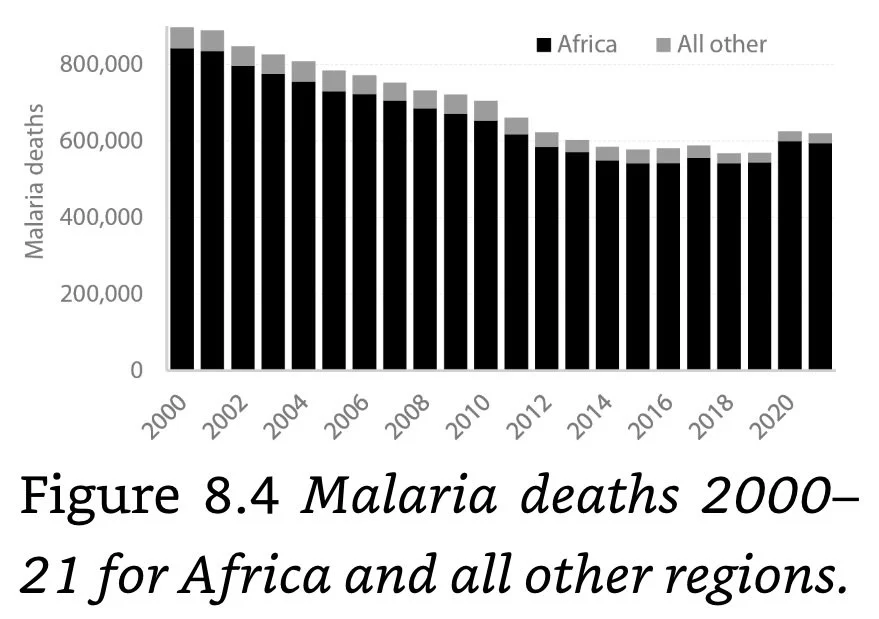
Ref: Shretta and Ngwafor (2023). Benefits and Costs of Scaling up Coverage and Use of Insecticide Treated Nets. Cambridge University Press. Journal of Benefit-Cost Analysis, Vol. 13, S1, 2023.
Policy: Invest ~$1.1B annually for malaria spraying and the purchase of Long-lasting insecticide-treated nets (LLINs) with a new pesticide (Chlorfenapyr), to which mosquitos have low resistance.
Costs: ~$4.5 per LLIN (3-yr life) + $.1 per bed net for education and encouraging proper use.
Outcomes: ~200,000 deaths avoided with a BCR of $48 per dollar spent.
Background
In 1920, almost 2% of the American population had malaria each year,
Malaria medicine had already been discovered back in the 1600s when the Spanish brought powder made from the cinchona tree back from the New World…The cinchona tree’s slow growth and the difficulty of growing it elsewhere led the Spanish to have a virtual monopoly on quinine for almost 300 yrs. They kept supplies low and prices high, meaning most people couldn’t benefit. This changed when cinchona was successfully grown in Java; it grew so well that by the early 1900s, it supplied nearly all of the global consumption.
Almost 220 million LLINs were delivered to sub-Saharan Africa in 2021.

___________________________________________________________________________
Ch 9: e-procurement: Reducing Corruption
Ref: Bosio et al (2023). The investment case for e-government procurement: A cost-benefit analysis. Cambridge University Press. Journal of Benefit-Cost Analysis, Vol. 13, S1, 2023.:
Policy: Make procurement visible and transparent by moving the whole process online, known as e-procurement. Four major areas of the procurement process that should be digitized to lower corruption substantially: notification, access, attestation, and submission.
Outcomes: Benefits of >$700M for low-income countries across the first 12 yrs of its e-procurement transition with a BCR of $38 per dollar spent (for low-income countries).
Background
Corruption has an estimated global cost of $1T annually. Procurement is a government’s number one corruption risk: Every phase of a procurement process includes the risk of bribes, kickbacks, and collusion.
The World Bank’s 2020 Enterprise Survey revealed that, across all countries, 23.7% of firms said they are expected to give gifts to secure government contracts.
Corruption of public procurement is particularly damaging because, in almost every nation, the government is by far the largest buyer of works, goods, and services from the private sector. Total public procurement amounted to $15T in 2018, or 14.5% of global GDP. Public procurement is even more important in low- and lower-middle-income countries. Total spending is a similar proportion of these countries’ GDP, but because overall government spending is much smaller, procurement in these countries makes up an astounding half of all public expenditure.
___________________________________________________________________________
Ch 10: Nutrition
Ref: Hoddinott et al (2023). Investing in nutrition- A global best investment case. Cambridge University Press. Journal of Benefit-Cost Analysis, Vol. 13, S1, 2023.:
Policy: Invest ~$4B annually for 1) supplements- vitamins and minerals including Ca, during pregnancy beginning at conception and 2) small quantity lipid based nutrient supplements (SQ-LNS) post-birth.
Costs:
Supplements: $56M for 36M women per year including $1.55 per mother for 180 pills covering the last two trimesters of the pregnancy. The additional training and education costs add another $1.12 per pregnant woman or $40 million for all. Ca pills are needed every day for the last 20 wks at a cost of $6.84 per pregnancy, or $248M in total, delivering $4.6B, a BCR of $19 per dollar spent.
SQ-LNS: ~$3.7B per annual birth cohort of 41M children (~$90 per child over an 18-month duration).
Benefits: Reduction in the risks of stillbirths, of mothers giving birth too early, stunting, pre-eclampsia and eclampsia (rare but serious conditions where high blood pressure results in seizures during pregnancy or during birth) and of having a child with low birth weight. With both supplements and SQ-LNS, BCR rises to $24.
Supplements: Ca supplements can prevent 8,470 maternal deaths each year, valued at $1.8B. In total, this policy will avert ~9K deaths. Studies indicate that of the 7M better-fed kids, 2M will likely avoid stunting and grow up with better-developed brains, learn more in school, and become more productive as adults.
SQ-LNS: Reduced stunting and reduced health risks, including a lower risk of dying. Providing SQ-LNS to 41M children will avoid 155,000 child deaths at a total benefit of $45.7B and avoid stunting for 1.5M kids.
Background
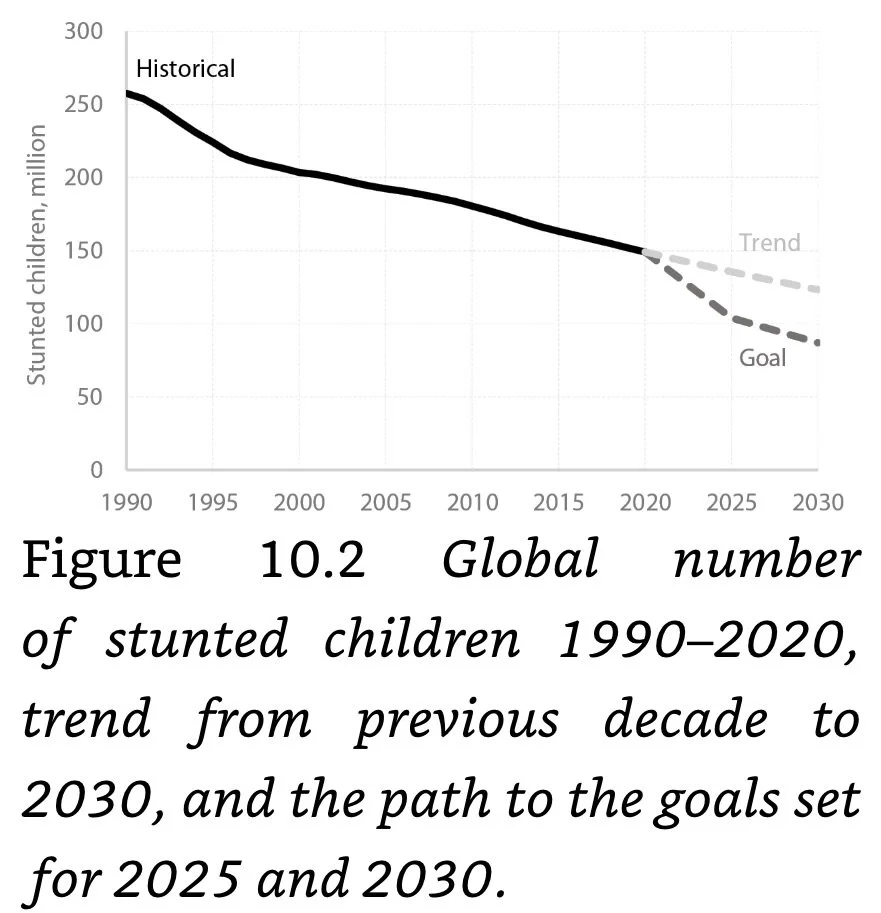
The greatest nutritional challenge is long-term undernutrition in children. The most important impact happens within a child’s first 1,000 days (conception to 2 yo). This is the critical window during which a sustained lack of nutrition has the greatest negative impact on the child’s future physical and mental health.
Stunting: A measure of undernutrition; manifests as shorter, underweight children, more likely to die from illness and infection (particularly pneumonia and diarrhea). Stunted children also suffer from impaired behavioral development in early life. The lack of nutrition hampers brain cell growth, rather than the extensively branched neurons of better-fed children, stunted children’s neurons will be shorter and show less branching. Stunted children are less likely to enroll in school and are more likely to enroll late. They tend to achieve lower grades and, generally, score lower on tests of cognitive ability. Because they learn less in school, they are less economically productive as adults and have lower lifetime incomes.
Around 6 months, an infant’s need for energy and nutrients starts to exceed what a mother’s breast milk can provide. At that point, parents need to begin giving the child additional food. This is referred to as the complementary feeding transition.
SQ-LNS comes as a paste or spread that is individually packaged in robust sachets that are packed in sturdy cartons that can be distributed to parents. The paste makes them shelf-stable and easy to eat. Children can easily consume one small packet each day containing 20–50 grams and perhaps 110–270 kcals. This packet contains essential fatty acids and proteins targeted toward preventing malnutrition in vulnerable children. They are typically made from vegetable oil, peanut paste, milk powder, and sugar, with added vitamins and minerals, thus providing many of the micronutrients and fatty acids that are necessary for physical and brain development.


___________________________________________________________________________
Ch 11: Chronic Diseases
Ref: Watkins, Ahmed, Pickersgill (2023). Best investments in chronic, noncommunicable disease prevention and control in low- and lower-middle-income countries. Cambridge University Press. Journal of Benefit-Cost Analysis, Vol. 13, S1, 2023.
Policy: Invest ~$4.4B towards specific solutions for NCDs including 1) aspirin for people on the verge of a heart attack ($.04/pill), saving ~2900 lives per year; 2) water pills (‘diuretics’) to help the kidneys get rid of unneeded water and salt along with other cheap pills like beta-blockers, saving ~350,000 per year; 3) regulate peoples consumption through sales tax of things that heighten the risk of developing a fatal chronic disease, particularly tobacco, alcohol, and salt; 4) provide community screenings for NCDs- screening for high blood pressure costs ~$1 per person and blood pressure medications costs only $3-11 per person per year.
Costs: ~$4.4B with each dollar delivering ~$76 of social benefits (mostly from averting deaths).
Benefits: ~1.5M lives saved across the policy including ~.5M from high blood pressure control, >194,000 from a tobacco tax, ~19K from alcohol
Background
Premature Death: The death of a person between ages 30-60, from a chronic disease.
In the mid-1800s, the infectious disease burden was immense. Every year, almost 1% of the population (1,000 out of 100,000 people) died from infectious diseases, including smallpox, measles, scarlet fever, diphtheria, typhoid, dysentery, and especially consumption, or as we would know it today, TB…The average American life expectancy (using Mass up to 1900) in 1850 was just over 39 years, reaching 47 years by 1900. Today, the average American is expected to live to 76.1.
In 1918, when the Spanish Flu hit hardest, the average life expectancy fell almost 12 years from 51 years to 39 years but jumped back to 55 years in 1919.
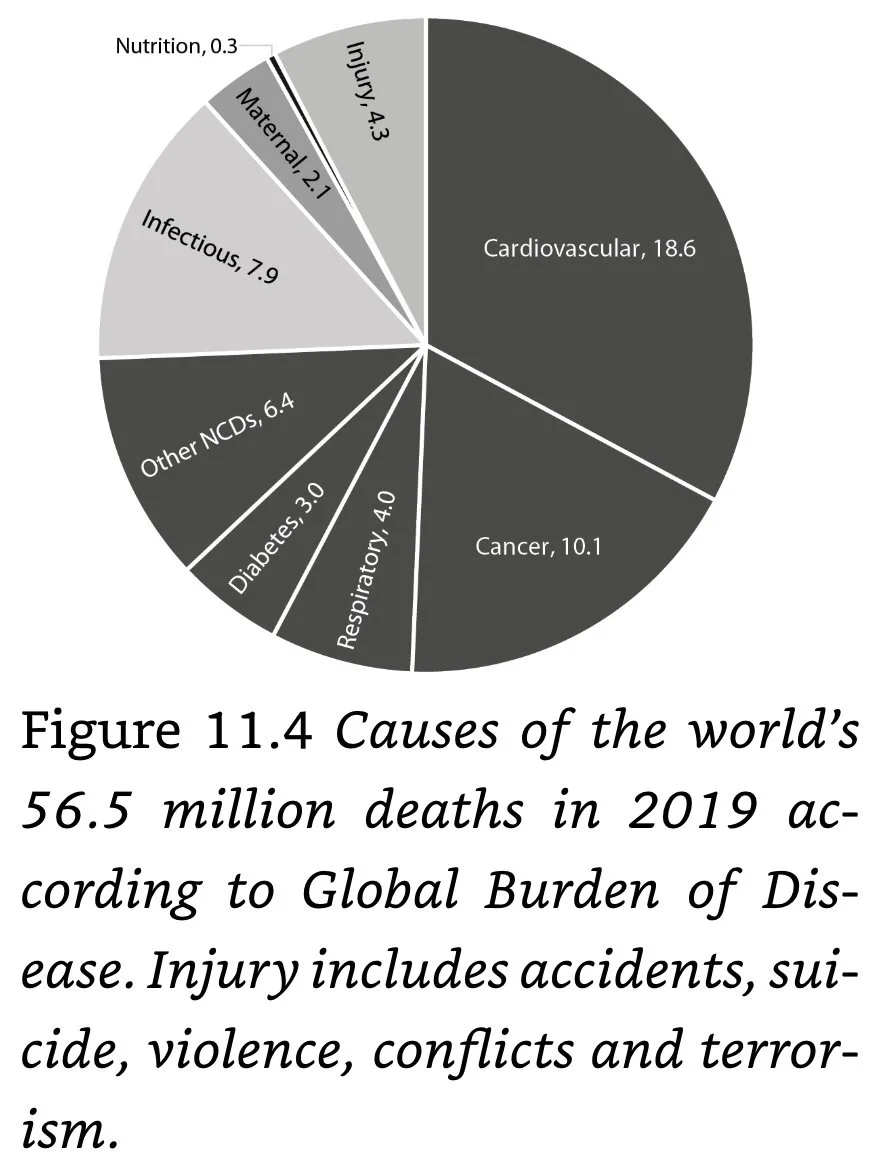
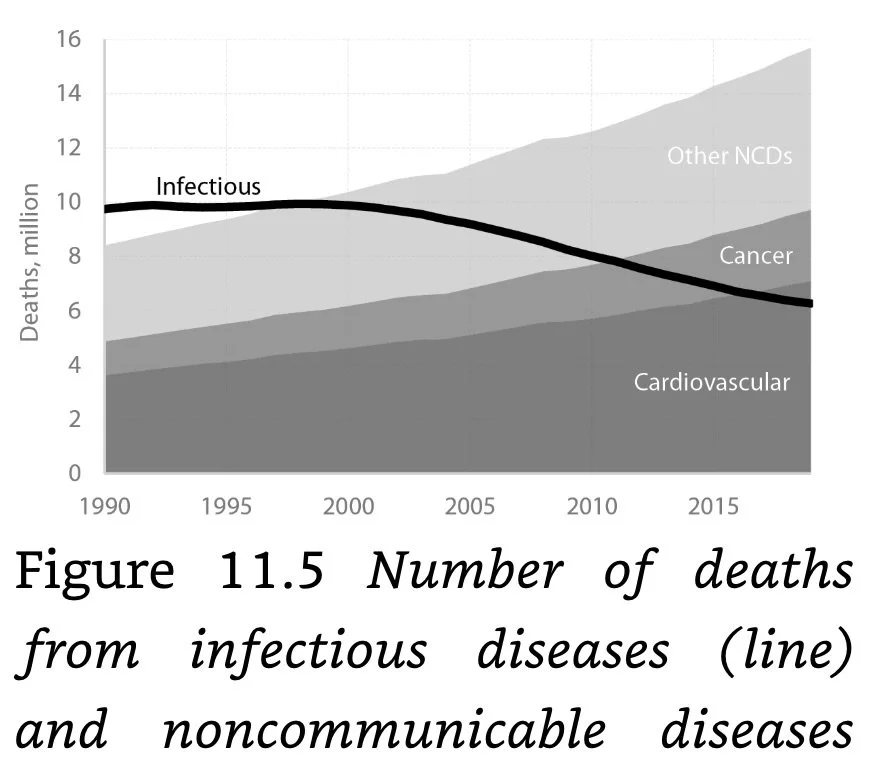
Chronic diseases killed 42M people worldwide in 2019, accounting for three-quarters of all deaths.
Three decades ago, the total number of infectious disease deaths was larger than all chronic disease deaths. However, this changed after 1997, as infectious disease deaths declined and chronic disease deaths increased. Indeed, after 2011, cancer and cardiovascular disease alone killed more people than infectious diseases. After 2016, infectious disease deaths were outweighed by cardiovascular deaths alone.
Smoking causes a variety of other health problems, including other cancers, heart diseases, strokes, lung diseases, diabetes, and chronic obstructive pulmonary diseases, along with increased risk for TB and rheumatoid arthritis. In total, tobacco causes about 550,000 deaths in the USA each year. Worldwide, it kills 8.7M people annually, mostly claiming the lives of smokers but also 1.3M people who simply inhaled the smoke secondhand. In low-income countries, tobacco kills half a million people, and in lower-middle-income countries, it causes 2.6M annual deaths.
Alcohol consumption takes the lives of ~3M people each year, and three-quarters of those killed are men. In low-income countries, alcohol kills 300K people annually, and in lower-middle-income countries, it kills 1.6M.
Excessive salt intake leads to high BP, heart disease, and stroke, and likely causes ~2M deaths each year. According to the WHO, we should consume < than 1 tsp of salt each day (5 g).


___________________________________________________________________________
Ch 12: Childhood immunization
Ref: Patenaude, Sriudumporn, Mak (2023). Benefit-cost analysis using methods from the Decade of Vaccine Economics (DOVE). Cambridge University Press’ Journal of Benefit-Cost Analysis, vol. 13, S1, 2023.
Policy: Invest ~$1.66B annually in vaccines focused on DTP3 and other less common diseases including HPV, PCV, and Rotavirus.
Costs: ~$1.66B more per year but returning benefits worth $167B (101x the cost).
Benefits: ~500K lives per year saved (mainly children) from highly infectious and deadly diseases. From 2023-2030, an additional vaccine investment can avoid ~4.1M deaths.
Background
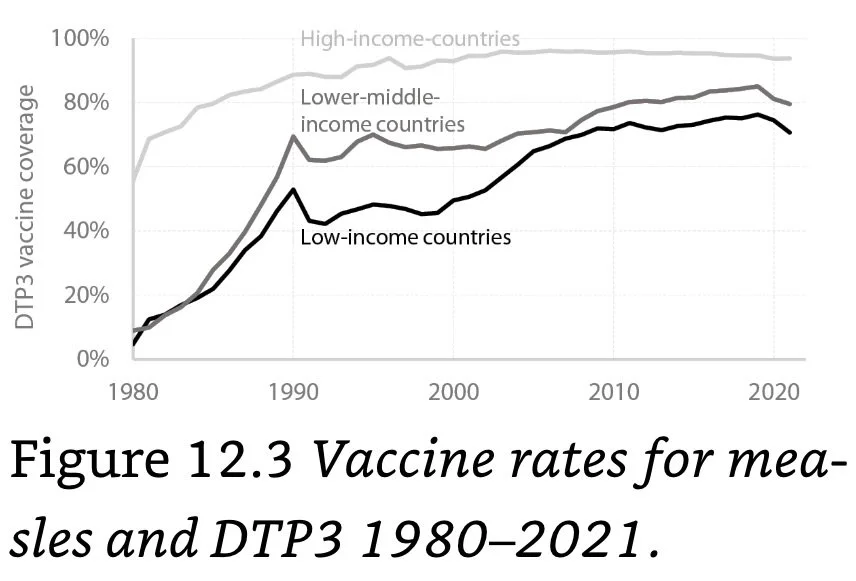
Disruptions from the coronavirus and lockdowns retarded vaccination trends in 2020 and 2021 and diverted health funds away from immunization coverage, creating ‘the perfect storm’ for outbreaks of measles and other diseases.
In 1990, when we had the first relatively accurate global estimates, the world saw ~800K annual measles deaths- today, that has been reduced 10-fold to 83,000.
Currently, vaccinations are already saving nearly 4M lives each year.
DTP3 Vaccine: Covers diphtheria, tetanus, and pertussis.
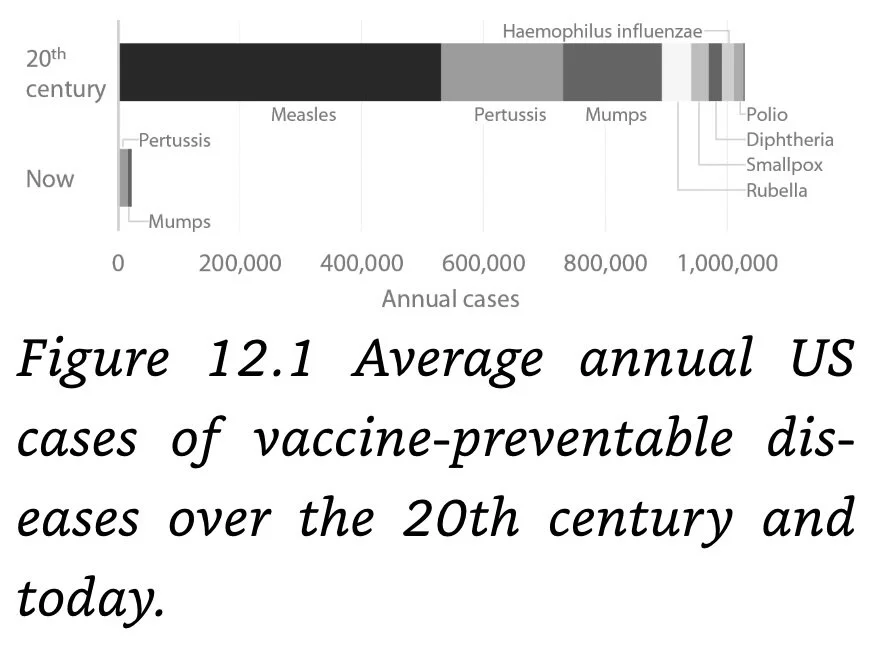
Diphtheria: A disease which causes difficulty breathing, heart failure, paralysis, and death. It was once a major cause of illness and death in children, claiming > 15,000 lives in the USA in 1921. Now, it is unheard of in wealthy countries but remains devastating in less-well-off ones.
Tetanus: A disease which causes the painful stiffening of muscles and can lead to serious health problems; enters the body through cuts and wounds.
Pertussis (‘whooping cough’): A disease which can cause violent coughing and is extremely dangerous for babies and young children who contract it.
Human Papillomavirus Vaccine (HPV): The most common viral infection of the reproductive tract across the globe and can cause cervical cancer in women, as well as other types of cancer and genital warts in both men and women. Its global coverage in 2020 was just 13%.
Pneumococcal Vaccine (PCV): A disease which can lead to more severe conditions like pneumonia, blood infections, and bacterial meningitis.
Rotaviruses: The most common cause of severe diarrheal disease in young children throughout the world.


___________________________________________________________________________
Ch 13: More trade
Ref: Feyrer, Tyazhelnikov, Castilla, Wong (2023). Benefit-cost analysis of increased trade: An order-of-magnitude estimate of the benefit-cost ratio. Cambridge University Press’ Journal of Benefit-Cost Analysis, vol. 13, S1, 2023.
Policy: Increase trade by reducing tariffs, ideally to zero (so-called “free trade”).
Benefits: Reduction in prices due to increased competition and wide sharing of fixed costs; an increase in innovation as companies seek to provide better products.
Concerns: Wage cuts as employers struggle to keep up with competition; job loss as production moves elsewhere.
Background
In 1919, global exports made up just over 10% of the global GDP or ~$600B (2015 USD). A century later, just before COVID hit, trade had grown 76-fold to $48T, or more than half of global GDP.
As China reduced its tariffs from an average of 32% in 1992 to 2.5% in 2020, the country has seen its trade and GDP soar. Over the same period, the average Chinese income rose seven-fold, and the proportion of the population in extreme poverty declined from 28% to near zero today. India has experienced a similar, and only somewhat less spectacular, trajectory. Tariffs have fallen from a stifling 56% in 1990 to a mere 6% in 2020. In that time, average incomes have risen almost four-fold, and the portion of the population in extreme poverty declined from 22% to 1.8%.
One important study shows that over the past four decades of economic growth, the bottom 20% and the bottom 40% of the income distribution generally rise in the same proportion as the mean economic growth in a country. As the whole economy grows, the poor become better off. Prosperity really is shared.
A recent study demonstrates that more trade and fewer tariffs directly lead to less poverty. It finds that over the past decades, a 7% increase in trade will likely reduce poverty by >1%. Even more impressive, a reduction in tariffs of just 2.5% will reduce poverty by 1%.

___________________________________________________________________________
Ch 14: Increase Highly skilled migration by 10%
Ref: Keith Maskus. A Benefit-Cost Analysis of Increased International Migration of Skilled Labor in Africa and the World. Cambridge University Press: Journal of Benefit-Cost Analysis, Vol. 13, S1, 2023.
Policy: Invest ~$25B annually to increase high skilled (physician & STEM) migrant immigration to developed nations by 10% (assumes new migrants are ~30-35 yo with 25 yrs of work ahead and come from the same regions as the old migrants).
Benefits: Reduction in poverty (by 1/3 to 2/3); wages for the immigrating worker will rise nearly 5-fold; migrants will augment developed nations falling birth rates; lowering barriers to legal migration will help alleviate flows of illegal migration; potential reduction in inequality between nations.
Costs: ~$25B but delivering benefits 20x higher at $440B. Countries receiving migrants would incur the costs of processing applications and helping migrants settle in. Pessimistic estimates put these costs as high as $70K per worker for the first year. Researchers for a previous Copenhagen Consensus project estimated that for each dollar in costs incurred in opening migration, at least $45 in higher incomes would be delivered.
Concerns:
Brain Drain; the source country loses the production and taxes from emigrated physicians, and thus the dependency ratio for supporting children and the elderly deteriorates due to a less productive healthcare system (this efficiency loss is estimated at ~$0.3B for the global migration of physicians.
Workers in the receiving nations may see wage decline by 7% (other papers estimate real wages would fall by ~20%).
The cost of migration may be much higher than the $70K per worker mentioned above. Take, for instance, the difference in wages between Puerto Rico and the rest of the USA: It was some $20K in 2010 (~$500K in present-day lifetime income difference). Though there is full mobility between Puerto Rico and the USA, about two-thirds of all Puerto Ricans have chosen not to move.
Background
Skilled workers make up a very small proportion of ~180M working-age migrants in the world today- as defined by the UN’s Department of Economic and Social Affairs. The peer-reviewed paper for this chapter estimates there are almost 37M migrants with advanced educations. STEM workers make up ~9M of these, and medical doctors ~1M. For comparison, the world has about 136M STEM workers and ~13M doctors.
While rich Americans or Europeans may like to believe their countries’ dramatically higher wages are somehow justified by a more efficient or better-educated workforce, the overwhelming economic evidence shows that this is not the case. A large part of the difference is simply a “place premium”: Workers are paid more in rich countries because they live in highly productive societies where they are relatively scarce and, therefore, can negotiate a higher wage. One way to see that is to compare the wages of McDonald’s workers, who, by design, do identical work across the world and yet are paid in the USA 16x more than in India.
Removing all migration barriers mean that ~2B workers would move to the rich world. Today, the total number of workers in the rich world is ~ 670M, and that’s not even considering accompanying dependents. There seems to be no way that unrestricted migration could plausibly take place without enormous social upheaval, even if carefully phased in over decades.


___________________________________________________________________________
Ch 15: Land tenure security
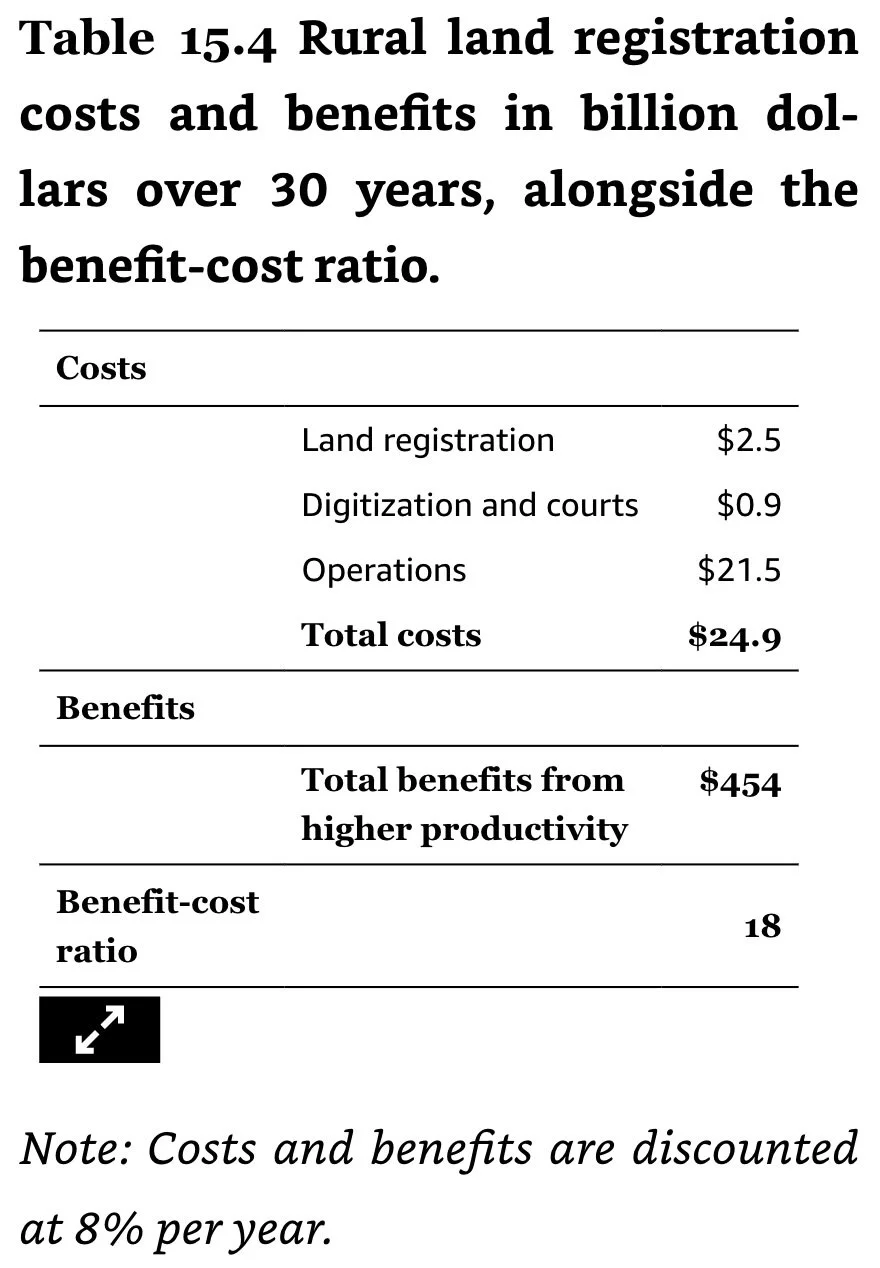
Ref: Frank Byamugishu. The investment case for land tenure security in sub-Saharan Africa: A cost-benefit analysis. Cambridge University Press: Journal of Benefit-Cost Analysis, Vol. 13, S1, 2023.
Policy: Increase land tenure security by providing funding to nations for digital land registration.
Benefits: Farmers will likely invest more in farm improvements and land conservation technologies that have high up-front costs and further-off benefits, including planting multi-year crops. Landowners will have more credit at their disposal to do this because they can mortgage the property or use their farms as tradable collateral. The result of all this should be to increase farms’ yields and farmers’ income…A large meta-study suggests that the most likely outcome of land tenure security is 15% higher household incomes (within 5 yrs).
Background
Just as you would be reluctant to put in a new kitchen in a house that might not be yours next year, farmers who are uncertain of ownership will invest less in the future productivity of the land they work. This includes planting multi-year crops, digging new wells, installing irrigation, or improving soil quality. The result is less food production and lower profitability for farmers. Agricultural land without security has 20% lower yields than land without uncertainty and conflict.
Only about 30 countries have nationwide, functioning land administration systems. Even if we look at just nations’ capital cities, fewer than half of the world’s countries (13% of African nations) have registered or mapped private land, and public land is often not registered at all. Per capita, the World Bank estimates that 70% of people have no access to formal land registration systems.
In the OECD, 97% of urban plots are mapped and 68% registered, with 71% and 68%, respectively, for rural areas. Globally, just 46% of urban areas and 24% of rural areas are mapped, with 22% registration for both.
Across Africa, of 213M total rural land parcels, ~14% are registered, leaving 86% (183M parcels) unregistered.
In sub-Saharan Africa, land disputes make up a high share of court cases (~50% in Ghana & Uganda, ~30-50% in Ethiopia).
Average Urban House across sub-Saharan Africa (46 nations): $48,000 (skewed by some smaller countries with very expensive housing such as Comoros and Gabon) (Ethiopia: $20,000).
Population-Weighted Average: $32K (includes house, land cost, taxes, legal compliance, infrastructure).

___________________________________________________________________________
Appendix. Benefit-cost analysis, discounting, and value-of-life
Benefit-Cost Analysis: The sum of the benefits divided by the sum of the costs.
Shared Socioeconomic Pathways (UN): A long-term economic prediction of population and GDP for the rest of the 21c for regions and countries.
Discount Rates: A drop in value of a government policy due to benefits that arrive long after the policy is implemented. One recent study found the average discount rate across rich countries was 4.2%. In general, research shows rates between 3% and 5%. In contrast, poorer countries’ discount rates range from 6–12%, with an average of 8.9%. This means that $100 one year from now in a rich country is worth about $96 now (at 4%), whereas it is worth just $92.60 in poorer countries (at 8%).
The World Bank’s internal guidelines suggest that a discount rate should be about double a country’s projected GDP growth per person. The growth estimates for the coming decades of the standardized SSP2 scenario for the poorer half of the world suggest a discount rate of 7.8%.
Road Accident Death Toll: Global- 1.3M; USA- 41,000; EU- 35,000.
Value of Statistical Life Year (VSLY): $4300 globally.
Value of 1 statistical US life: ~$10M.
Healthcare Costs per capita (2019): Rich countries- $5600; low & middle income- $86 (65x less).
___________________________________________________________________________
Covid
Because of Covid restrictions, the world saw a dramatic reduction in the number of people who were diagnosed with TB. This led to about 150,000 more people dying from TB in 2021, breaking the last three decades’ downward trend and resulting in a total death toll of nearly 1.4M.
In 2020 and 2021, influenced by Covid, the world saw what was likely the single-largest increase in hunger over recent decades: 150M more people or 1.7%. 2022 will be slightly better, despite the Russian invasion of Ukraine in early 2022, adding another 8M undernourished.
The 2020-2021 disruption of essential medical services treating malaria during the Covid pandemic, caused an estimated additional 63,000 deaths.
___________________________________________________________________________
Misc Quotes
“The policy of improving nutrition by fortifying wheat flour with iron and folic acid can save hundreds of infants and halve the number of anemic children.”
“Smallpox claimed the lives of Queen Mary II of England, the last of the Tudors; Tsar Peter II of Russia; and King Louis XV of France.”
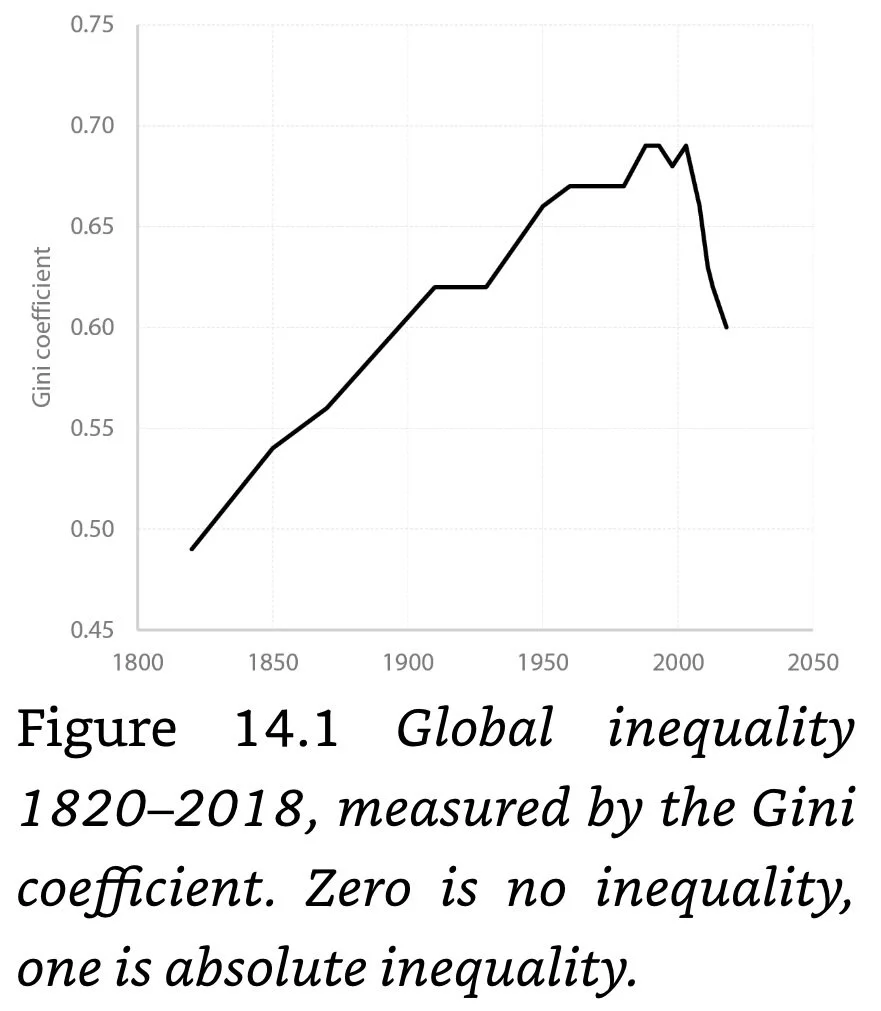
“The inequality that Marx and many others were focused on tackling: The difference between rich landowners, capitalists, and aristocrats versus the poor masses.”
“Each year, the USA grants 50,000 Green Cards but receives > 14M applications.”
___________________________________________________________________________
Terminology
Cronyism: The appointment of friends and associates to positions of authority, without proper regard to their qualifications.
Epidemiological Transition: The shift from communicable to noncommunicable (chronic) diseases (NCDs) as the leading cause of death in humans worldwide; particularly from cancer or cardiovascular disease.
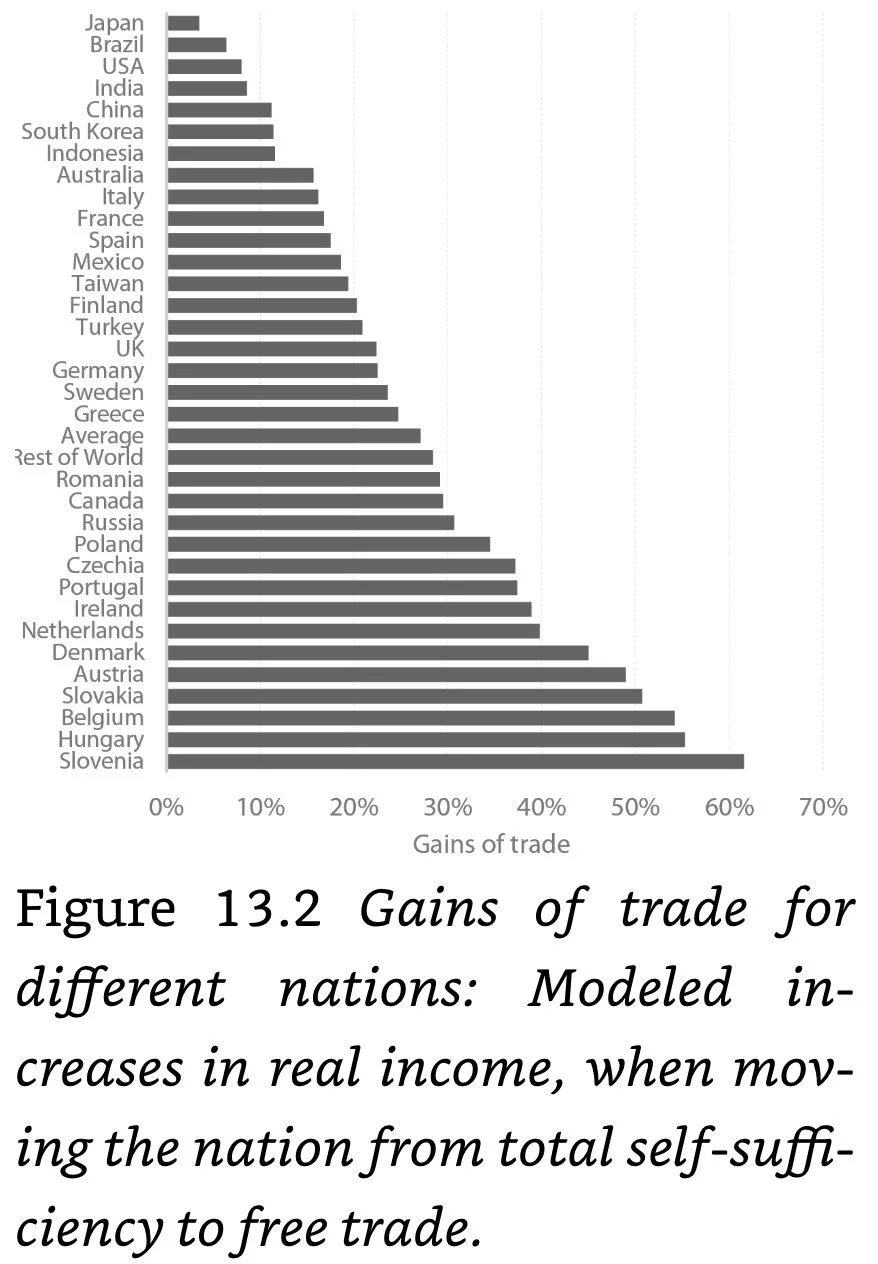
Gains of Trade: Models how much richer a country becomes when it moves from total self-sufficiency to some sort of trade with other nations.
Gini Coefficient: Measures inequality; runs from 0 (everyone has an equal income) to 1 (one person has all the income and everyone else has zero income).
Lives Saved Tool (LiST).
Pertussis: Medical term for whooping cough.
Prognosis: The likely course of a disease or ailment.
___________________________________________________________________________
Chronology
2023: 674M humans on Earth are living in extreme poverty (Best Things by Lomborg).
2022: 657M humans on Earth are living in extreme poverty (Best Things by Lomborg).
2021: China is declared malaria-free (Best Things by Lomborg).
2018: AU member countries sign the Free Movement Protocol in Addis Ababa, agreeing to “provide for the progressive implementation of free movement of persons, right of residence, and right of establishment in Africa” (Best Things by Lomborg).
2016: The UN adopts the Sustainable Development Goals (SDG’s). Running from 2016-2030, the SDGs have 169 targets, spread across 17 goals, far beyond the MDGs’ 18 targets and eight goals (Best Things by Lomborg).
2015. 836M humans on Earth are living in extreme poverty (Best Things by Lomborg).
2004: Female lung cancer rates peak due to smoking (Best Things by Lomborg).
Jan, 2000: The Bill and Melinda Gates foundation found Gavi, the Vaccine Alliance, to accelerate access to vaccines in the world’s poorest countries. In the first 17 yrs of the new century, it alone delivers about half of all development aid for vaccines (Best Things First by Lomborg).
1997: Chronic disease deaths surpass infectious disease deaths as the world’s leading cause of death (Best Things by Lomborg).
1995: The Zambian government passes the Lands Act which states “all land in Zambia shall vest absolutely in the President” and “the President may alienate land vested in him to any Zambian” (Best Things by Lomborg).
1991: Male lung cancer rates peak due to smoking, killing ~90 of every 100,000 (Best Things by Lomborg).
1990: 1.9B humans (a third of Earth’s population) live in extreme poverty (Best Things by Lomborg).
1978: The malaria parasite begins developing resistance to chloroquine, leading to a resurgence of malaria (Best Things by Lomborg).
1978: Smallpox is declared eradicated from Earth (Best Things by Lomborg).
1972: Chinese researcher Tu Youyou discovers a new drug called artemisinin, which comes from a traditional Chinese medicine extracted from the sweet wormwood herb (Best Things by Lomborg).
1970: Agronomist Normal Borlaug receives the Nobel Prize for his 1950s-1960s work ushering in the first Green Revolution, which is estimated to have saved ~8B lives (Best Things by Lomborg).
1961: The Addis Ababa Plan promises free education for all Africans by 1980. Come 1980, about half of all children of primary school age in Africa were still out of school (Best Things by Lomborg).
1951: Malaria is considered eradicated in the USA (Best Things by Lomborg).
1947-1949: The USG sprays > 4.5M US homes with DDT (Best Things by Lomborg).
1921: Scientists Albert Calmette and Camille Guérin first test their Bacille Calmette-Guerin vaccine against TB (Best Things by Lomborg).
1920: The League of Nations is founded “to promote international cooperation and to achieve international peace and security” (Best Things by Lomborg).
1902: Ronald Ross of the British Indian Medical Service receives the Nobel Prize for Medicine for discovering the mosquito stages of malaria (Best Things by Lomborg).
1900: ~75% of Earth’s human labor force works in farming. Today (2023), it’s <25% of the world’s workforce (Best Things by Lomborg).
1882: Robert Koch discovers the TB bacteria (Best Things by Lomborg).
1853: The British government pass the Compulsory Vaccination Act, which mandates the inoculation of all infants born in England or Wales against smallpox (Best Things by Lomborg).
14 May, 1796: Edward Jenner (1749-1823) noticed that women milking cows most often contracted the relatively mild bovine form of the smallpox virus, cowpox, and were then immune to smallpox infection. He wasn’t the first to make this observation, but he was the first to take action: Jenner placed a sample of the pustule from a cowpox-infected milkmaid’s hand under the skin of James Phipps, the 8-yr old son of Jenner’s gardener. He scraped pus from cowpox blisters on the hands of Sarah Nelmes, a milkmaid who had caught cowpox from a cow named Blossom. In the first-known case of inoculation, the young boy became immune to smallpox. Jenner decided to name this new procedure vaccination after the Latin word for cow, vacca (Best Things First by Lomborg, Wiki).
1241: Smallpox arrives in Iceland, killing 20K of the countries 70K (Best Things by Lomborg).
100: A smallpox epidemic kills ~7M throughout the Roman Empire (Best Things by Lomborg).
10,000 BCE: Smallpox first appears (Best Things by Lomborg).
___________________________________________________________________________