Geology with da Rosa
Ref: Jennifer da Rosa (2020). Geological Foundations in Environmental Science. JHU MS-ESP Course of Instruction. Email: jdarosa@jh.edu
_______________________________________________________________
Summary
An overview of Earth’s geological processes as they relate to environmental sciences with collated supporting articles.
_______________________________________________________________
River Flow & Erosion
Laminar Flow: All molecules within the fluid move parallel to each other in the direction of transport.
Turbulent Flow: Molecules in the fluid move in all directions but with a net movement in the transport direction.
Reynolds Number (Re): A dimensionless quantity that indicates the extent to which a flow is laminar or turbulent. Re= v* (l/v). First v= flow velocity, l= diameter of pipe or depth of flow in an open channel, second v= fluid viscosity. Fluid flow is laminar when the Re <500 and turbulent at >2000.
Rolling: Clasts move by rolling along at the bottom of the air or water flow without losing contact with the bed surface- bedload.
Saltation: Movement of particles in a series of jumps- bedload.
Suspension: Turbulence with the flow produces sufficient upward motion to keep particles in the moving fluid more or less continually- suspended load.
The settling velocity of particles in a fluid is determined by the size of the particle. The difference in the density between the particle and the fluid, and the fluid viscosity. The relationship is known as the Stokes Law: V= g*D^2*(ps-pr)/18u. V= terminal settling velocity, D= grain diameter, ps-pr is the difference between the particle density and the fluid density, and u is the fluid viscosity, g= gravity. Stokes law only applies to small grains (fine sand or less).
Subcritical Flow: Smooth water surface.
Supercritical Flow: Uneven water surface of wave crests and troughs.
Sub and supercritical flow are related via the Froude number: Fr= v/sqrt(g)*h. Fr is a ratio of the flow velocity to the velocity of a wave in the flow. Fr < 1, the flow is subcritical and a wave can propagate upstream because it is traveling faster than the flow. If the Fr >1, this indicates that the flow is too fast for a wave to propagate upstream and the flow is supercritical. In natural flows a sudden change in the height of the surface of the flow, a hydraulic jump is seen at the transition from thin supercritical flow to thicker subcritical flow.
Turbidity Currents: Gravity-driven turbid mixtures of sediment temporarily suspended in water.
_______________________________________________________________
Minerals
Stenos Law: Angles between equivalent crystal faces of the same mineral are consistent.
Silicate Minerals (>90% of Earth’s Crust)
Mineral Identification
Optical Properties: Luster, Light Transmission ability, color, streak.
Streak: Color of mineral in powdered form.
Crystal Shape (Habit): Fibrous, Bladed, Banded, Cubic, Tabular.
Mineral Strength: Hardness (Mohs Scale), Cleavage, Fracture, Tenacity.
Cleavage: Tendency to break or cleave along lattice planes.
Fracture: Breaking of minerals along unequal surfaces
Density & Specific Gravity
Other: Tase, Feel, Smell, Magnetism, Double Refraction, Effervescence.
Chemical Composition
_______________________________________________________________
Chemistry
Ionic Bond: Bonds between atoms in which electrons are transferred.
Covalent Bond: Bond between atoms in which electrons orbits are shared.
Metallic Bonds: Bond between atoms in which electrons move around freely.
_______________________________________________________________
Misc Quotes
“We place economic gain above ecological responsibility.”-Eric Bond.
_______________________________________________________________
Terminology
Angle of Rest: The maximum angle at which material is stable without clasts falling further down slope. The slope angle varies ranging from just over 30d for well-sorted sand to around 36d for angular gravel.
Desiccation Cracks: The hexagonal shape created by drying mud.
El Nino Southern Oscillation (ENSO): Warming of the Eastern Equatorial Pacific Ocean.
Mafic: Rich in Mg and Fe.
Radiative Forcing: The change in net radiative flux at the tropopause.
Rock Falls: Accumulations are seen as scree and build up as talus cones.
_______________________________________________________________
Chronology
2009: The USG under POTUS Obama pass the American Recovery and Reinvestment Act, dramatically expanding government subsidies for renewable energy development. Over three years, the Treasury awards $9B in “1603” grants to small and startup green energy companies, which accounted for 50% of the total non-hydropower renewables capacity added between 2009 and 2011 (Weber, 2016).
2007: SCOTUS decides the USEPA can regulate GHGs (Weber, 2016).
2007: SCOTUS argues Massachusetts v. EPA, deciding that CO2 is a pollutant covered under the Clean Air Act (CAA) (Weber, 2016).
2005: The USG passes the Energy Policy Act, offering grants, loans, and tax credits to firms developing renewable energy and “green” technologies such as solar panels, zero emission vehicles, and hybrid cars. The act included the “Halliburton Loophole”, sealing an exemption for fracking industries from EPA oversight (Weber, 2016).
2002: The last US Asbestos mine closes (DHHS, 2016).
1992: The USG passes the Energy Policy Act, providing a tax credit of 2.3 cents per kWh to renewable energy generators in order to make renewables more competitive with natural gas and coal (Weber, 2016).
1990: The USG passes the Water Settlement Act, enabling the USG to appropriate money to buy existing water rights to restore Stillwater (Pringle, 2000).
1980: The USG passes the Comprehensive Environmental Response, Compensation, and Liability Act (CERCLA) to regulate hazardous chemicals (Weber, 2016).
1976: The Caribbean National Forest is declared a Biosphere Reserve by UNESCOs Man and the Biosphere Programme (Pringle, 2000).
1974: The USG passes the Safe Drinking Water Act (SDWA), requiring the EPA to regulate underground fluid injection and banning the injection of hazardous materials, but exempting hydraulic fracking (Weber, 2016).
1972: The USG passes the Clean Water Act (CWA) (Weber, 2016).
1972: The first federal regulations limiting exposure of workers to asbestos are enacted (5fibers/cm3) (Brandi, 2006).
1970: The USG passes the National Environmental Policy Act, requiring the preparation of environmental impact assessments prior to drilling on federal lands (Weber, 2016).
1930: Milankovitch publishes Mathematical Climatology and the Astronomical Theory of Climate Change theorizing the ice ages occurred when orbital variations caused the Northern Hemisphere around the latitude of the Hudson Bay and northern Europe to receive less sunshine in the summer. Short, cool summers failed to melt all of the winter’s snow. The snow would slowly accumulate from year to year, and its shiny, white surface would reflect more radiation back into space. Temperatures would drop even further, and eventually, an ice age would be in full swing. Based on the orbital variations, Milankovitch predicted that the ice ages would peak every 100,000 and 41,000 years, with additional “blips” every 19,000 to 23,000 years (Riebeek, 2005).
1920: New Zealand physicist Ernest Rutherford speculates that the nuclei of atoms might contain a neutral particle (Faure, 1976).
1919: New Zealand physicist Ernest Rutherford attributes the positive charge of the nucleus to protons (Faure, 1976).
1911: Marie Curie receives the Nobel prize in chemistry in recognition of her successful efforts to isolate pure Radium (Faure, 1976).
1903: Polish Psychists Marie Curie, her husband French Physicist Pierre Curie, and Henri Becquerel share the Nobel Prize for physics for the discovery of radioactivity (Faure, 1976).
1899: New Zealand physicist Ernest Rutherford reports that the radiation emitted by radioactive substances consists of three different components which he names alpha, beta, and gamma (Faure, 1976).
Rate of Disintegration: -dN/dt= λN (λ= decay constant, N= #radioactive atoms).
1895: Svante Arrhenius, looking to understand Ice Ages, proposes the idea that a drop in temperatures could have been produced by a drop in the concentration of atmospheric CO2. He also proposes that industrial emissions could raise Earth’s temperature (Riebeek, 2005).
24 Jul, 1837: Agassiz presents the idea of Ice Ages at a meeting of the Swiss Society. He was met with rage and his ideas were not accepted until the 1870s (Riebeek, 2005).
1830: Charles Lyell published the first volumes of his “Principles of Geology” (Faure, 1976).
1807: Formation of the Geological Society of London (Gordon, 2011).
1785: Hutton pens “Theory or the Earth” in which he presents the theory of Uniformitarianism; that geological processes occurring now have shaped the history of the Earth in the past and would continue to do so in the future (Faure, 1976).
1710: Maunder Minimum; the sun is relatively quiet, bombarding Earth with fewer UV rays than normal. Decreases in the amount of UV energy hammering the Earth change the stratosphere by decreasing the amount of ozone that is produced (Riebeek, 2005).
1650: Maunder Minimum; the sun is relatively quiet, bombarding Earth with fewer UV rays than normal. Decreases in the amount of UV energy hammering the Earth change the stratosphere by decreasing the amount of ozone that is produced (Riebeek, 2005).
3 Ma: Mid Pliocene Warm Period (Hansen, 2013).
5-3 Ma: Growth of NH Ice Sheets (Hansen, 2013).
15 Ma: Peak warming of Miocene (Hansen, 2013).
34 Ma: Earth becomes cool enough for large-scale glaciation of Antarctica (Hansen, 2013).
50 Ma: India collides with Asia causing global atmospheric CO2 to reach ~1000ppm with global average surface temperatures reaching 33 C. Over millions of years, much of the CO2 is deposited in the oceans bringing CO2 levels down to ~170ppm during recent glacial periods (Hansen, 2013).
53-51 Ma: Early Eocene Climatic Optimum (EECO); Earth’s CO2 and Temperatures reach a high (Zachos, 2008).
55 Ma: Paleocene–Eocene Thermal Maximum (PETM); global temperature increases by more than 5 °C in less than 10,000 years. At about the same time, more than 2,000 Gt C as CO2 — comparable in magnitude to that which could occur over the coming centuries — enter the atmosphere and ocean (Zachos, 2008).
56 Ma: Paleocene-Eocene Thermal Maximum (PETM); warming increases 5 C conicident with injection of a likely 4-7 Tt of Carbon, most likely from ocean acidification and release/melting of methane hydrates on continental shelves. Additional sources include release of Carbon in Antarctice permafrost and peat. PETM was combined with Earth's orbit eccentricity and spin axis tilt (Hansen, 2013).
The PETM occurred due to the orbitally triggered decomposition of soil organic carbon in circum-Arctic and Antarctic terrestrial permafrost. This massive carbon reservoir had the potential to repeatedly release thousands of petagrams (1015 grams) of C to the atmosphere–ocean system (Decanto, 2012).
66.5-35 Ma: Earth is so warm that there is little ice on the planet (Hansen, 2013).
100 Ma: Convection cells under the Mesozoic Mid-oceanic Pacific ridge cease to function and the crest of the Pacific Ocean Ridge begins to subside (Hess, 1962).
325 Ma: Erosion of the Appalachians carries sand deposits to the 4 corners area of the US depositing massive sandstones. The 4 corners at the time were near shore in the tropics (Blatt, 1996).
525 Ma: Paleozoic closing of the so-called Iapetus Ocean or the Ancestral Atlantic) which creates the Appalachians. Episodic metamorphism and deformation throughout the entire Appalachian chain continued until the late Paleozoic, including the strong Acadian event at 420-370 ma and culminating in the Alleghenian event throughout the chain at 320-270ma (Blatt, 1996).
_______________________________________________________________
---Articles---
_______________________________________________________________
The Tragedy of the Commons by Hardin
Ref: Garrett Hardin (13 Dec, 1968). The Tragedy of the Commons. Science, New Series, Vol. 162, No. 3859, pp. 1243-1248. American Association for the Advancement of Science.
A technical solution may be defined as one that requires a change only in the techniques of the natural sciences, demanding little or nothing in the way of change in human values or ideas of morality.
Each man is locked into a system that compels him to increase his herd without limit-in a world that is limited.
The Morality of an act is a function of the state of the system at the time it is performed.
“The truth that is suppressed by friends is the readiest weapons of the enemy.”-Robert Louis Stevenson.
The only way we can preserve and nurture others and more precious freedoms is by relinquishing the freedom to breed.
_______________________________________________________________
Sketches Here and There by Leopold
Ref: Aldo Leopold (1949). Sketches Here and There. Sound County Almanac, Oxford University Press, ISBN: 0-190505305-2.
An ethic, ecologically, is a limitation on freedom of action in the struggle for existence.
Politics and Economics are advanced symbioses in which the original free-for-all competition has been replaced, in part, by cooperative mechanisms with an ethical content.
There is as of yet no ethic dealing with man’s relationship with land and the animals and plants that grow on it.
Humans are destroying the “land” with zero disregard.
Conservation is a state of harmony amongst men and land.
The usual answer to this dilemma is ‘more conservation education.’ No one will debate this, but is it certain that only the volume of education needs stepping up? Is something lacking in the content as well? It is difficult to give a fair summary of its content in brief form, but, as I understand it, the content is substantially this: obey the law, vote right, join some organizations, and practice what conservation is profitable on your own land; the government will do the rest. Is not this formula too easy to accomplish anything worth-while? It defines no right or wrong, assigns no obligation, calls for no sacrifice, implies no change in the current philosophy of values. In respect of land-use, it urges only enlightened self-interest. Just how far will such education take us?
All gains from density are subject to a law of diminishing returns.
The same basic paradoxes: man the conqueror versus man the biotic citizen; science the sharpener of his sword versus science the searchlight on his universe; land the slave and servant versus land the collective organism.
Quit thinking about decent land-use as solely an economic problem. Examine each question in terms of what is ethically and esthetically right, as well as what is economically expedient. A thing is right when it tends to preserve the integrity, stability, and beauty of the biotic community. It is wrong when it tends otherwise.
The mechanism of operation is the same for any ethic: social approbation for right actions: social disapproval for wrong actions.
_______________________________________________________________
The Origin of Continents by Wegener
Ref: Alfred Wegener (6 Jan, 1912). The Origin of Continents. International Journal of Earth Sciences. Translated by Roland von Huene.
More important is a work by Taylor in which he proposed the Tertiary separation of Greenland from North America and connects it with the building of the Tertiary Mountains.
One must conclude that there are no objections to possible, unusually slow, but large horizontal movements of the continents under a steady force during geologic time.
Wegener’s Clues: Continental puzzle pieces, fossil evidence, mountain chains, flora/fauna, geographic similarities, glaciation, paleoclimate history, polar wander, paleontological discoveries.
We are not yet able to explain the cause of drift.
Separation from Africa and India appears to have occurred at the same time (Triassic).
_______________________________________________________________
History of Ocean Basins by Hess
Ref: H. Hess (Nov, 1962). History of Ocean Basins. Princeton University.
An Essay in Geopoetry.
It is postulated that volatile constituents trapped within its interior have during the past and are today leaving to the surface, and that by such means the present oceans and atmosphere have evolved.
A single cell (toroidal) convective overturn took place resulting in the formation of a Ni-Fe core, and at the same time the low-melting silicates were extruded over the rising limbs of the current to form the primordial single continent.
If the water were removed from the Earth, two distinct topographic levels would be apparent: 1) the deep sea floor about 5km below sea level and 2) the continental surface a few hundred meters above sea level.
Seismic evidence shows that the so-called crustal thickness- depth to the M discontinuity- is 6km under oceans and 34km under continents on the average. Gravity data prove that these two types of crustal columns have the same mass- the pressure at some arbitrary level beneath them, such as 40km.
Hess’ Evidence: Paleomagnetic Data
Migration of the poles as measured in Europe, North America, Australia, India, etc, has not been the same for each of these land masses. This strongly indicates independent movement.
Earth's topography might be attributed to a dynamic situation in the present Earth whereby the continents move to positions dictated by a fairly regular system of convection cells in the mantle.
The Mid-Ocean ridges could represent the traces of the rising limbs of convection cells, while the circum-Pacific belt of deformation and volcanism represents descending limbs. The Mid-Atlantic Ridge is median because the continental areas on each side of it have moved away from it at the same rate- 1cm/yr.
100 Ma: Convection cells under the Mesozoic Mid-oceanic Pacific ridge cease to function and the crest of the Pacific Ocean Ridge begins to subside (Hess, 1962).
High Heat flow requires that the 500-degree Celsius isotherm be at very shallow depth.
Mesozoic Mid-Pacific Ridge: Volcanoes truncated on the ridge crest move away from the ridge axis at a rate of 1cm/yr. Eventually they move down the ridge flank and become guyots or atolls rising from the deep-sea floor. Those 1000km from the axis, however, were truncated 100 million years before those now near the center of the old ridge.
Development of the Oceanic Crust and the Evolution of Seawater
Uniform thickness (4.7 +/- .5km) is controlled by the highest level the 500 degree C isotherm.
Convecting with a velocity of 1cm/yr a vertical layer 1cm thick of layer 3 on each side of the ridge axis is being formed each year. The material formed is 70% serpentinized, based on an average seismic velocity of 6.7km/sec, and this serpentine contains 25% water by volume. If we multiply these various quantities, the volume of water leaving the mantle each year can be estimated at .4km3. Had this process operated at this rate for 4 aeons, 1.6e9 km3 of water would have been extracted from the mantle, and this less .3e9 km3 of water now in layer 3 equals 1.3e9 km3 or approximately the present volume of water in the oceans.
The East Pacific Rise crosses the Mesozoic ridge at right angles and presumably did not come into existence until recent times, but certainly less than 100 ma. No evidence of older ridges is found in the oceans, suggesting that convection is effective in wiping the slate clean every 200-300 million years.
It is thus evident that if the oceans were half as deep, the continents would be eroded to come to equilibrium with the new sea level, they would rise isostatically, and a new and much shallower depth to the M discontinuity under continents would gradually be established.
An increase of depth of the sea by 1km allows thickening of the continents by about 5x this amount.
Recapitulation: The following assumptions were made, and the following conclusions reached:
The mantle is convecting at a rate of 1cm/yr.
The convecting cells have rising limbs under the mid-ocean ridges.
Hydrated Mantle Material (hydrated oceanic lithosphere).
The uniform thickness of the oceanic crust results from the max height that the 500 degree C isotherm can reach under the mid-ocean ridge.
Mid-Ocean Ridges are ephemeral features having a life of 200-300 million years (the life of the convecting cell).
The Mid-Pacific Mesozoic Ridge is the only trace of a ridge of the last cycle of convecting cells.
The upper surface of continents approaches equilibrium with sea level by erosion. It is thus axiomatic that the thickness of continents is dependent on the depths of the oceans.
_______________________________________________________________
Spreading of the Ocean Floor by Vine
Ref: F. J. Vine (16 Dec, 1966). Spreading of the Ocean Floor: New Evidence. Sciences, New Series, Vol. 154, No 3755. American Association for the Advancement of Science.
Evidence Used: Remanent Magnetization of the Oceanic Crust.
As new oceanic crust forms and cools through the Curie Temperature at the center of an oceanic ridge, the permanent component of its magnetization, which predominates, will assume the ambient direction of Earth’s magnetic field.
Vine-Matthews Hypothesis: 1) linear magnetic anomalies should parallel or subparallel ridge crests, and 2) for many latitudes and orientations the anomalies should be symmetric about the axis of the ridge.
Last 4M Years: The East Pacific Rise is separating at 4.4cm/yr, the Juan De Fuca: 2.9cm/yr, and the Reykjanes Ridge: 1cm/yr.
The faults appear to accommodate changes in direction of the ridge crest in splitting the continents.
If this observation is significant and the ridge systems in these areas are not actively spreading, the active part of the ridge systems at present appears to form two isolated lengths, each traversing half the circumference of Earth: one extends from the Red Sea and the Gulf of Aden, south of Australia, and across the East Pacific to the Gulf of California; the other, down the whole length of the Atlantic.
Variations in the intensity and polarity of Earth’s magnetic field are considered to be recorded in the remanent magnetism of the igneous rocks as they solidified and cooled through the Curie T at the crest of an oceanic ridge, and subsequently spread away from it at a steady rate. The hypothesis is supported by the extreme linearity and continuity of oceanic magnetic anomalies and their symmetry about the axes of ridges.
Thus, one is led to the suggestion that the crest of the East Pacific Rise in the NE Pacific has been overridden and modified by the westward drift of North America, with the production of the anomalous width and unique features of the American cordillera in the western US.
_______________________________________________________________
Did the Atlantic Close and then Re-Open? by Wilson
Ref: Wilson (13 Aug, 1966). Did the Atlantic Close and then Re-Open? Institute of Earth Sciences. Nature Publishing Group.
Since the beginning of the Cretaceous period the present Atlantic Ocean has been opening.
Evidence Used: Rock Comparison, fault/juncture comparison, flora/fauna/fossil’s.
The evidence suggests that New England is divided by a major fault zone into two provinces underlain by quite different rock formations.
The Western Rim of Africa is made, from Guinea to Morocco, not of a pre-Cambrian basement but of a mainly Hercynian Orogenic belt, in some respects symmetrical to the Appalachian belt.
_______________________________________________________________
Mineral Resources and Sustainability by NRC
Ref: National Research Council (1996). Mineral Resources and Sustainability: Challenges for Earth Scientists. Washington, DC: The National Academies Press. https://doi.org/10.17226/9077.
Summary: Importance of sustainable mining and in communicating and understanding the physical limitations and economic importance of mineral supply.
Sustainability: Economic activity today not come at the cost of extensive environmental degradation and resource depletion that future generations are worse off than we are.
Sustainability is meeting the needs of today without compromising the ability of future generations to meet their needs (Brundtland Report).
A sustainable path is one that allows every future generation the option of being as well off as its predecessors” (Solow, 1993).
Minerals aren’t renewable- there are a finite amount of them.
Why it’s not such a big deal: Additional reserves from technological development and exploration, recycling, substitution of more common minerals for less.
Government has a responsibility to help define what environmental costs (damages) are acceptable and establish standards and best practices in exchange for the benefits of mining.
_______________________________________________________________
14th Report on Carcinogens by DHHS
Ref: US Department of Health and Human Services (2016). 14th Report on Carcinogens.
Chemical Abstracts Service (CAS): Assigns a number to all chemicals.
Asbestos: CAS No. 1332-21-4.
Coal Workers Pneumoconiosis (CWP): “Black Lung”; caused by coal dust inhalation. IARC (1977, 1987) concluded that there was sufficient evidence in experimental animals for the carcinogenicity of asbestos, including the following forms: actinolite, amosite, anthophyllite, chrysotile, crocidolite, and tremolite.
Asbestos: The generic name for a group of six naturally occurring fibrous silicate minerals, including the fibrous serpentine mineral chrysotile and the five fibrous amphibole minerals actinolite, amosite, anthophyllite, crocidolite, and tremolite. Asbestos minerals possess a number of properties useful in commercial applications, including heat stability, thermal and electrical insulation, wear and friction characteristics, tensile strength, the ability to be woven, and resistance to chemical and biological degradation.
IARC (1977, 1987) concluded that there was sufficient evidence in experimental animals for the carcinogenicity of asbestos, including the following forms: actinolite, amosite, anthophyllite, chrysotile, crocidolite, and tremolite.
Chrysotile: The most abundant form of asbestos in industrial applications, occurs naturally in fiber bundle lengths ranging from several mm to over 10 cm (Virta 2002a). Chrysotile has an idealized chemical composition of Mg3Si2O5(OH)4.
Amphibole: Consist of two chains based on Si4O11 units, linked by a band of cations. The principal cations are Mg, Fe, Ca, and Na, and their ratios determine the mineral species.
Amosite: Ash gray, greenish, or brown and is somewhat resistant to acids. It tends to occur with more Fe than Mg, at a ratio of ~5.5 to 1.5. The fibers are long, straight, coarse, and somewhat flexible.
Anthophyllite: Grayish white, brown-gray, or green and is very resistant to acids. It is relatively rare and occasionally occurs as a contaminant in talc deposits. The fibers are short and very brittle.
Crocidolite: Lavender or blue and has good resistance to acids, but less heat resistance than other asbestos fibers. Its fibers typically are shorter and thinner than those of other amphiboles, but not as thin as chrysotile fibers. The fibers have fair to good flexibility and fair spinnability.
Tremolite: A Ca-Mg amphibole, and actinolite is an Fe-substituted derivative of tremolite. Both occur in asbestos and non-asbestos forms. Tremolite is a common contaminant in chrysotile and talc deposits, and actinolite is a common contaminant in amosite deposits. Tremolite is white to gray, and actinolite is pale to dark green.
Asbestos has been used in roofing, thermal and electrical insulation, cement pipe and sheets, flooring, gaskets, friction materials, coatings, plastics, textiles, paper, and other products.
In 1973, US consumption of asbestos peaks with the major makets being asbestos cement pipes (24%), flooring (22%), roofing (9%), friction products, such as automobile brakes and clutches (8%), and packing and gaskets (3%) (Virta 2002a). In 2009, roofing products accounted for about 65% of U.S. consumption; the remaining 35% was attributed to “other uses” (USGS 2010).
Primary Routes of Asbestos exposure are inhalation and ingestion.
Fiber diameter is the most important factor affecting penetration and deposition in the lungs. Thin fibers have the greatest inhalation potential and deposit deep within the lungs. Fiber length, surface chemistry, and other properties affect biological activity. Fibers longer than 8 μm with a diameter of less than 1.5 μm are the most potent carcinogens (IPCS 1986).
2002: The last US Asbestos mine closes (DHHS, 2016).
_______________________________________________________________
Mining History, Geology, Minerology, and Amphibole Asbestos Health Effects by Brandi & Gunter
Ref: Bandi & Gunter (2006). A Review of Scientific Literature Examining the Mining History, Geology, Mineralogy, and Amphibole Asbestos Health Effects of the Rainy Creek Igneous Complex, Libby, Montana, USA. Inhalation Toxicology, 18:949-962.
1970: The USG passes the Occupational Safety & Health Act creating OSHA.
1972: The first federal regulations limiting exposure of workers to asbestos are enacted (5fibers/cm3) (Brandi, 2006).
Mesothelioma: A type of cancer that develops from the thin layer of tissue that covers many of the internal organs (known as the mesothelium).
American Cancer Society lists Mesothelioma 5yr survival rate at 10%.
Lung Cancer: Cancer inside the lungs, generally due to smoking.
If you ever see construction workers spraying a coat of water on their work- it’s solely to keep the airborne dust levels down.
The increase in the risk of developing lung cancer was determined to be 0.6% for each fiber-year of exposure (Amandus & Wheeler, 1987). It was also determined that the most significant risk factors were age, employment at the vermiculite mine, living with an employee of the mine, and being male.
_______________________________________________________________
The Reaction Principle in Petrogenesis by Bowen
Ref: Bowen (1922). The Reaction Principle in Petrogenesis. The Journal of Geology, Vol. 30, No. 3.
I think what the author is getting at here is that our attempts at classifying rocks by a type are a bit foolhardy.
The concentration of different minerals in a rock is entirely dependent on its parent structure, amount of liquid present, and its rate of cooling.
Petrogenesis: The formation of rocks.
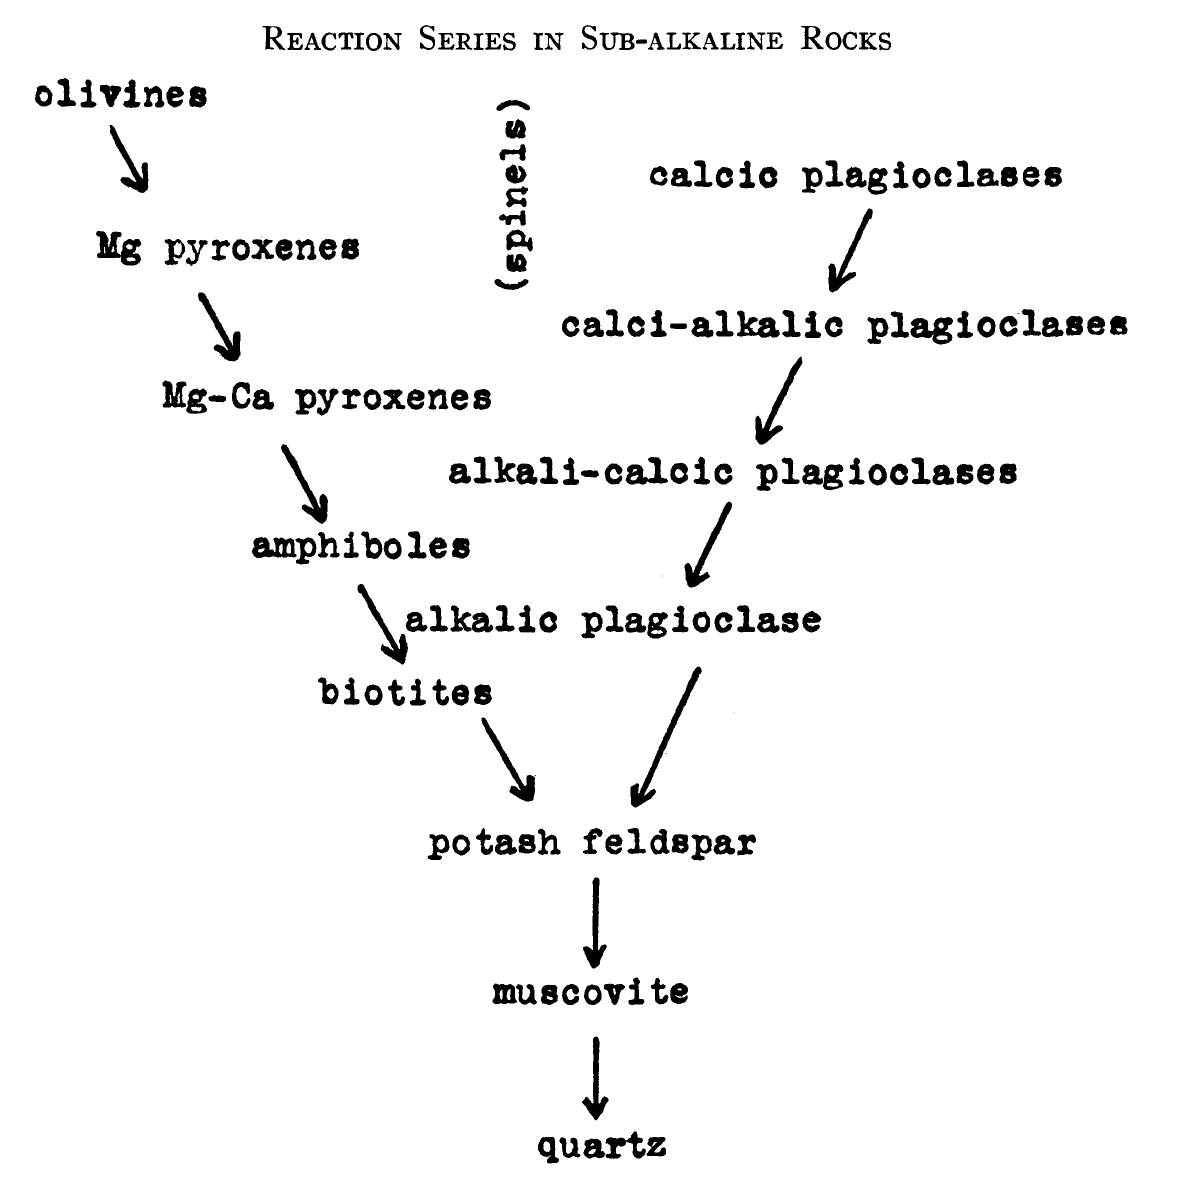
Bowens Reaction Series: Replaced Eutectic System theory; rock series cannot be partitioned off into such divisions as gabbro, diorite, etc., each having a eutectic of its own. All of these belong to a single crystallization series, to a single poly-component system, which is dominated by reaction series.
Reaction Pair: Crystals of the first compound react with the liquid to produce the second during the normal course of crystallization.
Continuous Reaction Series
The ordinary solid solution series such as the plagioclases may be regarded as a continuous reaction series because during crystallization each member is produced from an earlier member by reaction with the liquid, the variation of composition being continuous.
Zoning of Mix Crystals: The tendency of one mineral to grow around another as nucleus.
Discontinuous Reaction Series
Liquid reacts with olivines to produce pyroxenes, with pyroxenes to produce amphiboles, and with amphiboles to produce biotites.
There is always a liquid left that does not crystallize and it is probable that to the very last the rock constituents bear a reaction relation to this.
_______________________________________________________________
Transport & Deposition of a Pyroclastic Surge Across an Area of High Relief by Fisher
Ref: Fisher (1990). Transport and Deposition of a Pyroclastic Surge across an area of High Relief: The 18 May, 1980 eruption of Mt. Saint Helens.
The purpose of this study is to determine the causes and mechanisms by which the Mount St. Helens blast surge deposited several layers of tephra.
Layer A0: Interaction of ground with moving blast surge.
Layer A1: Deposited directly from the blast surge. Lower gray color and lower % of fines than A2.
Layer A2: Deposits directly from the blast surge. Greater % of fines than A1 and yellow to yellow-gray in color (was initially olive gray).
Layer A3: Fallout layer.
Layer A4.
Layer A5.
_______________________________________________________________
Volcanic Eruptions and Climate by Robock
Ref: Robock (May, 2000). Volcanic Eruptions and Climate. Review of Geophysics.
It is crucial to quantify the natural fluctuations so as to separate them from the anthropogenic fluctuations in the climate record.
Large volcanic eruptions inject S gases into the stratosphere, which convert sulfate aerosols.
The volcanic aerosols also serve as surfaces for heterogenous chemical reactions that destroy stratospheric ozone, which lowers UV absorption and reduces the radiative heating in the lower stratosphere.
Volcanic eruptions can inject into the stratosphere tens of tera-grams of chemically and microphysically active gases and solid aerosol particles, which affect the Earth's radiative balance and climate, and disturb the
stratospheric chemical equilibrium.Magmatic Material emerges as solid, lithic material or solidifies into large particles, called Ash or Tephra.
Ash and Tephra falls out of the Atmosphere rapidly, in minutes to weeks in the troposphere. This temporary loading reduces the amplitude of the diurnal cycle of surface air temperature in the region of the tropospheric cloud. These effects disappear as soon as the particles settle to the ground.
Gas is emitted with water, N2, and CO2 (the most abundant). Over the lifetime of the Earth these gases have been the main source of the planet’s atmosphere and ocean. The water has condensed into the oceans, the CO2 has been changed by plants into O2, with some of the C turned into fossil fuels.
Emitted sulfur as SO2 and H2S is released and reacts with OH and H20 to form H2SO4 on a timescale of weeks. The H2SO4 aerosols produce the dominants radiative effect from volcanic eruptions. Once injected, the particles rapidly advect around the globe. The normal residual stratospheric meridional circulation lifts the aerosols in the tropics, transports them poleward in the midlatitudes, and brings them back into the troposphere at higher latitudes on a timescale of 1-2y. Radiative forcing (measured at the surface) from the ~14% Sulfur emissions from volcanoes is estimated at -.2W/m2. The sulfates decrease Solar transmission and cool the earth over a couple years. The light is backscattered, reflecting sunlight back to space and increasing the net planetary albedo and reducing the amount of solar energy that reaches the Earth's surface. At the top of the aerosol cloud, the atmosphere is warmed by absorption of solar radiation in the near IR. This effect dominates over the enhanced IR cooling due to the enhanced emissivity because of the presence of aerosols. In the lower stratosphere
the atmosphere is heated by absorption of upward longwave radiation from the troposphere. This creates a global cooling. The aerosol cloud also mixes with methane and other anthropogenic emissions to destroy ozone which increases surface UV.Radiative Forcing: The change in net radiative flux at the tropopause.
_______________________________________________________________
A Study in Rock-Weather by Goldich
Ref: Goldich (Feb, 1938). A Study in Rock-Weather. The Journal of Geology, Vol. 46, No. 1.
Summary: The Process of the decomposition of rock with a mineral-stability series in weathering. Goldich looks at the decomposition due to weather of numerous rock samples to create this mineral stability series identifying least stable, moderately stable, and most stable minerals in a chemically weathering rock.
As weathering goes on, quartz composition goes up as silicates drop off.
Olivine yields readily to weathering, then Augite, Hornblende, Biotite.
Potash Feldspars are more resistant than soda-lime feldspars, and sodic plagioclase is more durable than calcic plagioclase.
Muscovite appears to be the most resistant to decomposition.
As a group, the mafic minerals are less stable than the salic minerals.
Hydrolysis is the most important process of decomposition.
_______________________________________________________________
The Historical Record of Atmospheric Pyrolytic Pollution over Europe by Fernandez
Ref: Fernandez et al (2000). The Historical Record of Atmospheric Pyrolytic Pollution over Europe Registered in the Sedimentary PAH from Remote Mountain Lakes. Journal of Environmental Science and Technology, Vol. 34, No. 10.
Polycyclic Aromatic Hydrocarbon (PAH): Have you ever overcooked your food on the stove? Or in the Oven? And parts, or maybe all, if you're an exceptionally bad chef, turn black? Congrats, you just formed types of PAH in your kitchen! PAHs are naturally occurring chemicals found in organic materials including coal, gas, and wood comprised of hydrocarbons and, when burned, the chemical is released on a large scale; in my article, PAH anomalies were traced to mountain lakes around Europe.
Perylene: A type of PAH that was most abundant in ancient sediment layers.
Retene: A type of PAH that is hypothesized to be a "molecular marker of wood combustion (Fernandez, 2000)." Think: wood burning fires- both natural and man-made.
1.7- dimethylphenanthrene & 2.6- dimethylphenanthrene: PAHs "proposed as indicator of the relative contribution to pyrogenic PAH from wood to fossil fuel combustion (Fernandez, 2000)." Another chemical released from wood burning but also hypothesized to come from fossil fuel combustion.
Pyrogenic: Caused by producing heat.
Article Summary: A study of changing PAH levels using sediment cores was conducted at ten remote high altitude (above the local tree line), oligotrophic lakes throughout Europe to assess industrial revolution changes beginning from 1830- today. The remoteness of these high-altitude lakes helps to minimize local pollution and assess PAH levels as transported through the atmosphere. Location were chosen from mountains in Portugal, the Pyrenees, the Tatras, the Alps, and locations in Norway and the Arctic. Cores were taken from the bottom of alpine lakes to assess changes in, or flux, of sedimentation, total organic carbon, and PAH summation (23 different PAHs). The assessment showed an increase in PAHs from the start of the industrial revolution over time, peaking in the 1960's and then, with some exceptions, declining steadily through the 1970s-1990s.
_______________________________________________________________
Sedimentology & Stratigraphy by Nichols
Ref: Gary Nichols (2009). Sedimentology and Stratigraphy, 2nd Edition. Blackwell Publishing
Methods of Relative Dating
Lithostratigraphic: Rock Aging.
Biostratigraphic: Correlation using trees, fossils, corals.
Magnetostratigraphic: Correlation using Earth poles. Magnetic material acquires the polarity of the ambient magnetic field as it cools through the Curie Point, a T above which the magnetic dipoles in the material are mobile and free to reorient themselves.
Chemostratigraphic.
Methods of Absolute/Temporal Dating
Radiometric Dating: Dating igneous, metamorphic, and individual sedimentary grains. Requires the rate of decay and the proportion of different isotopes present when the mineral formed. To calculate the age of a rock: N = N0 e-lt, t= 1/ l x ln (N0/N+1), (N0= # parent atoms at the start, N= # daughter atoms after a period of time t, l= decay constant).
Assumption: only parent rock is present when a mineral crystalizes out of a magma.
Process: 1) Collect several kg of rock sample, 2) crush samples to sand and mix, 3) select a smaller subsample, 4) measure isotope concentration with a mass spectrometer, 5) a small amount (mg) of the sample is heated in a vacuum to ionize the isotopes and the charged particles are then accelerated along a tube in a vacuum by a potential difference. Part way along the tube a magnetic field induced by an electromagnet deflects the charged particles. The amount of deflection depends upon the atomic mass of the particles so different isotopes are separated by their different masses. Detectors at the end of the tube record the number of charged particles of a particular atomic mass and provide a ratio of the isotopes present in a sample.
40K- 40A ½ life: 1.25e3 years.
87Rb- 87Sr ½ life: 48.8e3 years.
147Sm- 143Nd ½ life: 1.06e3 years.
187Re- 187Os ½ life: 42e3 years.
232Th- 208Pb ½ life: 14.01e3 years.
235U- 207Pb ½ life: .704e3 years.
238U- 206Pb ½ life: 4.468e3 years.
14C-14N, ½ life: 5730yr, used for dating archaeological finds.
Strontium Ratios.
Thermochronological.
O Isotope.
Cosmogenic Isotopes.
Amino- Acid Racemization.
Rockbed Characteristics: Bed Thickness, Sedimentary Structure, Fossils (body and trace), Rock Colour, degree of weather, degree of consolidation.
Sedimentary Log: Graphical method for representing a series of beds of sediments or sedimentary rocks.
Stratigraphic Framework: Means of determining which strata are of ~the same age in different areas, which are older and which are younger.
Pigeonholing: Trying to match a succession of rocks to a particular facies model.
_______________________________________________________________
Petrology by Blatt & Tracy
Ref: Blatt & Tracy (1996). Petrology: Igneous, Sedimentary, and Metamorphic. 2nd Edition.
Prior to the advent of precise methods for pressure-temperature estimation, petrologists used semiquantitative techniques to subdivide the P-T plane into regions characterized by particular metamorphic assemblages. These regions are known as Metamorphic Facies.
The traditional view is that metamorphism was caused by simple rock burial, which produced pressure increase through weight overburden and temperature increase along a normal geothermal gradient.
In reality, peak metamorphic pressure and T in many, if not most, metamorphic terranes do not actually lie along normal geothermal gradients.
The concept of metamorphic isogrades derives directly from the work of Barrow in the Eastern Highlands of Scotland in the 1890s. This work develops Metamorphic Zones. Each mineralogic zone is characterized by the presence of a new mineral that was not present in the previous zone; this new mineral is
termed an index mineral. A line drawn on a map to represent the locations on the Earth's surface of samples marking the first appearance of an index mineral is called in isograd.The facies concept began to fade somewhat in the 1980s, particularly for the higher-grade metamorphic rocks, because of the development of quantitative techniques for P-T estimation. This serves as a valuable field tool for quick characterization of relative metamorphic grade.
Some metamorphic petrologists found it useful to extend the metamorphic facies concept one step further by a consideration of sequences or series of facies that occur within particular regions or terranes.
The basis of the facies series idea is that the peak metamorphic conditions within any region without special tectonic complexities tend to lie in a fairly narrow band in the P-T plane, with gradually increasing P's as Ts, that is, a shallow positive slope.
The principal value of both facies series and metamorphic field gradients, as we will see, is to show graphically whether high Ts were achieved at shallow or great depths in a particular terrane.
Rate of Thermal Conduction: The rate of heat transfer or diffusion through any material.
In general, it is the density of packing of atoms in a material that controls the thermal conductivity. Solids conduct heat more rapidly than liquids which, in turn, conduct heat less rapidly than gases.
Metamorphic Evolution: Heating then uplift.
Subduction boundaries have High P from subduction and Low P where melts from subduction begin to rise to surface and plutonic style heating occurs.
525 Ma: Paleozoic closing of the so-called Iapetus Ocean or the Ancestral Atlantic) which creates the Appalachians. Episodic metamorphism and deformation throughout the entire Appalachian chain continued until the late Paleozoic, including the strong Acadian event at 420-370 ma and culminating in the Alleghenian event throughout the chain at 320-270ma.
325 Ma: Erosion of the Appalachians carries sand deposits to the 4 corners area of the US depositing massive sandstones. The 4 corners at the time were near shore in the tropics.
The concept of metamorphic facies grew out of the essentially simultaneous discoveries by Godschmidt in Norway and Eskola in Finland that rocks rigorously obey chemical laws during metamorphism. Metamorphic assemblages in specific rock compositions thus may serve as predictors of a relatively narrow range of pressure and temperature of formation. With facies series, Miyashiro extended this concept of metamorphic facies to include the idea that sequence or series of facies within particular regions reflected the relative pressures at which prograde metamorphism occurred.
Refinement of theories of thermal evolution during metamorphism has led to the prediction of actual P-T-t curves for metamorphism in different tectonic environments. Crustal thickening by repeated thrust faulting or sedimentary basin filling results in clockwise P-T paths with initial burial and compression ant anomalously low Ts, followed by passive heating at depth and finally by isostatic uplift, unroofing, and consequent cooling and decompression. This metamorphic cycle ultimately brings an individual metasedimentary or metavolcanic rock back to the surface where it started, but in a mineralogically transformed state. Where metamorphic heating has occurred through magmatic heat input, a reverse or ccw P-T path can occur, with development of high T at unusually shallow crustal depths. This latter pattern appears to be typical of many regional scale granulite-facies terranes.
_______________________________________________________________
Injection- Induced Earthquakes by Ellsworth
Ref: Ellsworth (2013). Injection- Induced Earthquakes.
It has long been understood that earthquakes can be induced by impoundment of reservoirs, surface and underground mining, withdrawal of fluids and gas from the subsurface, and injection of fluids into underground formations.
The application of hydraulic fracturing to tight shale formations is enabling the production of oil and gas from previously unproductive formations.
The injection of water under high pressure into impermeable basement rocks beneath Basel, Switzerland, to develop an enhanced geothermal system beneath the city induced four moment magnitude (Mw) 3 earthquakes in 2006 and 2007.
31 Dec, 2011: A Mw 4.0 earthquake occurs in Youngstown, OH, appearing to have been induced by injection of wastewater in a deep Underground Injection Control (UIC) class II well.
27 Feb, 2011: A Mw 4.7 earthquake occurs in central AR is linked to deep injection of wastewater.
11 Sep, 2011: A Mw 4.4 occurs near Snyder, TX, in an oil field where injection for secondary recovery has been inducing earthquakes for years.
10 Oct, 2011: A Mw 4.8 earthquake occurs near Fashing, TX, in a region where long-term production of gas has been linked to earthquake activity.
6 Nov, 2011: A Mw 5.7 earthquake occurs in central OK.
17 May, 2012: A Mw 4.9 earthquake occurs in east TX, where active wastewater-injection wells are located near their respective epicenters.
Earthquakes release stored elastic strain energy when a fault slips. A fault will remain locked as long as the applied shear stress is less than the strength of the contact. The failure condition to initiate rupture is usually expressed in terms of the effective stress tcrit = m(sn – P) + to, where the critical shear stress tcrit equals the product of the coefficient of friction m and the effective normal stress given by the difference between the applied normal stress (sn) and the pore pressure (P).
For almost all rock types, m lies between 0.6 and 1.0, and the cohesive strength of the sliding surface, to, is negligible under typical crustal conditions. Increasing the shear stress, reducing the normal stress, and/or elevating the pore pressure can bring the fault to failure, triggering the nucleation of the earthquake
Depending on the local stress state, hydraulically conductive fractures may be induced to fail in shear before P = s3.
The industrial process of hydraulic fracturing involves the controlled injection of fluid under pressure to create tensile fractures, thereby increasing the permeability of rock formations
Studies revealed a clear temporal correlation between fracking operations in a nearby well and the seismic activity.
The investigation into the cause of these events by the BC Oil and Gas Commission concluded that the events “were caused by fluid injection during hydraulic fracturing in proximity of pre-existing faults.”
Fracture pressure was quickly communicated through hydraulically conductive pathways and induced slip on critically stressed faults via reduction of the effective normal stress.
The principal seismic hazard from injection-induced earthquakes comes from those associated with disposal of wastewater into deep strata or basement formations
Unprecedented levels of seismicity have also been seen in the Barnett Shale in north central TX, where commercial development of shale gas was pioneered. Since development began in late 1998, nine earthquakes of M ≥ 3 occurred, compared with none in the preceding 25 years.
Rocky Mountain Arsenal In 1961, a deep injection well was drilled at the Rocky Mountain Arsenal (RMA) northeast of Denver, Colorado, to dispose of hazardous chemicals produced at this defense plant (30). Within several months of the start of routine injection in the 3.6-km-deep well in March 1962, residents of the northeastern Denver area began to report earthquakes, and events registered on two nearby seismic stations. Between the start of injection and its termination in February 1966, a total of 13 earthquakes with body wave magnitudes (mb) 4 and larger occurred. The following year, the three largest of the Denver earthquakes occurred, including the Mw 4.8 event on 9 August 1967 that caused minor structural damage near the epicenter.
The Paradox Valley experience illustrates how long-term, high-volume injection can lead to the continued expansion of the seismically activated region and the triggering of large-magnitude events many kilometers from the injection well more than 15 years after observation of the initial seismic response. This case study also illustrates the challenges for managing the risk once seismicity has been induced.
Risk is the product of the hazard, exposure, and vulnerability.
Ignorance of the things that we understand we should know but do not leaves us vulnerable to the unintended consequences of our actions.
The seismic response might not take place immediately, and decades may elapse before a damaging event occurs, as illustrated by the recent Paradox Valley.
The fact that the great majority of UIC class II injection wells in the US appear to be aseismic, at least for earthquakes Mw > 3, suggests that ambient conditions in geologic formations commonly approved for disposal are far enough removed from failure that injection can be done with low risk, provided that the pressure perturbation remains confined within the intended formation.
One approach for managing the risk of injection-induced earthquakes involves setting seismic activity thresholds that prompt a reduction in injection rate or pressure or, if seismic activity increases, further suspension of injection
Daily reporting of volumes, peak, and mean injection pressures would be a step in the right direction, as would measurement of the pre-injection formation pressure.
_______________________________________________________________
The Denver Earthquake by Healy
Ref: Healy et al (27 Sep, 1968). The Denver Earthquakes. Science, New Series, Vol. 161, No. 3848.
1961: A Deep Disposal Well is completed to a depth of 3167m through predominantly sedimentary rock for the disposal of waste fluids from chemical manufacturing operations at US Army’s Rocky Mountain Arsenal.
8 Mar, 1962 - 30 Sep, 1963: The US Army injects ~21M liters per month into the well.
Aug, 1964 - 6 Apr, 1965: The US Army injects ~7.5M liters per month into the well.
20 Feb, 1966:The US Army ends fluid Injection.
Increasing the pore pressure in the reservoir rock to 389 bar by means of fluid injection reduced the frictional resistance to fracture by about 69 bars and initiated the earthquake sequence.
_______________________________________________________________
Orogenesis and Deep Crustal Structure by Benioff
Ref: Hugo Benioff (May, 1954). Orogenesis and Deep Crustal Structure. Bulletin of the Geological Society of America, Vol. 65.
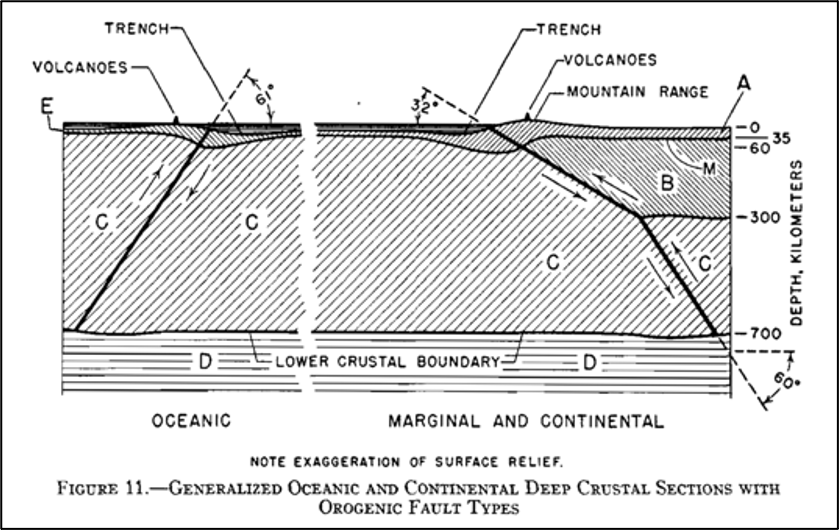
Continents extend downwards to an average depth of 280km.
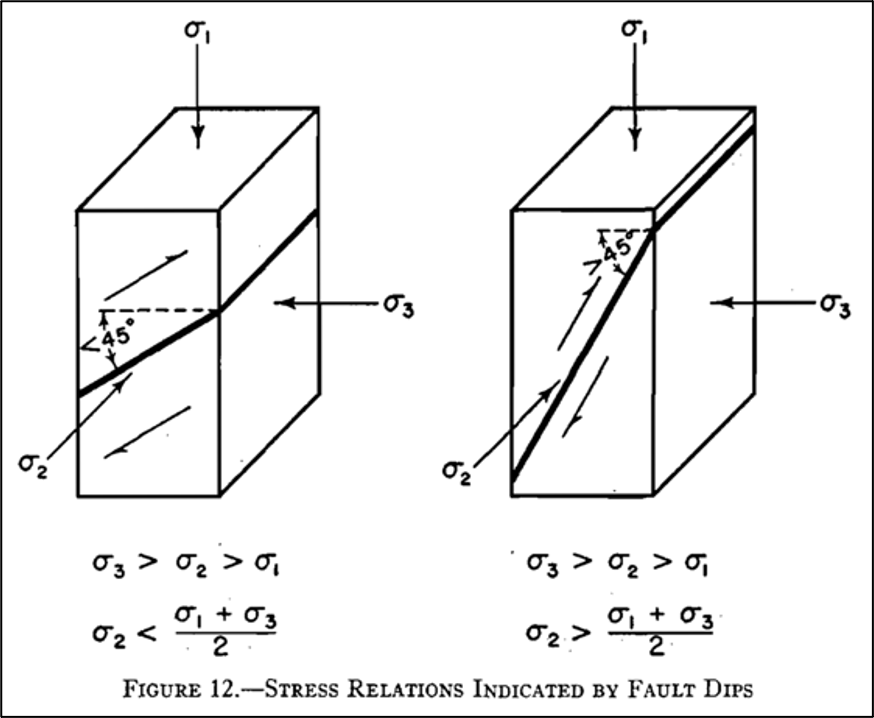
A reverse slip may thus be evidence for decline in the life of an orogenic fault.
Reverse and thrust faulting causes orogenesis and uplift and melting at the X boundary causes volcanism.
In general, the volcano line coincides with the highest elevation of the overhanging fault block and thus appears to be situated along the line of maximum bending of the block.
The region of most intense heat generation should coincide with the regions of most intense bending—the highest elevations of the overhanging block and the lowest depths of the neighboring trenches. The low incidence of volcanoes in the trenches may be ascribable to a higher melting point induced by the increased pressure and to the fact that the trench (in the form of a syncline) is not so effective a structure for concentration of the molten rock as the complementary anticline of the uplifted block on the upper side of the fault.
_______________________________________________________________
Integrated Geological Resource Management for Public Lands by Doss
Ref: Paul Doss (Oct, 2008). Integrated Geological Resources Management for Public Lands: A Template from Yellowstone National Park. GSA Today.
The NPS is charged to allow geologic processes to proceed unimpeded.
The Wilderness Act of 1964 states that geologic features of scientific, educational, scenic, or historical value may be a defining attribute of wilderness areas. The National Environmental Policy Act of 1969 (NEPA), the basic national charter for environmental protection, is the policy of the federal government to “preserve important historic, cultural, and natural aspects of our national heritage.” The Federal Cave Resources Protection Act of 1988 preserves significant caves on federal lands for use in scientific, educational, and recreational pursuits. The Federal Water Pollution Control Act (Clean Water Act of 1972) is designed to “restore and maintain the chemical, physical, and biological integrity of the Nation’s waters.” The NPS obtains and uses water for park purposes under the Reserved Water Rights and Prior Appropriation Doctrines. The Geothermal Steam Act of 1970 prohibits leasing of federally owned geothermal resources in all units of the National Park System, and the 1988 amendments to the act dictate that the “Secretary shall maintain a list of significant thermal features” and “shall maintain a monitoring program for significant thermal features.” Where paleontological resources occur in an archaeological context, the Archaeological Resources Protection Act of 1979 provides protection.
Role of Geological Resource Management: Inventory & Monitoring, Hazard Mitigation, Resource Protection.
_______________________________________________________________
Rediscovering a Sense of Wonder: Geoheritage, Geotourism, and Cultural Landscape Experiences by Gordon
Ref: John Gordon (20 Jan, 2011). Rediscovering a Sense of Wonder: Geoheritage, Geotourism, and Cultural Landscape Experiences. Geoheritage.
This article examines the links between geodiversity, landscape, literature, art and geotourism in Scotland using historical case studies from the Falls of Clyde and Staffa, and modern case studies from the North West Highlands Geopark and the Dumfries and Galloway area.
1807: Formation of the Geological Society of London (Gordon, 2011).
From a geoconservation perspective, therefore, if people have a deeper awareness and connection with their geoheritage through more meaningful and memorable experiences, they are more likely to value it and help to manage it sustainably.
I suggest three particular challenges for the geoconservation community to communicate that poetic vision: & to develop a new creativity linking geodiversity and cultural landscapes & to find new, experiential ways of interpreting the landscape and communicating its geological stories, not simply presenting information and & to offer new experiences in diverse and memorable ways to enable people to rediscover a sense of wonder about their geological heritage
Geoheritage and Geoconservation are concerned with the preservation of Earth Science Features.
_______________________________________________________________
Geoheritage and Geoconservation by Brocx & Semeniuk
Ref: Brocx & Semeniuk (Aug, 2006). Geoheritage and Geoconservation- History, Definition, Scope, and Scale. Journal of the Royal Society of Western Australia, 90.
Geoheritage encompasses global, national, state-wide, and local features of geology, at all scales that are intrinsically important sites or culturally important sites offering information or insights into the evolution of the Earth; or into the history of science, or that can be used for research, teaching, or reference. As geoheritage focuses on features that are geological, the scope and scale of what constitutes Geology, such as its igneous, metamorphic, sedimentary, stratigraphic, structural.
Geoconservation is the preservation of Earth Science features for purposes of heritage, science, or education.
_______________________________________________________________
Paleoclimatology by Riebeek
Ref: Holli Riebeek (28 Jun, 2005). Paleoclimatology. From: https://earthobservatory.nasa.gov/features/Paleoclimatology/paleoclimatology_intro.php.
I am ready to demonstrate this fact to incredulous people by the obvious proof.
Agassiz coined the term ice age after concurring with evidence of previous Ice Ages.
24 Jul, 1837: Agassiz presents the idea of Ice Ages at a meeting of the Swiss Society. He was met with rage and his ideas were not accepted until the 1870s (Riebeek, 2005).
1895: Svante Arrhenius, looking to understand Ice Ages, proposes the idea that a drop in temperatures could have been produced by a drop in the concentration of atmospheric CO2. He also proposes that industrial emissions could raise Earth’s temperature (Riebeek, 2005).
Evidence of Ice Ages: Loess deposits, Glacial Striations.
The cross section of a stalagmite reveals a sequence of layers, laid down over time. Researchers determine the age of the rings using Uranium-Thorium radioisotopic dating, and examine ring thickness and oxygen isotopes to determine past climate.
Since caves exist all over the Earth, speleothems have the potential to become a pivotal land-based climate record.
Year after year, a steady rain of dust, plants, and animal skeletons settles on the ocean floor. As new materials pile on top of old materials, layers of sediment form a vertical timeline extending millions of years into the past.
The most valuable fossils found in sediment cores are from tiny animals with a CaCO3 shell, called foraminifera. The CaCO3 shells of foraminifera and coccoliths (their plant counterparts), and the SiO2 shells of radiolarians (animals) and diatoms (tiny plants) all contain O. O in sea water comes in two important varieties for paleoclimate research: heavy and light. The ratio of these different types of oxygen in the shells can reveal how cold the ocean was and how much ice existed at the time the shell formed. In general, the shells contain more heavy O when ocean waters are cold and ice covers the Earth.
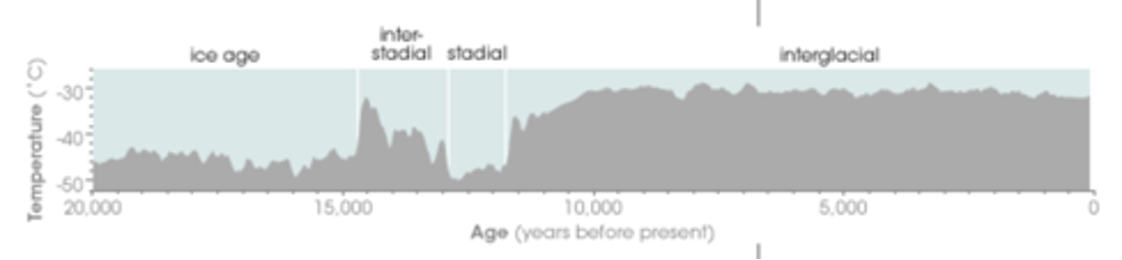
1970s: CLIMAP allows scientists to reconstruct the climate of the Earth in the last Ice Age 20,000 years ago.
The ice cores can provide an annual record of temperature, precipitation, atmospheric composition, volcanic activity, and wind patterns. In a general sense, the thickness of each annual layer tells how much snow accumulated at that location during the year.
In snow, colder temperatures result in higher concentrations of light O.
Use of Air Bubbles in Ice to assess CO2 levels (which are higher than at any time in the last 400,000 years.
Records of methane levels, for example, indicate how much of the Earth wetlands covered because the abundance of life in wetlands gives rise to anaerobic bacteria that release methane as they decompose organic material.
The article can almost entirely be summed up here: ice cores have proven to be one of the most valuable climate records to date, they only provide direct evidence about temperature and rainfall where ice still exists, though they hint at global conditions. Marine sediment cores cover a broader area—nearly 70% of the Earth is covered in oceans—but they only give tiny hints about the climate over the land. Soil and rocks on the Earth’s surface reveal the advance and retreat of glaciers over the land surface, and fossilized pollen traces out rough boundaries of where the climate conditions were right for different species of plants and trees to live. Unique water and rock formations in caves harbor a climate record of their own.
Cool water rising from the ocean floor brings extra nutrients in many areas, so the shells are often thicker when the water is cool.
Both more rain and higher temperatures result in a higher concentration of light O in the ocean.
1930: Milankovitch publishes Mathematical Climatology and the Astronomical Theory of Climate Change theorizing the ice ages occurred when orbital variations caused the Northern Hemisphere around the latitude of the Hudson Bay and northern Europe to receive less sunshine in the summer. Short, cool summers failed to melt all of the winter’s snow. The snow would slowly accumulate from year to year, and its shiny, white surface would reflect more radiation back into space. Temperatures would drop even further, and eventually, an ice age would be in full swing. Based on the orbital variations, Milankovitch predicted that the ice ages would peak every 100,000 and 41,000 years, with additional “blips” every 19,000 to 23,000 years (Riebeek, 2005).
When scientists started to analyze the paleoclimate evidence in the Greenland and Antarctic ice cores, they found that the record also supported Milankovitch’s theory of when ice ages should occur. But they also found something that required additional explanation: some climate change appeared to have occurred very rapidly. Because Milankovitch’s theory tied climate change to the slow and regular variations in Earth’s orbit, the scientific community expected that climate change would also be slow and gradual. But the ice cores showed that while it took nearly 10,000 years for the Earth to totally emerge from the last ice age and warm to today’s balmy climate, one-third to one-half of the warming—about 15 degrees Fahrenheit—occurred in about 10 years, at least in Greenland. A closer look at marine sediments confirmed this finding. Although the overall timing of the ice ages was clearly tied to variations in the Earth’s orbit, other factors must have contributed to climate change as well. Something else made temperatures change very quickly, but what?
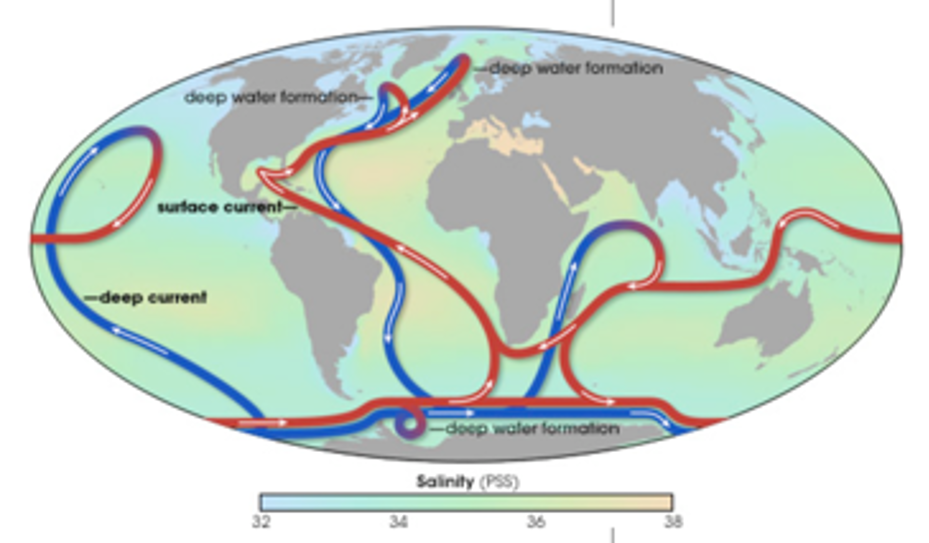
The key to keeping the belt moving is the saltiness of the water, which increases the water’s density and causes it to sink. Many scientists believe that if too much fresh water enters the ocean, for example, from melting Arctic glaciers and sea ice, the water will be diluted. Fresh water freezes at a higher temperature than salty water, so the cooling surface water would freeze before it could become dense enough to sink toward the bottom. If the water in the north does not sink, the water at the equator will not move north to replace it. The currents would eventually stop moving warm water northward, leaving Northern Europe cold and dry within a single decade.
The most sophisticated models might represent the Earth as a 3d grid with the atmosphere split into ten different grid layers each containing 65,000 reference points. Scientists might have the computer model calculate what the effect of increasing CO2 and air pollution would be at each of those 65,000 reference points.
1650 & 1710: Maunder Minimum; the sun is relatively quiet, bombarding Earth with fewer UV rays than normal. Decreases in the amount of UV energy hammering the Earth change the stratosphere by decreasing the amount of ozone that is produced (Riebeek, 2005).
“Light” oxygen-16, with 8 protons and 8 neutrons, is the most common isotope found in nature, followed by much lesser amounts of “heavy” oxygen-18, with 8 protons and 10 neutrons. Evaporation and condensation are the two processes that most influence the ratio of heavy oxygen to light oxygen in the oceans.
Water molecules containing light oxygen evaporate slightly more readily than water molecules containing a heavy oxygen atom. At the same time, water vapor molecules containing the heavy variety of oxygen condense more readily.
Higher-than-standard global concentrations of light oxygen in ocean water indicate that global temperatures have warmed, resulting in less global ice cover and less saline water.
In polar ice cores, the measurement is relatively simple: less heavy oxygen in the frozen water means that temperatures were cooler.
_______________________________________________________________
Principles of Isotope Geology by Faure
Ref: Gunter Faure (1976). Principles of Isotope Geology, 2nd Edition.
1650: Bishop Usher proclaims that the creation of the world took place in 4004 BCE (Faure, 1976).
1785: Hutton presents the theory of Uniformitarianism in his book “Theory of the Earth.” His principal point was that geological processes occurring now have shaped the history of the Earth in the past and would continue to do so in the future (Faure, 1976).
1830: Charles Lyell published the first volumes of his “Principles of Geology” (Faure, 1976).
1903: Curie and Laborde demonstrate that radioactive decay is an exothermic process (Faure, 1976).
1903: Polish Psychists Marie Curie, her husband French Physicist Pierre Curie, and Henri Becquerel share the Nobel Prize for physics for the discovery of radioactivity (Faure, 1976).
1911: Marie Curie receives the Nobel prize in chemistry in recognition of her successful efforts to isolate pure Radium (Faure, 1976).
1919: Rutherford attributes the positive charge of the nucleus to protons (Faure, 1976).
1920: Rutherford speculates that the nuclei of atoms might contain a neutral particle (Faure, 1976).
1940’s: Urey proposes the possibility that the stable isotopes of O may be fractionated by natural processes. He suggested that fractionation might occur during the formation of CaCO3 in the oceans and that the extent of fractionation depends on the temperature (Faure, 1976).
_______________________________________________________________
Environmental Policy, New Direction for the 21c by Weber
Ref: Weber et al (2016). Environmental Policy, New Directions for the twenty-first century, 9th Edition.
Proponents of green energy typically include environmental and climate change advocates, industries with low energy needs, public sector unions, political liberals and Democrats. Their focus is on the negative “social,” or health and environmental, costs of fossil fuels (which are largely externalized), the long-term benefits from weaning society off carbon-based fuels, and the expectation that green energy costs will eventually become competitively priced, particularly as technological innovation continues apace and once the true social costs of carbon are factored into the equation.
Energy Policy Approaches
Seek out and remove barriers to exploiting available energy resources.
Demand management and reduction.
Use of policy to reduce demand, increase efficiency and conservation.
Cost analysis- seek efficiency and conservation via pricing analysis.
Corporate subsidies for energy development and new energy technologies.
Regulatory incentives to lower C emissions.
Raise the cost of nonrenewable and lower the cost of green energy.
Carbon Taxes, Emissions Trading, Tax Credits.
The US is the only country in which surface property rights also include the rights to subsurface mineral deposits, including hydrocarbons.
Bureau of Ocean Energy Management (BOEM): Responsible for US offshore energy production; replaced the Minerals Management Service.
Energy Types
Shale Gas: Currently accounts for 23% of US natural gas production; projected to increase to 49% by 2035.
Solar PV: Requires 6-8 acres for every MW of power.
Concentrating Solar Power (CSP): Uses mirrors to focus solar energy onto a boiler that heats water and spins a turbine, requires even more space than solar PV. CSP typically requires 600-650 gallons of water to generate steam for every MWh produced.
Ivanpah CSP: Located in the Mojave Desert; uses ~3,500 acres of land (5.5 sqmi) to produce 370 MW of power.
Coal Plant: Requires <1 acre per MW of power.
Oil Sands: Deposits of oil, sand, and water. Requires a price of ~$50 per barrel to be considered economically recoverable. Alberta, Canada has an oil sand reserve of ~170B, second only to Saudi Arabia. With the expected doubling of the production level by 2020 to >3M barrels per day, the oil sands would produce more than Venezuela, Nigeria, or Iraq, and supply the equivalent of nearly 20% of US oil consumption. The expansion plans are the reason behind TransCanada’s proposed 1700 mile, 800,000-barrel-per-day, highly contested Keystone XL pipeline to the US.
Chronology
1970: The USG passes the National Environmental Policy Act, requiring the preparation of environmental impact assessments prior to drilling on federal lands (Weber, 2016).
1972: The USG passes the Clean Water Act (CWA) (Weber, 2016).
1974: The USG passes the Safe Drinking Water Act (SDWA), requiring the EPA to regulate underground fluid injection and banning the injection of hazardous materials, but exempting hydraulic fracking (Weber, 2016).
1980: The USG passes the Comprehensive Environmental Response, Compensation, and Liability Act (CERCLA) to regulate hazardous chemicals (Weber, 2016).
1992: The USG passes the Energy Policy Act, providing a tax credit of 2.3 cents per kWh to renewable energy generators in order to make renewables more competitive with natural gas and coal (Weber, 2016).
2005: The USG passes the Energy Policy Act, offering grants, loans, and tax credits to firms developing renewable energy and “green” technologies such as solar panels, zero emission vehicles, and hybrid cars. The act included the “Halliburton Loophole”, sealing an exemption for fracking industries from EPA oversight (Weber, 2016).
2007: SCOTUS decides the USEPA can regulate GHGs (Weber, 2016).
2007: SCOTUS argues Massachusetts v. EPA, deciding that CO2 is a pollutant covered under the Clean Air Act (CAA) (Weber, 2016).
2009: The USG under POTUS Obama pass the American Recovery and Reinvestment Act, dramatically expanding government subsidies for renewable energy development. Over three years, the Treasury awards $9B in “1603” grants to small and startup green energy companies, which accounted for 50% of the total non-hydropower renewables capacity added between 2009 and 2011 (Weber, 2016).
_______________________________________________________________
The Road to Yucca by Walker
Ref: Samuel Walker (2009). The Road to Yucca Mountain, the Development of Radioactive Waste Policy in the United States.
Issue: Uninformed Populace, Mass Hysteria.
Nuclear Waste Storage Methods
Concentrate, shield, and store.
Dilute and Disperse.
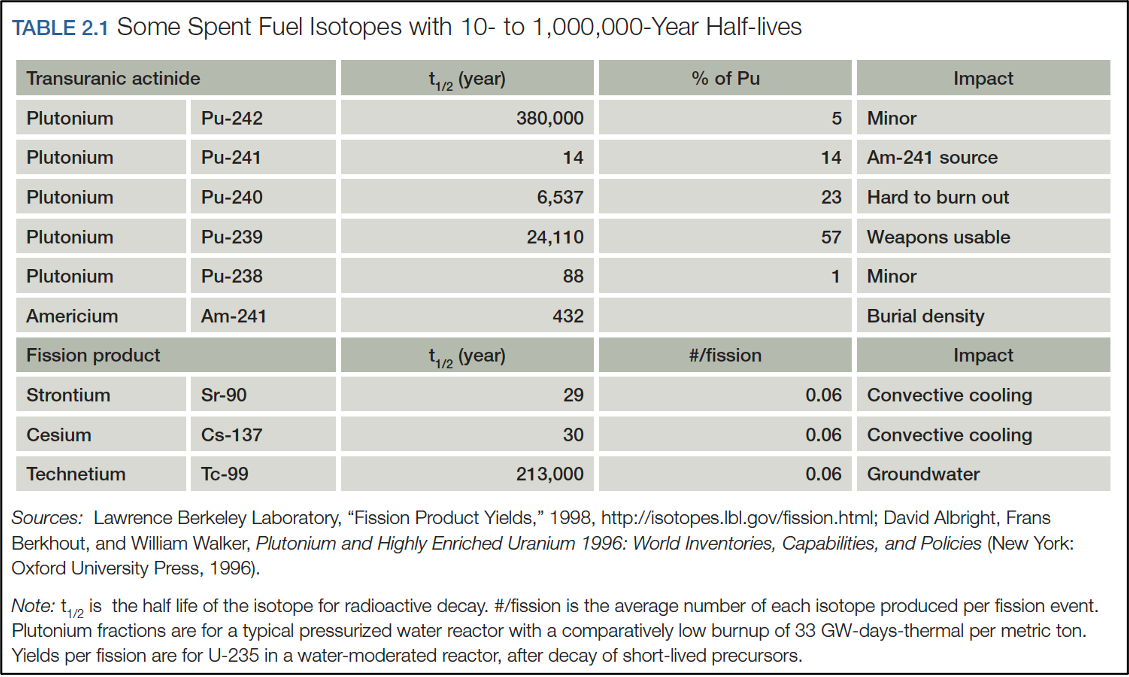
Hazardous Nuclear Waste Byproducts: Cs-137 (1/2 = 30y), St-90 (1/2 39 yr).
Intensity is inversely proportional to the half-life.
The AEC’s oft-repeated concern about “hysteria” was far out of proportion to existing public attitudes, and its abridged candor undermined public confidence over the long run.
1955: The AEC takes an initial step to determine the best method to dispose of high-level wastes by requesting that the National Academy of Sciences establish a committee on waste disposal within its Division of Earth Sciences. In a series of seminars, representatives of the AEC and the USGS, industry officials, and prominent individual scientists shared knowledge and exchanged opinions.
Apr, 1957: The AEC’s final report declares that “radioactive waste can be disposed of in a variety of ways and at a large number of sites in the United States.”
In the judgment of the Committee on Waste Disposal, the most promising approach for permanent disposal of high-level liquid wastes was to place them in salt formations. The greatest advantage of this method was that large salt deposits occur in dry geologic surroundings, and the absence of water would prevent liquid wastes from migrating to other locations. Further, fissures in salt formations, unlike those in clay, shale, or granite quarries, would be “self-sealing,” thus avoiding leakage. The two principal areas in the US with large salt deposits, the northcentral states and the southern states along the Gulf Coast, had low seismic activity and were level enough to facilitate underground access.
In response to the “ strong public objection,” the AEC turned to land burial of solid low-level wastes generated by its licensees, which was both less controversial and considerably cheaper than ocean disposal.
_______________________________________________________________
Plan D for Spent Nuclear Fuel by Ewing
Ref: Ewing et al (2009). Plan D for Spent Nuclear Fuel.
US Nuclear Waste Policy Act of 1982
Set up regulated escrow funds for utilities to draw on to meet the costs of on-site management of aged spent nuclear fuel in dry casks.
Explicitly allow shipment of spent fuel from one utility to another utility’s operating nuclear reactor site in the same state.
Provide a financial incentive for states to agree to have spent fuel shipped from an inoperative reactor site in one state to an operating reactor site in a neighboring state.
Require any licensed spent fuel reprocessing facility to be licensed as well for possible continuing on-site storage of any spent fuel intake and of all reprocessing product streams.
Should the federal government not succeed in licensing long-term spent fuel management facilities in a timely manner, consider turning this task over to a tightly regulated corporation set up for this purpose.
Allow states to require that they receive substantially larger financial incentives for cooperating on hosting long-term spent nuclear fuel management facilities. Transferring nuclear waste management payments into a permanent fund set up to insure such a facility and allowing a state to tap interest earnings on that fund is one possible approach.
Consider licensing long-term management facilities for taking in spent fuel produced at many different reactor sites, but not utilizing such facilities until it becomes clear that it is more economically advantageous to do so than to continue holding spent fuel in dry casks at operating reactor sites.
Options with Nuclear Waste
Breeding: Reprocess spent fuel for use in breeder reactors.
Prompt Deep Burial: Send spent fuel to a permanent deep burial facility.
Actinide Burial.
Holding in Dry Casks.
Eliminate.
Nuclear Waste Today
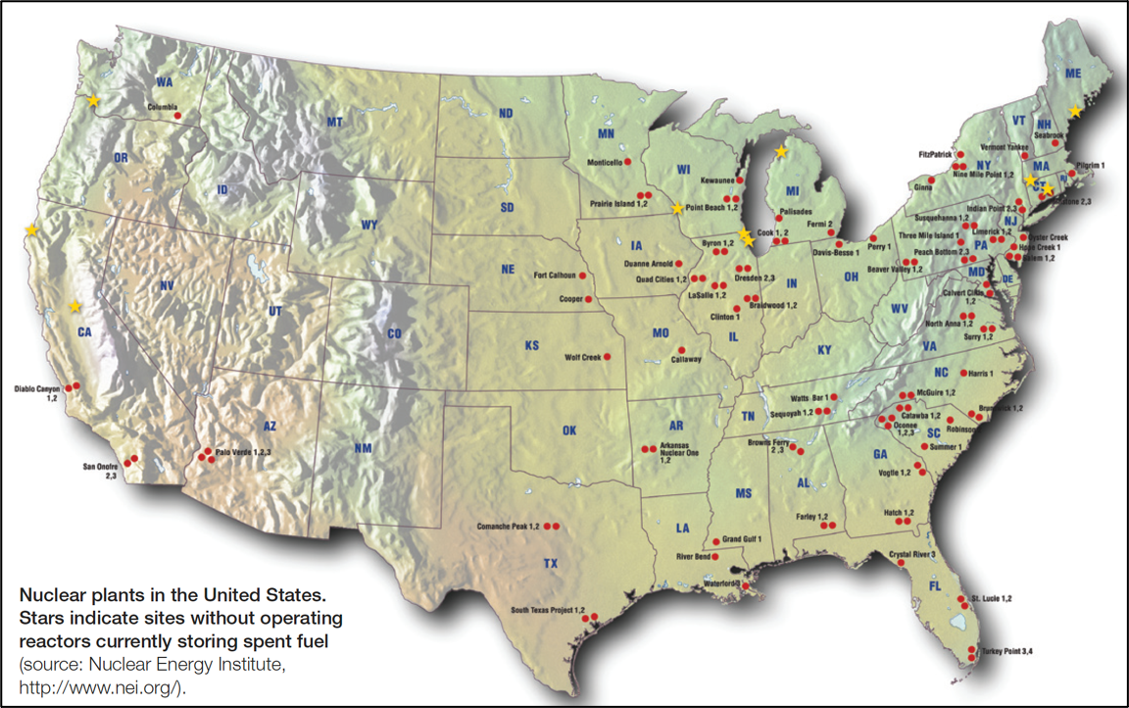
Spent fuel sitting in open storage at reactor sites, even closed ones.
Plan D for US spent fuel produced at US nuclear reactors would normally consist of keeping the fuel on-site until the entire site is decommissioned. After decommission, the spent fuel would either be sent to another storage site, reprocessed to recover the remaining usable fuel, or buried under the assumption that it will probably never be reprocessed.
_______________________________________________________________
Managing Riverine Connectivity in Complex Landscapes to Protect 'Remnant Natural Areas by Pringle
Ref: Catherine Pringle (Nov, 2000). Managing Riverine Connectivity in Complex Landscapes to Protect 'Remnant Natural Areas.' Verhandlungen Proceedings Travaux, Congress in Dublin, 1998, Vol. 27, Part 3.
In this paper, I briefly review emerging environmental problems and associated biotic patterns that are resulting from alterations of riverine connectivity on regional and continental scales. This provides a foundation to examine the importance of managing riverine connectivity for the protection of remnant natural areas in human-dominated landscapes.
Alterations of riverine connectivity are manifested by four major and interrelated patterns or trends of biotic impoverishment in human dominated landscapes throughout the world:
1) Deterioration of lower catchments, deltas, estuaries, and receiving coastal waters.
2) Deterioration and loss of riverine floodplains, connecting wetlands, and riparian ecosystems.
3) Deterioration of irrigated lands and connecting surface and ground waters.
4) Isolation of headwater catchments.
Rivers have become a series of lakes connected by highly regulated flow regimes.
Deltas and coastal areas are often “sediment-starved”, leading to coastal erosion.
Rivers which flow into the Black or Azov Seas: their discharges have been reduced by about half, with salinities in estuaries and deltas increasing 4-fold and 10-fold, respectively.
Fisheries in the seas have been reduced by 90-98%.
Irrigation has dramatically changed the way that groundwater interacts with surface water and, as a result, it is increasingly becoming a major consideration in managing remnant natural areas. Water tables are falling on every continent including the southwestern United States, southern Europe, North Africa, the Middle East, Central Asia, southern Africa, the Indian subcontinent and in central and northern China.
Management solutions which are being pursued include:
Careful consideration of upstream water reallocation.
Agreements with upstream communities to extract water during high and intermediate flows and to allow compensation flows to be maintained during dry months.
Development of instream flow needs and water management strategies for each river flowing through the park.
Hydrological simulation of historical flows to determine how dams should be managed.
Construction of new dams to provide storage water for the park during dry periods.
Development of a new national water
The ecological value of water is determined by the establishment of instream water requirements for each river/wetland. This represents an ‘untouchable’ amount of water which is meant to keep the ecosystem functioning.
1976: The Caribbean National Forest is declared a Biosphere Reserve by UNESCOs Man and the Biosphere Programme (Pringle, 2000).
On an average day, more than 50% of the water that drains the Caribbean National Forest is diverted into municipal water supplies before it reaches the ocean.
Recommendations for mitigation of negative environmental effects caused by water abstraction from streams draining the Caribbean National Forest include:
3—5-h stoppages in water abstraction during peak nocturnal (i.e. post-dusk) larval drift.
Up-keep of functional fish ladders.
The maintenance of minimum flows over dams.
Evaluation of different types of water withdrawal systems.
Improving the efficiency of the municipal water supply distribution system.
Establishing instream flow requirements.
Geothermally contaminated waters contain high levels of soluble reactive phosphorus (up to 400 pg SRP L~‘)
Interbasin transfers of water are occurring through subterranean groundwater flow.
‘Large’ area is embedded in a matrix of burgeoning human populations - spanning several human cultures, national boundaries and changing political structures. Such situations demand that riverine connectivity be managed on a very large scale.
Questions include: (1) How do lateral, longitudinal, and vertical dimensions of riverine connectivity operate in different types of landscapes and how will alterations in connectivity affect remnant natural areas?
_______________________________________________________________
Threats to US Public Lands from Cumulative Hydrologic Alterations Outside of Their Boundaries by Pringle
Ref: Catherine Pringle (Aug, 2000). Threats to US Public Lands from Cumulative Hydrologic Alterations Outside of their Boundaries. Ecological Applications, Vol. 10, No 4.
Recommendations:
Establishment of more stream gaging stations and monitoring programs within and adjacent to public lands.
Development of new and innovative partnerships between federal land management agencies and both federal and academic scientists.
Interdisciplinary research and development of science-based tools to predict cumulative and interactive effects of hydrologic alterations.
Synergism between frontline field managers and scientists in identifying threats to ecological values and in implementing localized solutions.
The necessity of evaluating cumulative, long-term effects of hydrologic alterations outside the boundaries of public lands.
The need for developing more proactive management and policy strategies that are effective outside public land boundaries.
Legal and administrative tools must be strengthened to protect public lands from hydrological modifications and pollution outside of their boundaries.
More stream gaging stations and monitoring programs need
Long-term discharge data is integral to stream monitoring programs and to the development of strategies to mitigate effects of hydrological modifications such as dams and water withdrawal.
The USGS minimum 10-yr record length which is necessary to support a statistically reliable flow analysis.
Cooperative relationship between federal agencies and nongovernmental environmental groups.
Humans have already appropriated half of the accessible global freshwater runoff, and conservative estimates indicate that this appropriation could climb to 70% by the year 2025 (Postel et al. 1996).
Off- stream" water uses (e.g., for agriculture or municipal water supplies) typically end up controlling instream flow levels and ultimately fish, wildlife, and riparian ecosystems. Cumulative effects of dams, water impoundment, diversion, regulated flows, stream channelization, wetlands drainage, and groundwater extraction are often synergistic and they are increasingly altering the biological integrity of public lands.
Major goals:
Describe regional differences in the availability of fresh water, rates of human population growth, and the distribution of public lands in the US.
Summarize the general extent and magnitude of current pressures on water resources in those categories of public lands where there is a strong emphasis on managing aquatic ecosystems for environ- mental needs (i.e., national parks, national forests, and national wildlife refuge.
In eastern states, the use of water is governed by the Doctrine of Riparian Rights (largely imported from Great Britain), which is based on ownership of land adjacent to water bodies and "reasonableness" of water use (Williams 1992). In this case, the "water right" is a consequence of land ownership rather than a separate piece of property. In contrast, the right to use water in western states is predicated on the Doctrine of Prior Appropriation, which is based on diversion of water out of its natural course for beneficial use, and priority is determined by time of first use (Williams 1992).
Economic considerations often take precedence over management for environmental needs.
Two major challenges facing managers of freshwater resources on public lands in the future are drought and municipal growth.
Threats to public lands from developed areas outside of their boundaries include:
The production of hydroelectric power-especially "peaking power".
Surface water diversions.
Pollution from active and abandoned landfills, toxic dumps, inadequate septic and waste disposal systems, underground storage tanks, etc.
Contaminated runoff from agricultural, ranching, urban and residential areas.
Leachate from abandoned mining and drilling sites containing heavy metals, acids, and other hazardous chemicals.
Existing mines and potential development of mining claims and oil and gas drilling.
Accidental and/or deliberate spills during the storage, transportation, or use of chemicals, oil, and fuel.
Offshore drilling and transportation.
Runoff and deposition of sediment.
Acid deposition (NPCA 1993).
Introduction of exotic species.
The NPS established a "Water Rights Branch" of the Water Resources Division in 1984. The Water Rights Branch coordinates water management support activities among individual park system units using personnel specifically trained in water resource management (Williams 1992, Gillilan and Brown 1997). It is responsible for assisting park management with developing technical evidence to support water rights adjudication claims. To settle conflicts over the determination of water rights for federal water users such as the NPS, states are initiating and advancing water rights adjudications through the courts.
Conflicts for water usage between local communities and tourist complexes geared to off-island residents are aggravated by the fact that the dry season coincides with the tourist season.
1990 landmark federal legislation (the Water Settlement Act) was enacted to provide a mechanism for Stillwater National Wildlife Refuge to protect and stabilize its wetlands: at the direction of Congress, the federal government appropriated money to buy existing water rights to restore Stillwater (NRC 1992). This was the first time in history that the purchase of water rights for a national wildlife refuge was authorized by law.
In the absence of relevant scientific and technical data, environmental needs cannot be prioritized and long-term threats may not be identified; all too often, economic demands (i.e., human offstream water uses) supersede maintenance of fish and wildlife populations, healthy riparian habitat, and associated ecosystem services.
Management and policy must recognize that the flow pathways of surface and groundwater are interconnected along a continuum of geo-hydrologic units.
Scientists can play an important role in helping land managers relate to the public by explaining management decisions that relate to cross boundary hydrologic connections. They can also help in exploring management alternatives, communicating the implications of different management scenarios (e.g., Firth 1998, Lubchenco 1998, Pringle, 1999), and by framing conservation issues facing public lands in the context of economic consequences and human health.
My Notes:
Is the future going to be mega cities surrounded by mega farms with dry-arid dead zones in between?
It is imperative to view water resources as inter-state, inter-water features in a connected system.
Solution?: Water Rights Task Force to a) inventory of biological/natural/public lands/goods and their water requirements. b) Inventory of future water changes and future needs. c) then, Precipitation Total - Public Lands Needs - Buffer = total leftover for human use. Possibly even requiring population caps for certain areas.
Future Massive De-Sal Plants.
There must be a better way than purchasing water rights.
_______________________________________________________________
Climate Sensitivity, Seal Level, and Atmospheric Carbon Dioxide by Hansen
Ref: Hansen et al (2013). Climate Sensitivity, Sea Level and Atmospheric Carbon Dioxide. From: http://dx.doi.org/10.1098/rsta.2012.0294
It seems implausible that humanity will not alter its energy course as consequences of burning all fossil fuels become clearer. Yet strong evidence about the dangers of human-made climate change have so far had little effect (Eric Bond).
Pleistocene climate oscillations yield a fast-feedback climate sensitivity of 3 ± 1◦C for a 4Wm2 CO2 forcing.
Burning all fossil fuels would make most of the planet uninhabitable by humans, thus calling into question strategies that emphasize adaptation to climate change.
Human-made climate forcing is being imposed rapidly, with most of the current forcing having been added in just the past several decades. Thus, observed climate changes are only a partial response to the current climate forcing, with further response still ‘in the pipeline’.
Chronology: The principal dataset we use is the temporal variation of the oxygen isotope ratio (18O relative to 16O).
66.5-35 Ma: Earth is so warm that there is little ice on the planet (Hansen, 2013).
56 Ma: Paleocene-Eocene Thermal Maximum (PETM); warming increases 5 C conicident with injection of a likely 4-7 Tt of Carbon, most likely from ocean acidification and release/melting of methane hydrates on continental shelves. Additional sources include release of Carbon in Antarctice permafrost and peat. PETM was combined with Earth's orbit eccentricity and spin axis tilt (Hansen, 2013).
50 Ma: India collides with Asia causing global atmospheric CO2 to reach ~1000ppm with global average surface temperatures reaching 33 C. Over millions of years, much of the CO2 is deposited in the oceans bringing CO2 levels down to ~170ppm during recent glacial periods (Hansen, 2013).
34 Ma: Earth becomes cool enough for large-scale glaciation of Antarctica (Hansen, 2013).
15 Ma: Peak warming of Miocene (Hansen, 2013).
5-3 Ma: Growth of NH Ice Sheets (Hansen, 2013).
3 Ma: Mid Pliocene Warm Period (Hansen, 2013).
Atmospheric CO2, CH4 and N2O have varied almost synchronously with global temperature during the past 800,000 years for which precise data are available from ice cores, the GHGs providing an amplifying feedback that magnifies the climate change instigated by orbit perturbations.
We hypothesize that the global climate variations of the Cenozoic can be understood and analyzed via slow temporal changes in Earth’s energy balance, which is a function of solar irradiance, atmospheric composition (specifically long-lived GHGs) and planetary surface albedo.
Ice Sheet growth/retreat is not a function of hysteresis but rather a function of Temperature.
Climate Sensitivity, S= change Teq/F. (Teq= change in equilibrium global surface temperature).
We usually discuss climate sensitivity in terms of a global mean temperature response to a 4Wm−2 CO2 forcing.
Climate Forcing vs. Climate Feedback. The Earth’s average energy imbalance within each of these periods had to be a small fraction of 1Wm−2. Such a planetary energy imbalance is very small compared with the boundary condition ‘forcings’, such as changed GHG amount and changed surface albedo that maintain the glacial-to-interglacial climate change.
The Earth escaped snowball conditions owing to limited weathering in that state, which allowed volcanic CO2 to accumulate in the atmosphere until there was enough CO2 for the high sensitivity to cause rapid deglaciation. Climate sensitivity at the other extreme, as the Earth becomes hotter, is also driven mainly by an H2O feedback. As climate forcing and temperature increase, the amount of water vapor in the air increases and clouds may change. Increased water vapor makes the atmosphere more opaque in the IR region that radiates the Earth’s heat to space, causing the radiation to emerge from higher colder layers, thus reducing the energy emitted to space.
That Venus had a primordial ocean, with most of the water subsequently lost to space, is confirmed by the present enrichment of deuterium over ordinary H by a factor of 100, the heavier deuterium being less efficient in escaping gravity to space.
The equilibrium response of the control run (1950 atmospheric composition, CO2 approx. 310 ppm) and runs with successive CO2 doublings and halving’s reveals that snowball Earth instability occurs just beyond three CO2 halving’s. Given that a CO2 doubling or halving is equivalent to a 2% change in solar irradiance and the estimate that solar irradiance was approximately 6% lower 600Ma at the most recent snowball Earth occurrence implies that about 300ppm CO2 or less was sufficiently small to initiate glaciation at that time.
In the real world, we would expect the Greenland and Antarctic ice sheets to be nearly eliminated and replaced by partially vegetated surfaces already at 2 × CO2 (620 ppm) equilibrium climate.
Earth today, with approximately 1.26x 1950 CO2, is far removed from the snowball state. Because of the increase in solar irradiance over the past 600 Myr and volcanic emissions, no feasible CO2 amount could take the Earth back to snowball conditions.
The practical concern for humanity is the high climate sensitivity and the eventual climate response that may be reached if all fossil fuels are burned. Estimates of the C content of all fossil fuel reservoirs including unconventional fossil fuels such as tar sands, tar shale and various gas reservoirs that can be tapped with developing technology imply that CO2 conceivably could reach a level as high as 16x the 1950 atmospheric amount. In that event, a global mean warming approaching 25◦C, with much larger warming at high latitudes. The result would be a planet on which humans could work and survive outdoors in the summer only in mountainous regions—and there they would need to contend with the fact that a moist stratosphere would have destroyed the ozone layer.
GHG and albedo feedbacks are both strong amplifying feedbacks, indeed accounting by themselves for most of the global Pleistocene climate variation.
The temporal variation of the GHG plus surface albedo climate forcing closely mimics the temporal variation of either the deep ocean temperature or Antarctic temperature for the entire 800,000 years of polar ice core data.
We have shown that global temperature change over the Cenozoic era is consistent with CO2 change being the climate forcing that drove the long-term climate change.
12Wm−2 greenhouse forcing, which we simulated with 8 × CO2. If non-CO2 GHGs such as N2O and CH4 increase with global warming at the same rate as in the paleoclimate record and atmospheric chemistry simulations, these other gases provide approximately 25% of the greenhouse forcing. The remaining 9Wm−2 forcing requires approximately 4.8 × CO2, corresponding to fossil fuel emissions as much as approximately 10,000 Gt C for a conservative assumption of a CO2 airborne fraction averaging one-third over the 1000 years following a peak emission. Our calculated global warming in this case is 16◦C, with warming at the poles approximately 30◦C. Calculated warming over land areas averages approximately 20◦C. Such temperatures would eliminate grain production in almost all agricultural regions in the world. Increased stratospheric water vapor would diminish the stratospheric ozone layer. More ominously, global warming of that magnitude would make most of the planet uninhabitable by humans. The human body generates about 100W of metabolic heat that must be carried away to maintain a core body temperature near 37◦C, which implies that sustained wet bulb temperatures above 35◦C can result in lethal hyperthermia.
We conclude that the large climate change from burning all fossil fuels would threaten the biological health and survival of humanity, making policies that rely substantially on adaptation inadequate.
Let us now verify that our assumed fossil fuel climate forcing of 9Wm−2 is feasible. If we assume that fossil fuel emissions increase by 3% per year, typical of the past decade and of the entire period since 1950, cumulative fossil fuel emissions will reach 10 000 Gt C in 118 years.
Are there sufficient fossil fuel reserves to yield 5000–10 000 Gt C? Recent updates of potential reserves, including unconventional fossil fuels (such as tar sands, tar shale and hydrofracking-derived shale gas) in addition to conventional oil, gas and coal, suggest that 5 × CO2 (1400 ppm) is indeed feasible. For instance, using the emission factor for coal from IPCC, coal resources given by the Global Energy Assessment amount to 7300– 11 000 Gt C. Similarly, using emission factors from IPCC, total recoverable fossil energy reserves and resources estimated by GEA are approximately 15 000 Gt C.
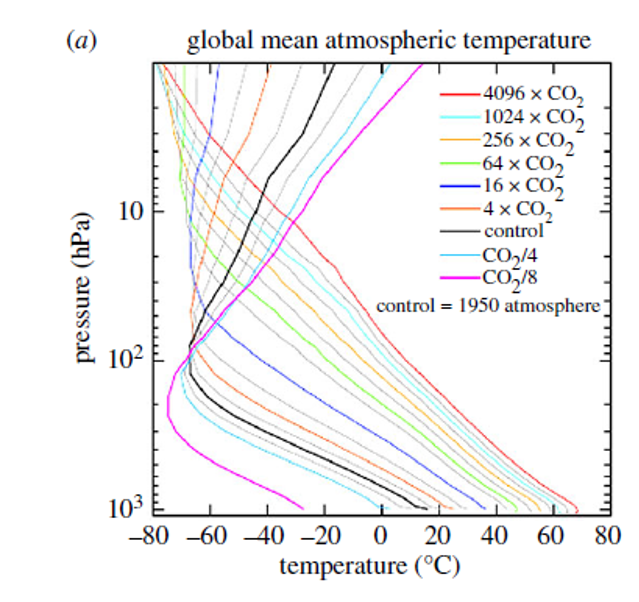
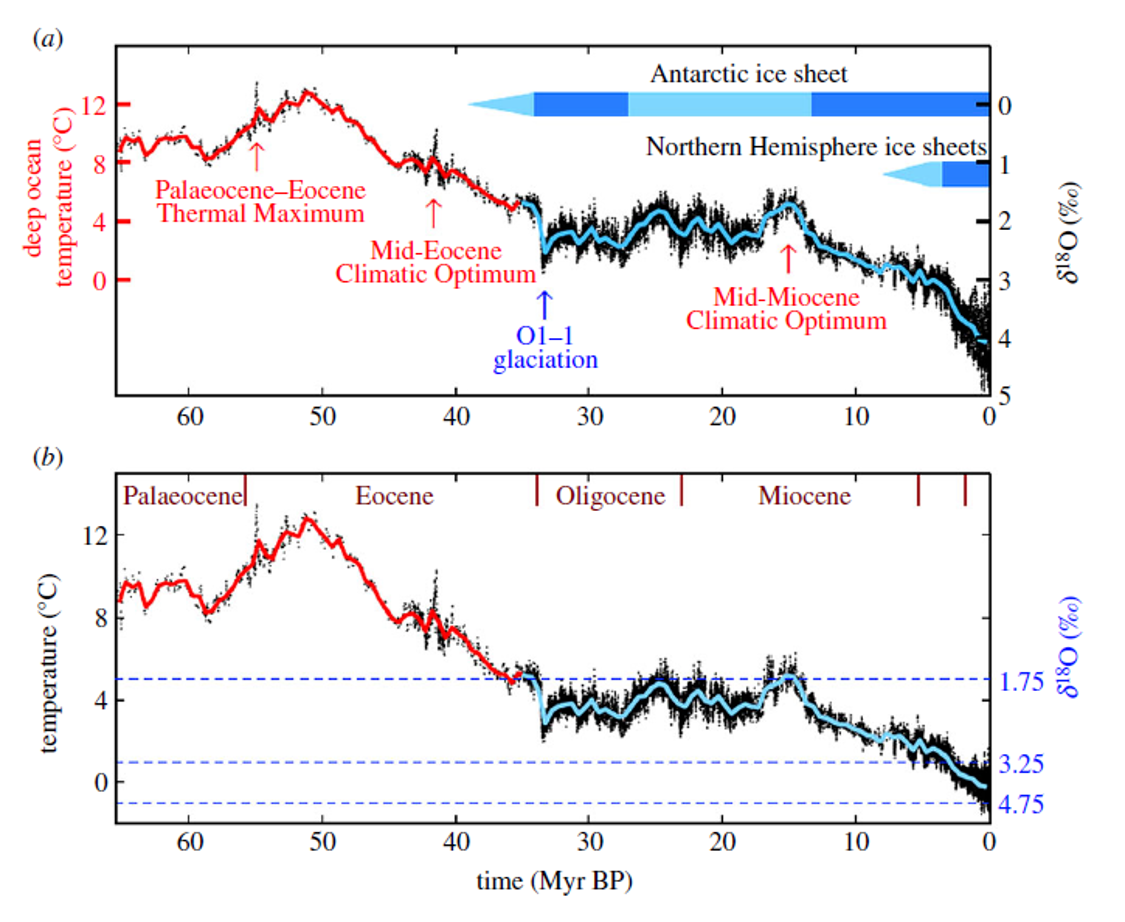
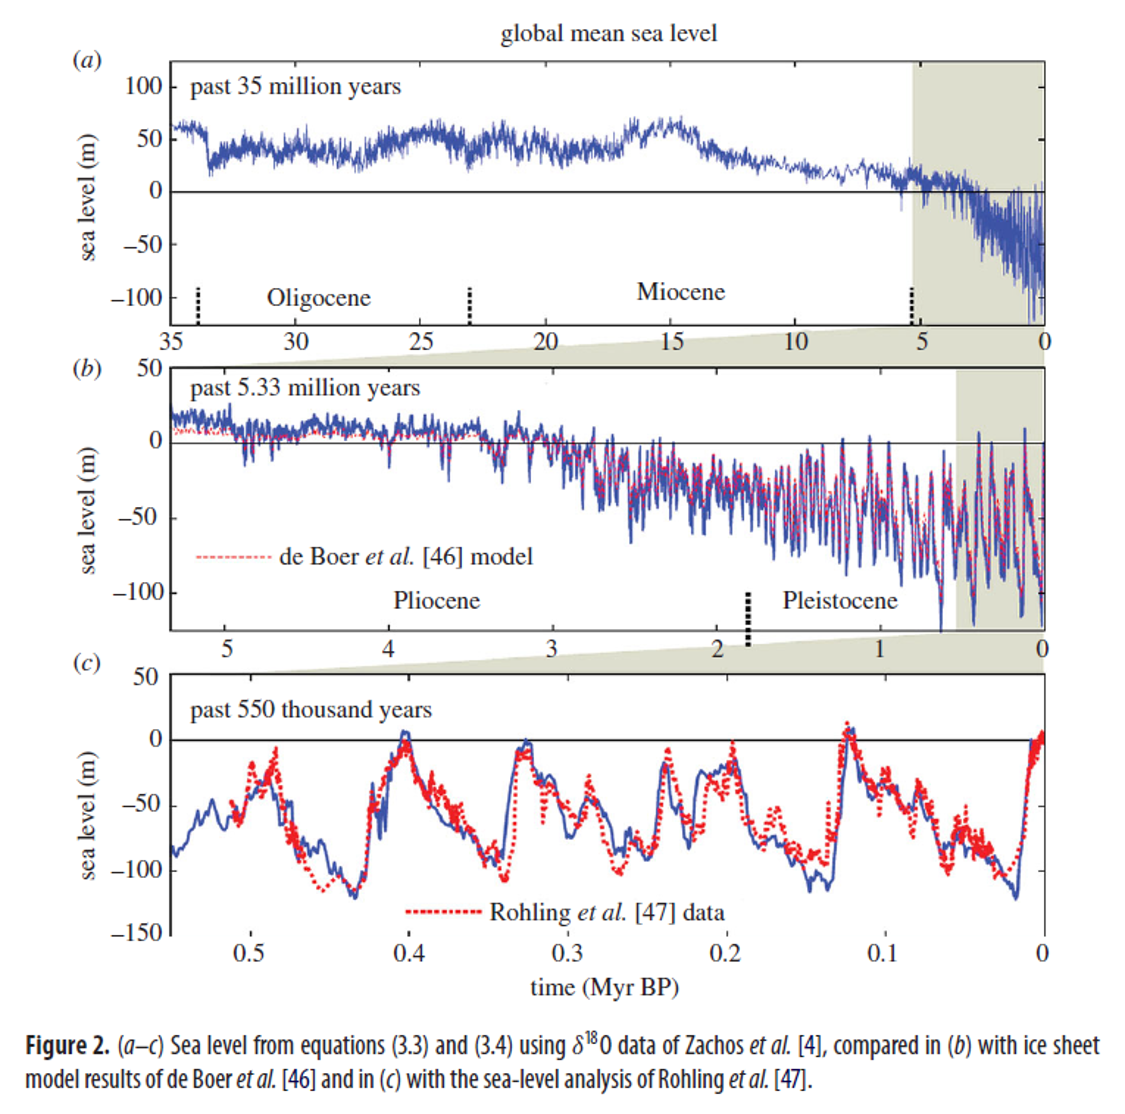
_______________________________________________________________
Warm Climates of the Past- A Lesson for the Future? by Lunt
Ref: Lunt et al (2013). Warm Climates of the Past- A Lesson for the Future? From: http://dx.doi.org/10.1098/rsta.2013.0146
How understanding past climates can aid us in understanding climate change today (uniformitarian principle).
Quantification of past CO2 levels and global temperature allows us to estimate the sensitivity of the climate system to a CO2 forcing (if it is assumed that it is the CO2 that is the primary driver of the temperature change).
The relationship between the forcing and the response of the Earth system is commonly expressed in the important metric ‘climate sensitivity’.
Global annual mean near-surface (1.5 m) air temperature (SAT) This can be defined in several ways, for example the global annual mean near-surface (1.5 m) air temperature (SAT) equilibrium response due to a doubling of atmospheric CO2 concentrations, or more generally as the SAT response to a prescribed radiative forcing, usually 1 or 4Wm−2 (4Wm−2 is close to the radiative forcing for a doubling of CO2, but has the advantage that the forcing is model-independent).
Climate = Initial Conditions + Forcing.
Methods of interpolating from the past: Quantitative Data, Qualitative Data, Modeling, Comparisons between them all, Analogues with little climate change for comparison or baselines.
_______________________________________________________________
An Early Cenozoic Perspective on GHG Warming and C-Cycle Dynamics by Zachos
Ref: Zachos, Dickens, & Zeebe (Jan, 2008). An Early Cenozoic Perspective on GHG Warming and C-cycle Dynamics. DOI: 10.1038, Nature Vol 451.
By the year 2400, it is predicted that humans will have released about 5,000 Gt C to the atmosphere since the start of the industrial revolution
Ocean surface warming and freshwater discharge at high latitudes could slow the exchange of shallow and deep water in the ocean, impeding both abiotic and biotic removal of anthropogenic carbon from the atmosphere.
53-51 Ma: Early Eocene Climatic Optimum (EECO); Earth’s CO2 and Temperatures reach a high (Zachos, 2008).
55 Ma: Paleocene–Eocene Thermal Maximum (PETM); global temperature increases by more than 5 °C in less than 10,000 years. At about the same time, more than 2,000 Gt C as CO2 — comparable in magnitude to that which could occur over the coming centuries — enter the atmosphere and ocean (Zachos, 2008).
The ocean is the primary carbon sink on moderate timescales (100– 1,000 years), so of the 5,000 Gt C that humans could emit into the atmosphere (between the onset of the industrial revolution and the year 2400), the ocean would probably absorb roughly 70% after 1,000 years. However, such C uptake depends on exchange between the thin and relatively warm surface layer that absorbs atmospheric CO2 and the much thicker and relatively cold deep-ocean reservoir that can store large amounts of carbon. As the small surface reservoir takes up CO2, its pH decreases, slowing the additional absorption of CO2. To prevent the surface layer from becoming oversaturated, carbon must be shuttled quickly to the thermally isolated deep reservoir through advection (deep-ocean convection) or through the sinking of dead organisms (the biological pump). Unfortunately, rapid warming may compromise both processes. Warming and freshening of high-latitude surface water can slow the rate of convective overturning, and increased thermal stratification makes it more difficult for wind-driven mixing to return nutrients from the deep ocean to organisms in the photic zone.
If fossil-fuel emissions continue unabated, in less than 300 years pCO2 will reach about 1,800 p.p.m.v., a level not present on Earth for roughly 50M years.
Foremost among the challenges that must be overcome to achieve this goal is the development of a deeper understanding of the complex interactions that link the climate system with the biogeochemical cycles, specifically the role of positive and negative feedbacks.
Efforts to comprehend the underlying physics and biogeochemistry of the coupling between climate and the carbon cycle should be hastened.
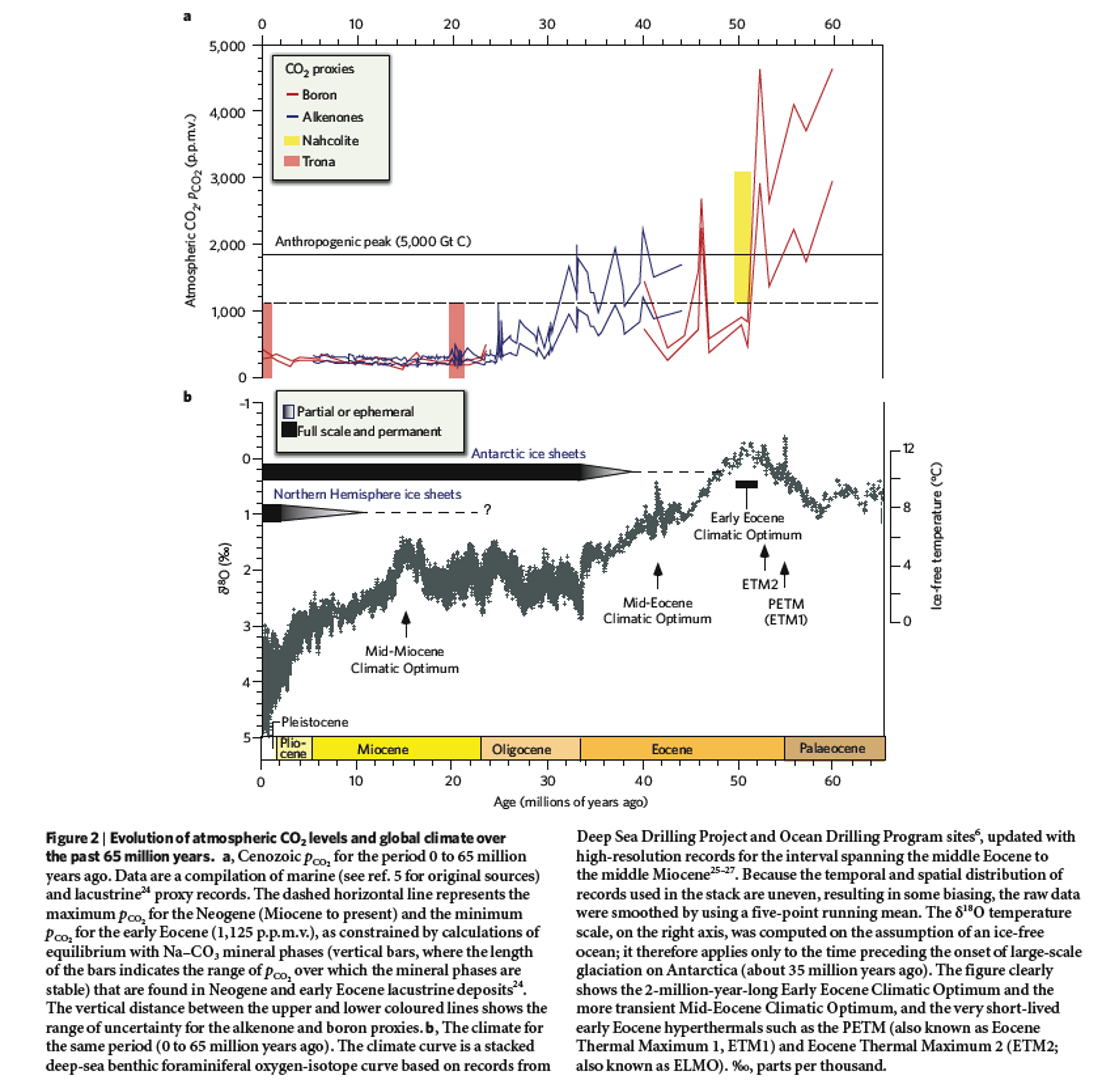
_______________________________________________________________
Past Extreme Warming Events Linked to Massive Carbon Release from Thawing Permafrost by DeConto
Ref: DeConto et al. Past Extreme Warming Events Linked to Massive Carbon Release from Thawing Permafrost. Nature 484, 87–91 (2012). https://doi.org/10.1038/nature10929
Here we use a new astronomically calibrated cyclostratigraphic record from central Italy7 to show that the Early Eocene hyperthermals occurred during orbits with a combination of high eccentricity and high obliquity. Corresponding climate–ecosystem–soil simulations accounting for rising concentrations of background greenhouse gases8 and orbital forcing show that the magnitude and timing of the PETM and subsequent hyperthermals can be explained by the orbitally triggered decomposition of soil organic carbon in circum-Arctic and Antarctic terrestrial permafrost. This massive carbon reservoir had the potential to repeatedly release thousands of petagrams (1015 grams) of C to the atmosphere–ocean system, once a long-term warming threshold had been reached just before the PETM. Replenishment of permafrost soil carbon stocks following peak warming probably contributed to the rapid recovery from each event9, while providing a sensitive carbon reservoir for the next hyperthermal10. As background temperatures continued to rise following the PETM, the areal extent of permafrost steadily declined, resulting in an incrementally smaller available carbon pool and smaller hyperthermals at each successive orbital forcing maximum.
_______________________________________________________________
---Discussion Threads---
_______________________________________________________________
Q. Leopold & Hardin
Q. How do the ideas presented by Leopold (1949) and Hardin (1968) relate to geology as a discipline and the broader Earth System science approach? Use specific examples to support your argument.
The impetus in science to transition from the Paleocene to the Anthropocene was predicated on the established theory that humans were affecting the various earth systems on a temporal and size scale unseen in Earths history- in fact, on a rate of change scale approaching an extinction event, as documented in Elizabeth Kolberts book “The Sixth Extinction” (which I highly recommend for anyone interested). Today humans are changing the biosphere, the hydrosphere, and the atmosphere in ways that, until recently, no one had really thought possible. The Earth has a radius of 6300km, a volume of over a trillion cubic kilometers with 500 million square kilometers of surface area. The ocean volume alone is nearly one and a quarter billion cubic kilometers with an atmosphere above it encompassing some 25 billion cubic kilometers (calculations are mine so don’t fact check me too closely). These are MASSIVE areas and volumes. There are seemingly endless fish, limitless trees, myriads of animal species. How is it possible that humans could effect these giant systems has been the common theme in expansion, extraction, competition, and sadly, policy, throughout human history. The scientific understanding that humans were negatively impacting these systems was not widely known until recently.
Both Hardin and Leopold touched on tangential issues in there writings; “The Tragedy of the Commons (1968)”, and “Sketches Here and There (1949),” respectively. Hardin writes on the potent issue of human population and its destabilizing effect on Earth’s various Resource Systems while Leopold discusses the ever important issue of “Land Ethics.” Attempting empathy with both authors is a bit interesting, particularly in a chronological sense. The US in 1949 had come out of World War II and gone, more or less, right into the Cold War, with a view of the dustbowl in the past. Atomic Bombs were being tested on Land and sea, the Haber Bosch Process was creating synthetic fertilizers for never before seen land development on an incredible scale, and the Marshall Plan was delivering aid to, particularly, European nations to assist them in, among many requisite things, food resources and land development. Hardin is, seemingly, a bit more straightforward discussing Population in 1969….a year after the world renowned thought provoking book “Population Bomb” was released by Paul and Anne Ehrlic (isn’t history fun!?).
As an amateur geologist (the label is mine), I’ve been studying Earth Sciences for most of my life. From swimming for Agates (SiO2) in Lake Superior to chasing obsidian (also SiO2!!) fields like our professor in Northern California (fun fact: check out “Little Glass Mountain” in California near Lava Beds National Monument), Geology is so much more than rocks! Geology and in this context, Earth System Sciences, discusses the interactive forces of the Earth, the Oceans, The Atmosphere, and even the Solar System. Sunlight, the earth’s interior, the moon, all effect the Earth in varying ways- tides, biodiversity, seasons, orography, volcanoes, storms, the list is endless (quite literally in a sense as every process we know seems based on what I now properly call internal and external energy sources). These natural processes have even affected our cultural practices as a species! We still call our “holy” day “Sun-day” and sadly, probably everyone in the class knows their astrologic sign which is, of course, based on star constellations. A subducting oceanic plate creates mountains which creates land, which due to erosion and other volcanic processes provides sands, soils, and minerals that, with rainfall and sunlight create plant life, which fuel animal life, and of course we humans compete with animals to fuel our bodies with plant’s unique ability to turn sunlight and CO2 into a source of energy.
Although both Hardin and Leopold seem to get a few things wrong in their essays, they both discuss the positive merits of not only understating Earth’s complex systems but of finding ways to protect them. Hardin explains that population and thus, humans, are the major issue and must be controlled (sidenote here: HIGHLY HIGHLY HIGHLY recommend the book “Countdown” by Alan Wiesman which details the population issue from an environmental standpoint and is literally the main impetus for my applying to this program). Leopold, a touch more philosophical in his approach, discusses the imperative nature of pushing humanity towards an ethic that incorporates land, animals, fish, seas, air, and more into human behavior. Both approaches suggest, and I wholeheartedly agree, that humans are part of a broad, yet complex, Earth Sciences System, that we are, at present, thriving in at the expense of every other Earth system.
References
Garret Hardin, The Tragedy of the Commons (13 Dec, 1968). Science, New Series, Vol. 162. Published in the American Association for the Advancement of Science.
Aldo Leopold. Sketches Here and There (1949). Sound County Almanac, Oxford University Press, ISBN: 0-190505305-2.
_______________________________________________________________