Sustainability Science
Ref: Jen da Rosa (2020). Sustainability Science: Concepts and Challenges. JHU MS-ESP Course of Instruction (420.612). Email: jdarosa@jh.edu
_____________________________________________________________________________
Summary
An overview of sustainability in the context of climate change and its corresponding concepts and challenges in adapting to and mitigating from the adverse effects of climate change.
Core Questions of Sustainability Science
How can the dynamic interactions between nature and society-including lags and inertia--be better incorporated into emerging models and conceptualizations that integrate the Earth system, human development, and sustainability?
How are long-term trends in environment and development, including consumption and population, reshaping nature-society interactions in ways relevant to sustainability?
What determines the vulnerability or resilience of the nature-society system in particular kinds of places and for particular types of ecosystems and human livelihoods?
Can scientifically meaningful "limits" or "boundaries" be defined that would provide effective warning of conditions beyond which the nature-society systems incur a significantly increased risk of serious degradation?
What systems of incentive structures--including markets, rules, norms, and scientific information-_-can most effectively improve social capacity to guide interactions between nature and society toward more sustainable trajectories?
How can today's operational systems for monitoring and reporting on environmental and social conditions be integrated or extended to provide more useful guidance for efforts to navigate a transition toward sustainability?
How can today's relatively independent activities of research planning, monitoring, assessment, and decision support be better integrated into systems for adaptive management and societal learning?
_____________________________________________________________________________
Sustainability
Sustainable Development: Development that meets the needs of the present without compromising the needs of future generations.
Sustainable development is development that meets the needs of the present generation without compromising the ability of future generations to meet their own needs (Our Common Future, 1988).
Sustainability science is a field defined by the problems it addresses rather than by the disciplines it employs.
Transition Toward Sustainability: Improving society's capacity to use the earth in ways that simultaneously meet the needs of a much larger but stabilizing human population, sustain the life support systems of the planet, and substantially reduce hunger and poverty. These efforts include improving access to water supplies of adequate quality and quantity, advancing cleaner energy and manufacturing systems, mitigating the human health impact of pollution and environmentally mediated disease, enhancing agricultural production and food security, encouraging more benign trajectories of rapid urbanization, and more generally making more effective use of environmental and natural resources to promote poverty alleviation.
Weak Sustainability: A compromise between a desire to achieve the environmental changes necessary for sustainability and to express this in financial terms. This allows us to estimate the costs and benefits from a programme and thereby gauge the best value for money and make any trade-offs transparent. This contrasts with strong sustainability, where there is no such compromise. The argument here is that the environment is the primary consideration and there is no trade-off between that and economic benefits.
_____________________________________________________________________________
Atmosphere
Atmospheric Change
Increase of GHGs leading to warming & climate change.
Atmospheric Solutions
Artificial Rain: Cloud Seeding to reduce fine dust using Silver Iodide, Dry ice (CO2), or Salts which increase cloud condensation nuclei to form water droplets.
_____________________________________________________________________________
Land
Land Change: Soil Degradation, deforestation, overgrazing, agricultural activities, overexploitation of vegetation for domestic use, bio-industrial activities, increasingly saline soils due to intense farming.
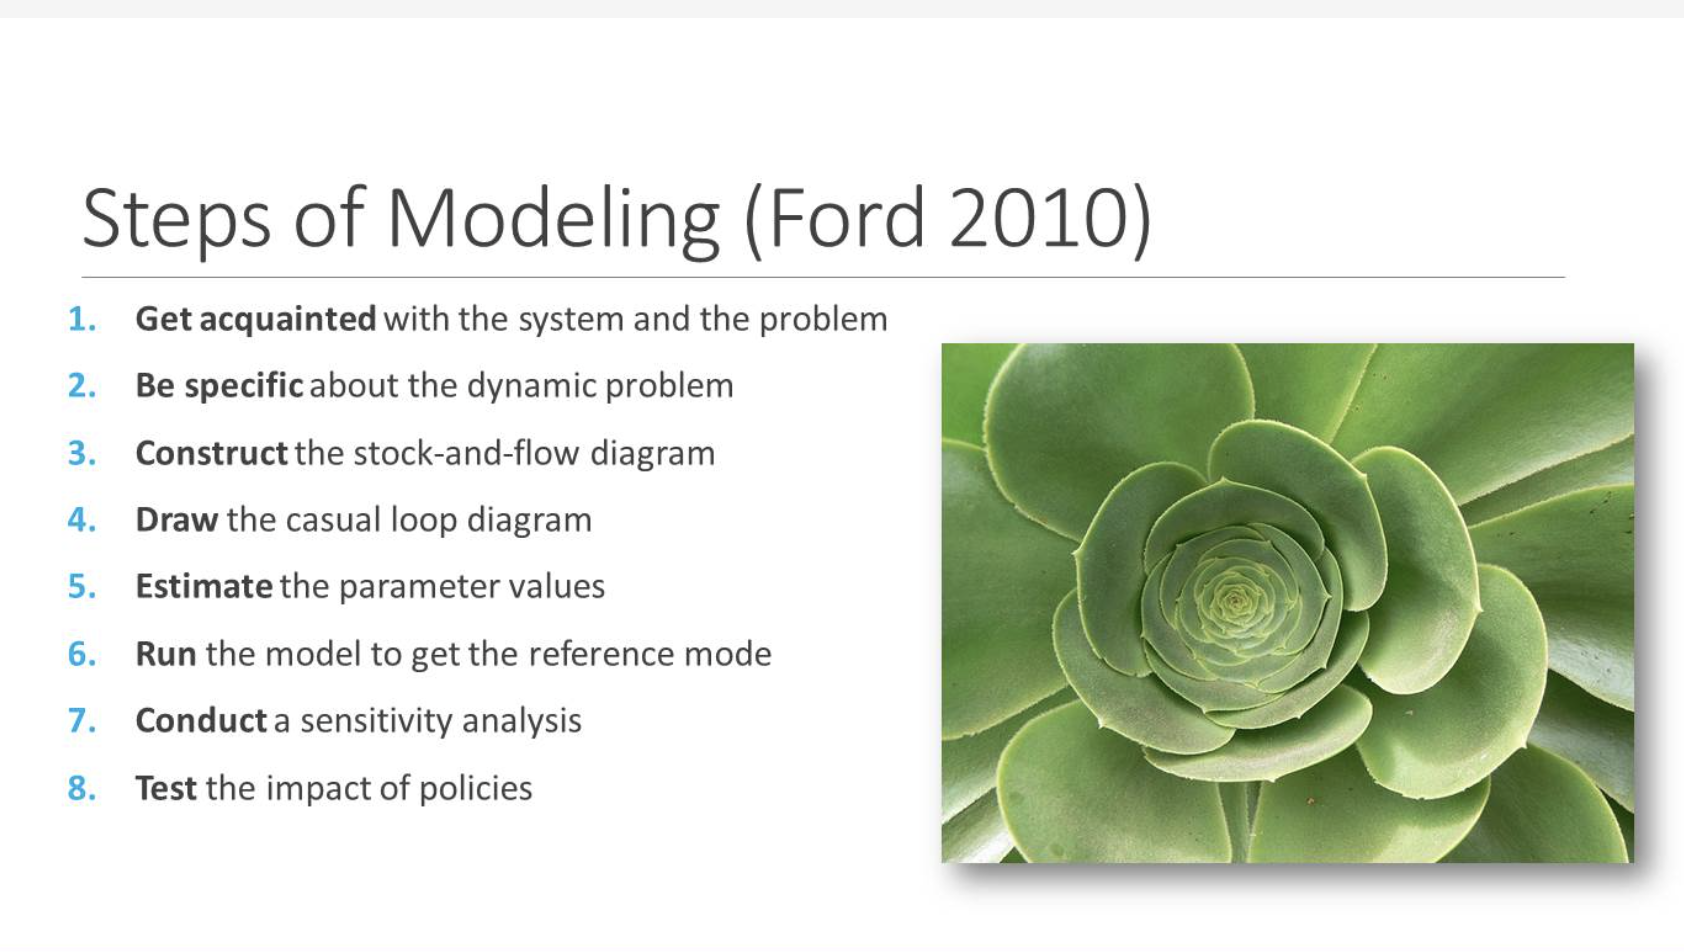
Modeling
Normalized Difference Vegetation Index (NDVI).
Land Change Solutions
Bio-Regionalism: Not exceeding the logistical growth capacity of a bio-region.
Organic Farming: Natural restoration of soils including crop rotation.
Biointensive Method: Urban area, raised area, small plots.
Agroecology: Nutrient Cycling.
Conservation Agriculture: No-till farming, crop rotation.
No-Till Farming: Planting of seeds directly into the field.
Agroforestry: Integrates trees into cropping.
Permaculture: Permanent + agriculture.
Intercropping.
_____________________________________________________________________________
Biodiversity
Biodiversity Change
Loss of biodiversity.
Alien species introductions.
_____________________________________________________________________________
Water
Water Change
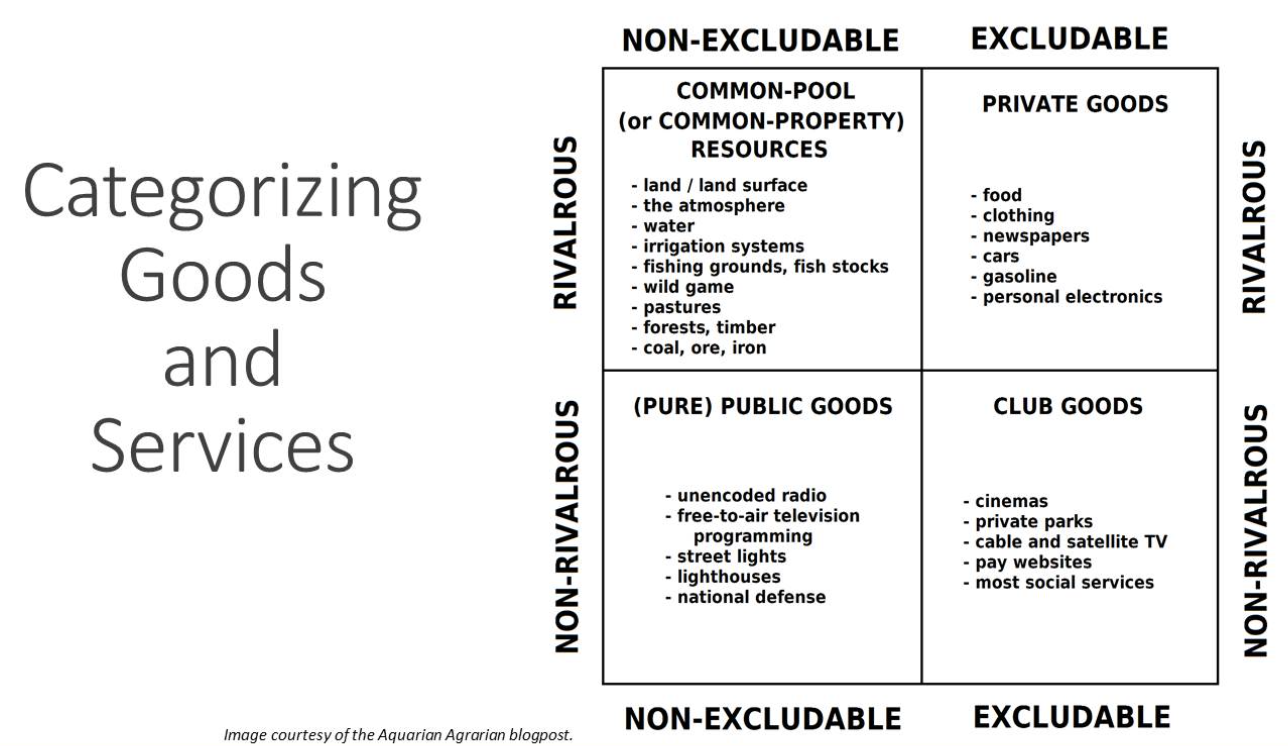
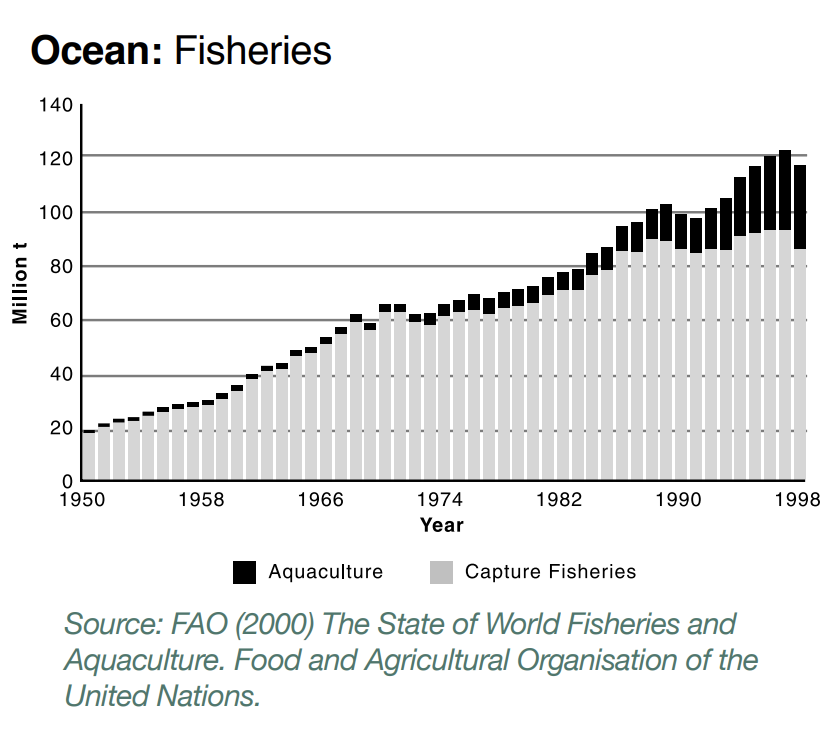
Many fisheries are not owned by one person or even by one country. Instead, they are regarded as common property resources, with access open to anyone with the means to harvest the population. This results in what has been called “the tragedy of the commons.”
Overfishing: Fish Stock Collapse; decrease in Fish Stock by 90%.
Freshwater limits.
Water Solutions
Aquaculture: Generates ~50% of fish protein and requires a large supply of antibiotics.
Salmon Aquaculture: Requires 4kg of food for every 1kg of salmon.
_____________________________________________________________________________
Anthropogenic
Anthropogenic Change
Energy Limitations.
Human consumption levels.
Population growth.
Toxic chemicals.
____________________________________________________________________
Resources
Renewable Resources: Regeneration rate > consumption rate.
Non-Renewable Resources: Regeneration rate < consumption rate; includes mineral and fossil fuels.
Environmental Sink: Where the wastes of non-renewable resource use goes.
Assessing Resource Chains
Substance Flow Analysis (SFA).
Material Flow Analysis (MFA).
Emergy: The amount of energy consumed in direct and indirect transformations to make a product or service. energy required for a product.
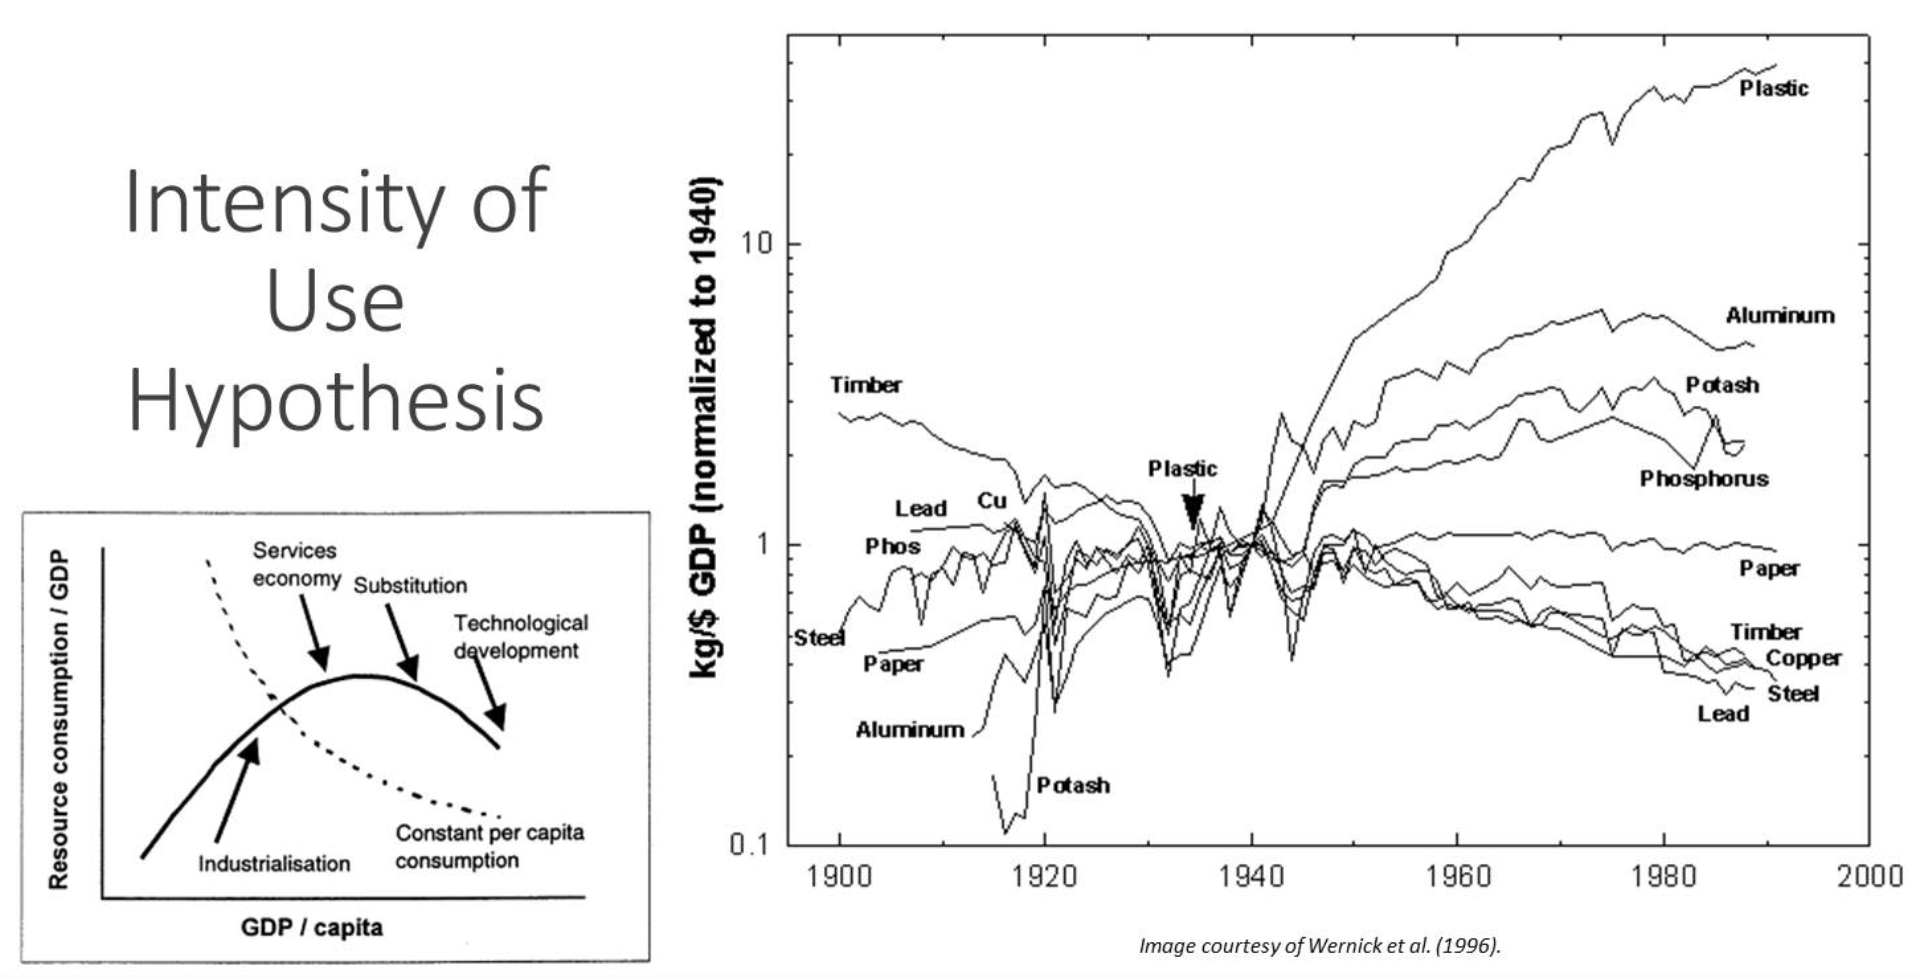
Material Intensity per Unit Service/Function (MIPS): Measures eco-efficiency of products on different scale levels (magnitude of resource use on life cycle).
Life Cycle Assessment (LCA).
____________________________________________________________________
Environmental Cost
GDP (expenditure) = C + G + I + (EX-IM); GDP = gross domestic product, C = consumers expenditure on goods and services, G = government expenditure on goods and services, I = investment, EX = exports, IM = imports.
Real GDP: GDP in which USD is chained to their value in years to remove the impact of inflation.
A country can generate, and indeed maintain, a substantial growth in GDP by completely destroying its natural habitats and resource base. This is obviously not sustainable in a weak sustainability sense of the term unless the capital that is generated is invested in ways that can maintain economic growth.
Environmentally Adjusted Net domestic Product (EDP) = GDP - Capital Consumption (cc) - Environmental costs (ec).
cc is the replacement value of man-made capital used up in the process of production and environmental costs and includes depletion of natural resources (minerals, forests, water and so on), as well as environmental degradation through pollution.
The ratio of EDP and GDP provides one measure of sustainability; the lower this ratio then the greater the extent to which GDP is being bought at the expense of capital consumption and/or damage to the environment.
Estimating the Cost of Environmental Degradation
Financial estimates of natural resource depletion can be found in UNSD and World Bank datasets for energy, metals, minerals and forests.
Estimate the financial impact(s) of degradation. For example, once we know what the level of pollution is we could estimate how this reduces forest and crop growth or how it reduces productivity amongst workers.
Estimate the cost of reducing degradation below an acceptable level (i.e. the maintenance cost).
GPI = Cw + social benefits - social costs - environmental costs +/- _ NCI +/- NFB
NCI and NFB are net capital investment and net foreign borrowing, respectively
____________________________________________________________________
Population
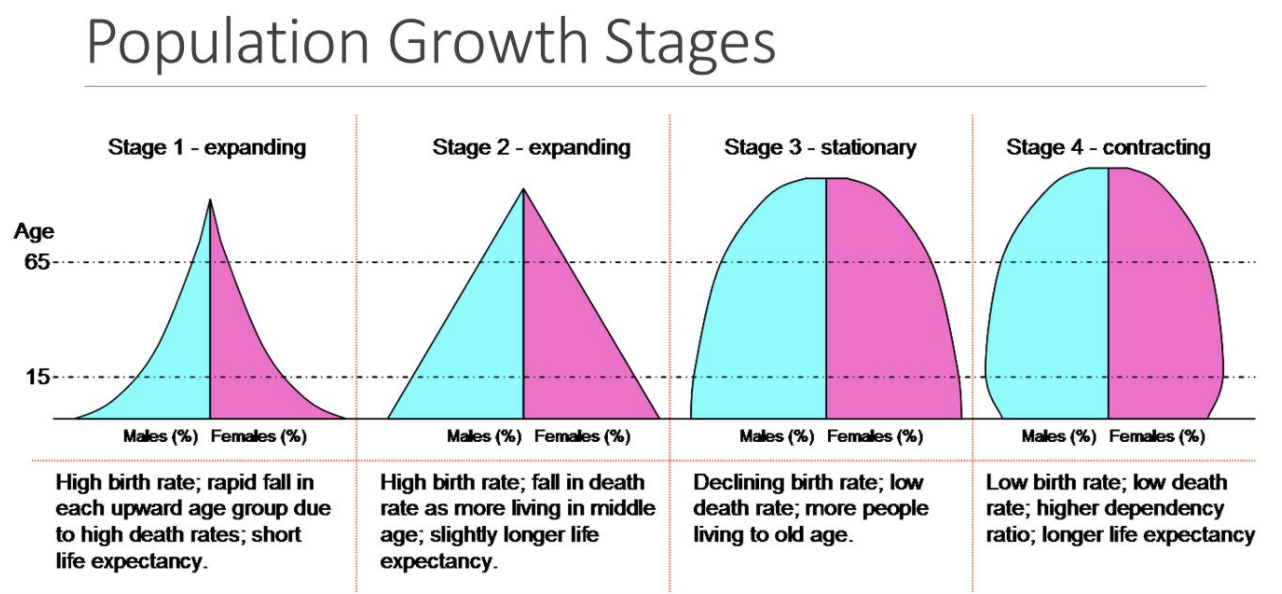
Demographers expect four trends in the world’s human population over the next 50 years;
The population will be older than it was in the previous century and bigger than it is now.
Population will continue to grow, but at a slower rate.
Migrations will continue.
Populations will be increasingly urban.
1960’s: Human Population Growth Rates peak at ~2.1%.
Human replacement rate: 2.1
The biggest predictors of birthrate are lack of education and lack of employment.
Overshoot: When a population exceeds carrying capacity. Leads to Overshoot/collapse oscillations.
_____________________________________________________________________________
Misc Quotes
"Art is a lie that helps us see the truth.”-Picasso.
_____________________________________________________________________________
Resources
Environmental Sustainability Index (ESI): A measure of overall progress towards environmental sustainability.
National Resource Defense Council (NRDC): https://www.nrdc.org/
_____________________________________________________________________________
Terminology
Ecologically Sustainable Yield (ESY): The yield an ecosystem can sustain without shifting to an undesirable state.
Inbreeding Depression: Mating between closely related individuals that leads to a loss of genetic diversity and a corresponding reduction in reproductive fitness.
Industrial Ecology: The study of systemic relationships between society, the economy, and the natural environment.
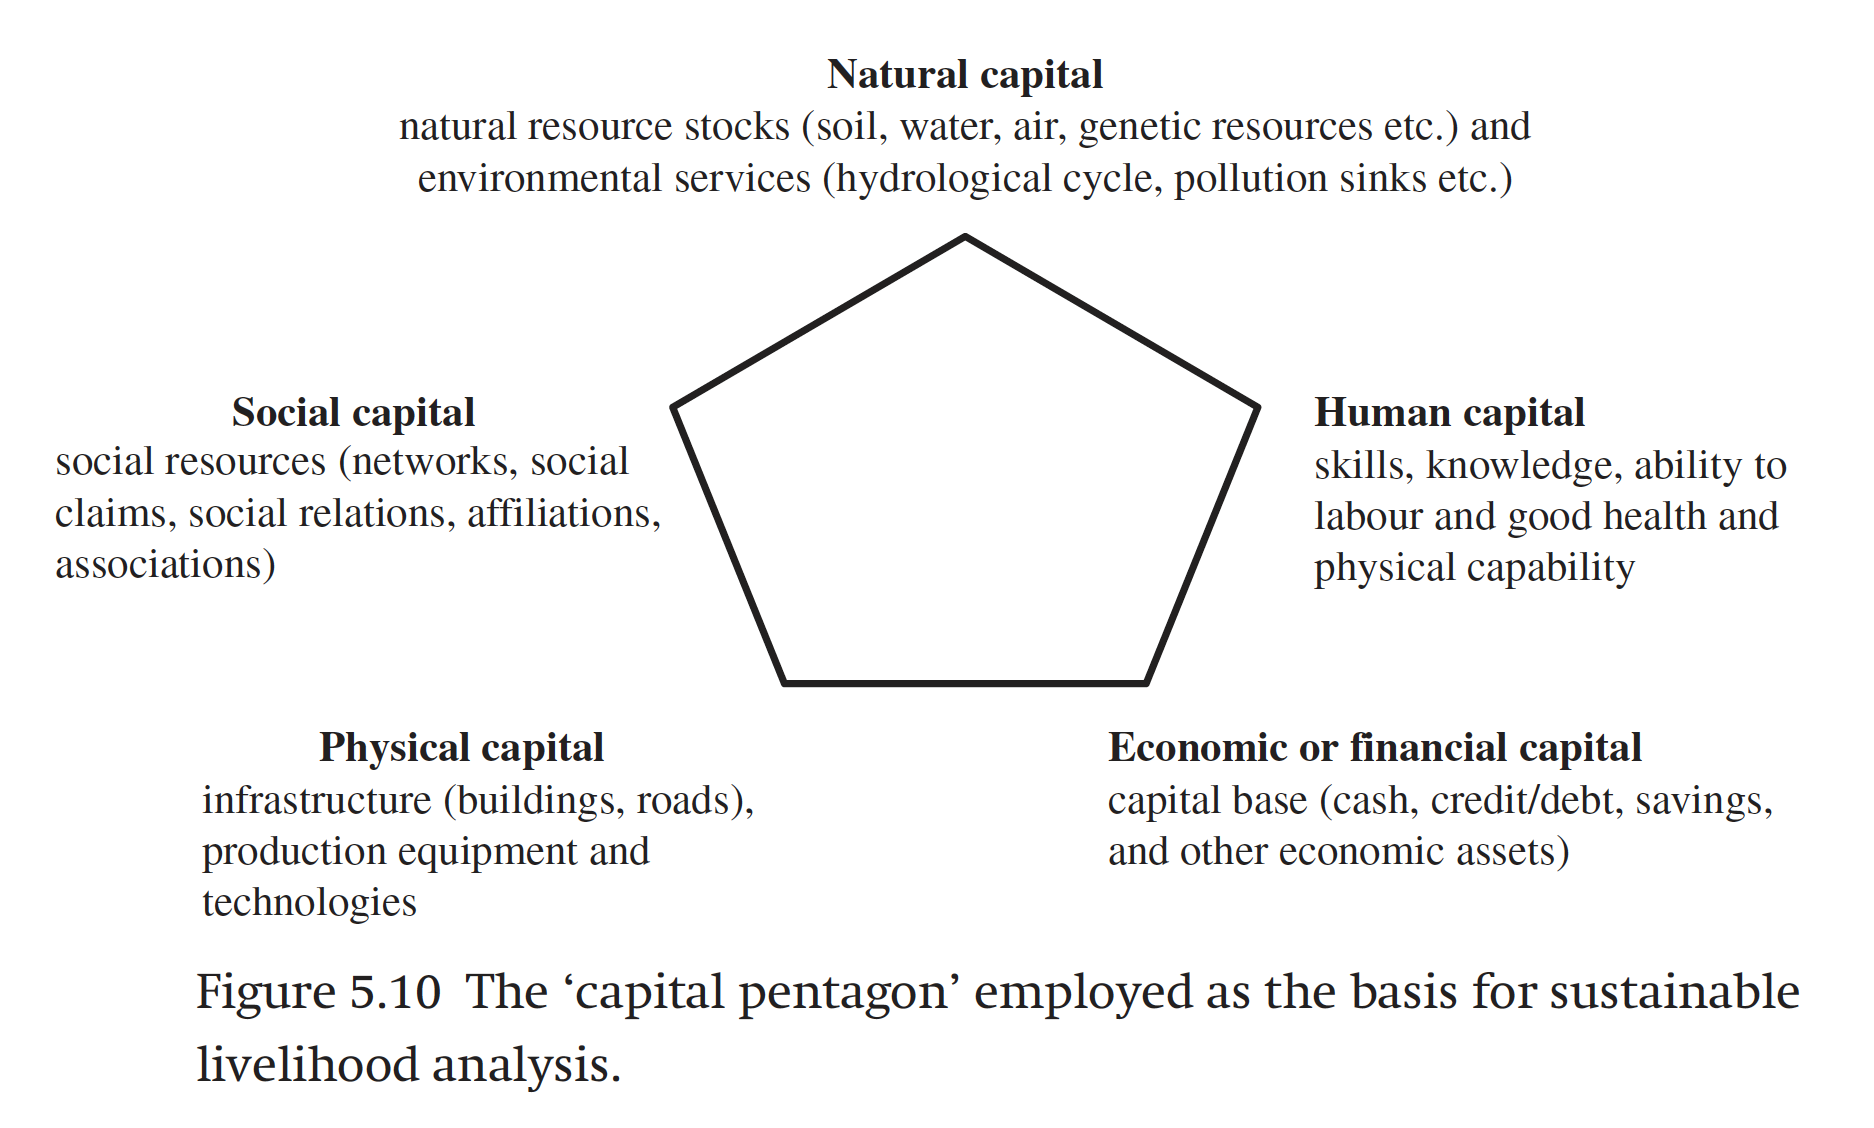
Livelihood: The capabilities, assets (including both material and social resources) and activities required for a means of living. A livelihood is sustainable when it can cope with and recover from stresses and shocks and maintain or enhance its capabilities and assets both now and in the future, while not undermining the natural resource base.
Maximum Sustainable Yield (MSY): The largest yield that can be taken from a species stock over an indefinite period.
Outbreeding Depression: Mating between genetically distinct individuals that introduces new alleles that disrupt local adaptation and lead to reduced reproductive fitness.
Tipping Points: Ecosystem thresholds with corresponding dangers in crossing them.
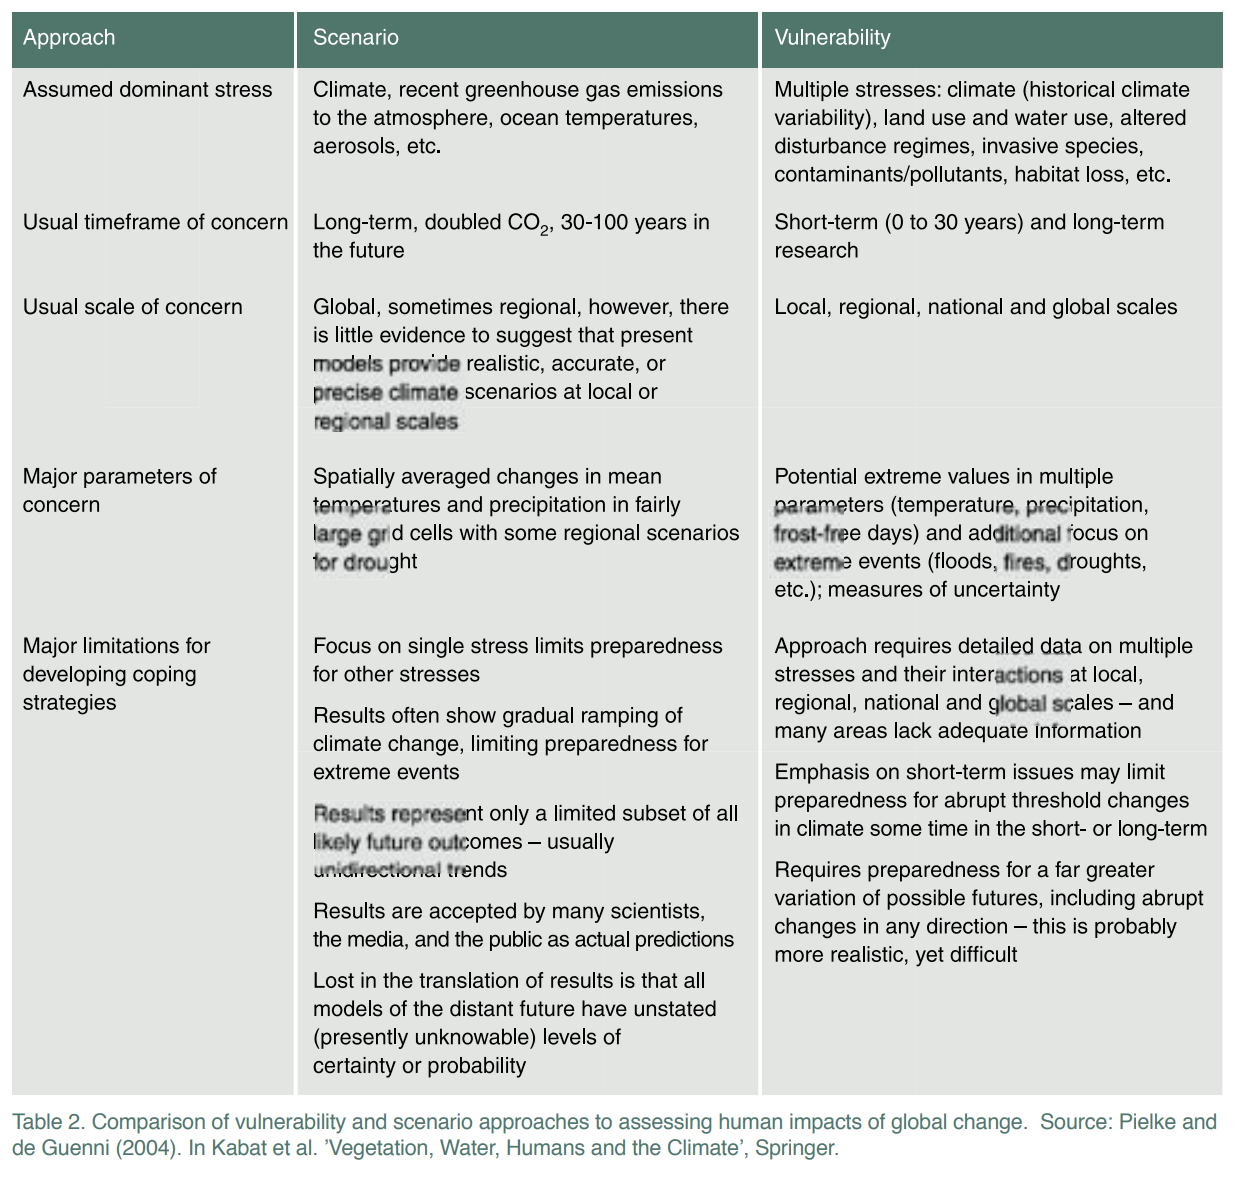
Vulnerability Assessment: Selects a particular group or unit of concern (e.g. landless farmers, boreal forest ecosystems, coastal communities) and seeks to determine the risk of specific adverse outcomes for that unit in the face of a variety of stresses and identifies a range of factors that may reduce response capacity and adaptation to stressors.
Water Stress: Water demand > water availability.
_____________________________________________________________________________
People
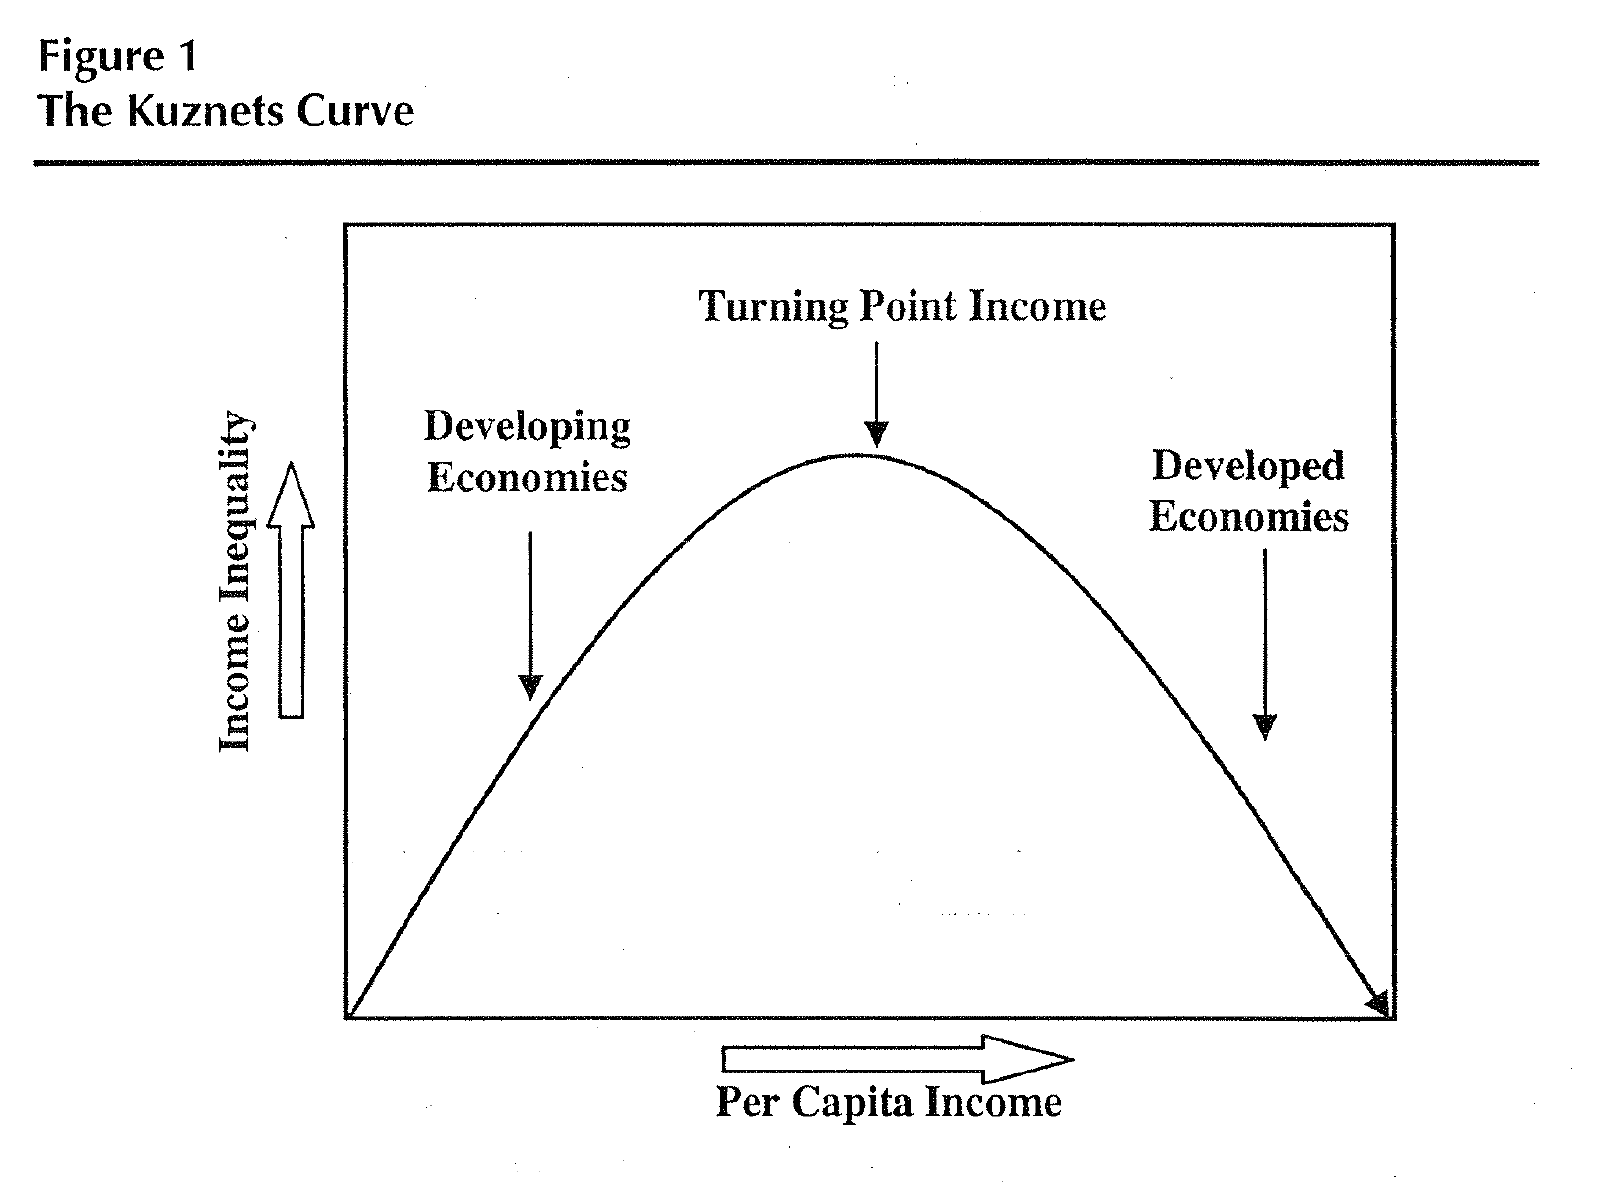
Simon Kuznets (1901-1985): A Russian-born economist and Nobel Prize winner famous for his work on estimating national income. One of Kuznets interests was the nature of an assumed link between national wealth and inequality of the distribution of that wealth (Kuznets and Simon, 1955). He hypothesized that wealth inequality increases with wealth, but at some point, the curve turns and inequality declines as social support systems such as a minimum wage, better education etc. take effect. This is referred to as the inequality Kuznets curve (IKC).
_____________________________________________________________________________
Chronology
1992: The UN Conference on Environment and Development establishes the legally non-binding UN Framework Convention on Climate Change (UNFCC) which aims to combat CC by reducing global GHG emissions and makes provisions for future protocols, including Kyoto, to set mandatory emissions limits (Kollmuss, 2008).
1991: Economists first report a systematic relationship between income changes and environmental quality (EKZ by Yandle).
1960’s: Human Population Growth Rates peak at ~2.1% (JHU Sustainability, da Rosa).
1947: The International Organization for Standardization (ISO) is established in Geneva as a consensus-based network of national standards from 163 countries (Robinson, 2017).


_____________________________________________________________________________
---Articles---
____________________________________________________________________
Why Model? Journal of Artificial Science Vol. 11 by Epstein
Ref: Joshua Epstein (31 Oct, 2008). Why Model? Journal of Artificial Societies and Social Simulation, Vol. 11, #412.
In explicit models, assumptions are laid out in detail, so we can study exactly what they entail. “On these assumptions, this sort of thing happens. When you alter the assumptions that is what happens.” By writing explicit models, you let others replicate your results.
Models can discipline the dialogue about options and make unavoidable judgments more considered.
Modeling goals include: 1. Explain (very distinct from predict) 2. Guide data collection 3. Illuminate core dynamics 4. Suggest dynamical analogies 5. Discover new questions 6. Promote a scientific habit of mind 7. Bound (bracket) outcomes to plausible ranges 8. Illuminate core uncertainties. 9. Offer crisis options in near-real time 10. Demonstrate tradeoffs / suggest efficiencies 11. Challenge the robustness of prevailing theory through perturbations 12. Expose prevailing wisdom as incompatible with available data 13. Train practitioners 14. Discipline the policy dialogue 15. Educate the general public 16. Reveal the apparently simple (complex) to be complex (simple).
____________________________________________________________________
Sustainability Science Vol. 292 by Kates
Ref: Kates et al (27 Apr, 2001). Sustainability Science. Science, Vol. 292, #5517.
Meeting fundamental human needs while preserving the life-support systems of planet Earth is the essence of sustainable development.
Solutions in sustainability science must encompass the interaction of global processes with the ecological and social characteristics of particular places and sectors.
Sustainability science will need to do the following: (i) span the range of spatial scales between such diverse phenomena as economic globalization and local farming practices, (ii) account for both the temporal inertia and urgency of processes like ozone depletion, (iii) deal with functional complexity such as is evident in recent analyses of environmental degradation resulting from multiple stresses; and (iv) recognize the wide range of outlooks regarding what makes knowledge usable within both science and society.
Sustainability science needs to move forward along three path- ways. First, there should be wide discussion within the scientific community- North and South regarding key questions, appropriate methodologies, and institutional needs. Second, science must be connected to the political agenda for sustainable development, using in particular the forthcoming "Rio + 10" conference: The World Summit on Sustainable Development that will be held in South Africa in 2002. Third (and most important), research itself must be focused on the character of nature-society interactions, on our ability to guide those interactions along sustain- able trajectories, and on ways of promoting the social learning that will be necessary to navigate the transition to sustainability.
____________________________________________________________________
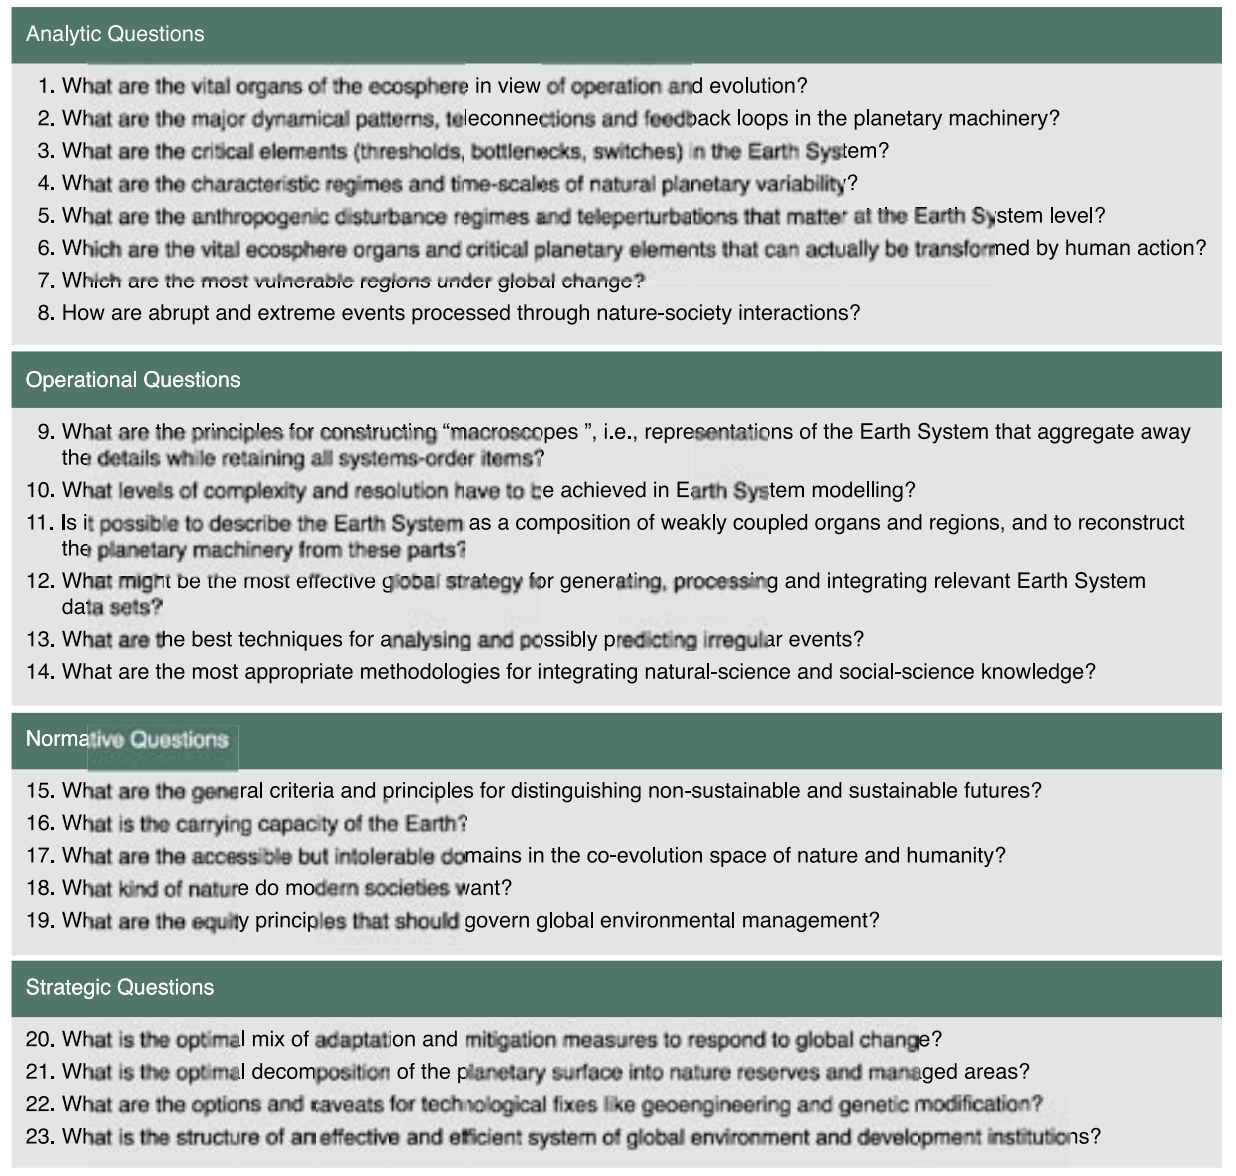
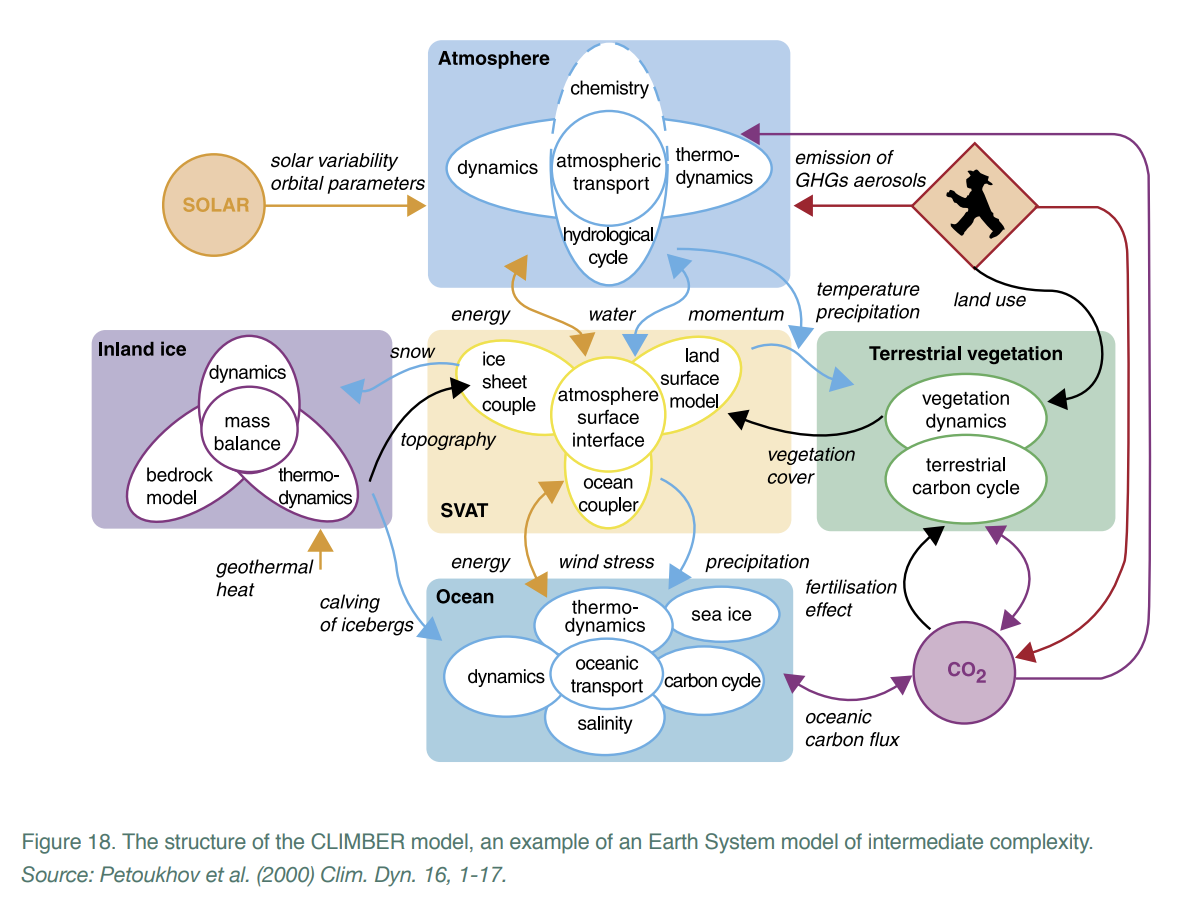
Global Change and the Earth System: A Planet under Pressure by Steffen
Ref: Steffen et al (2004). Global Change and the Earth System: A Planet under Pressure. IGBP.
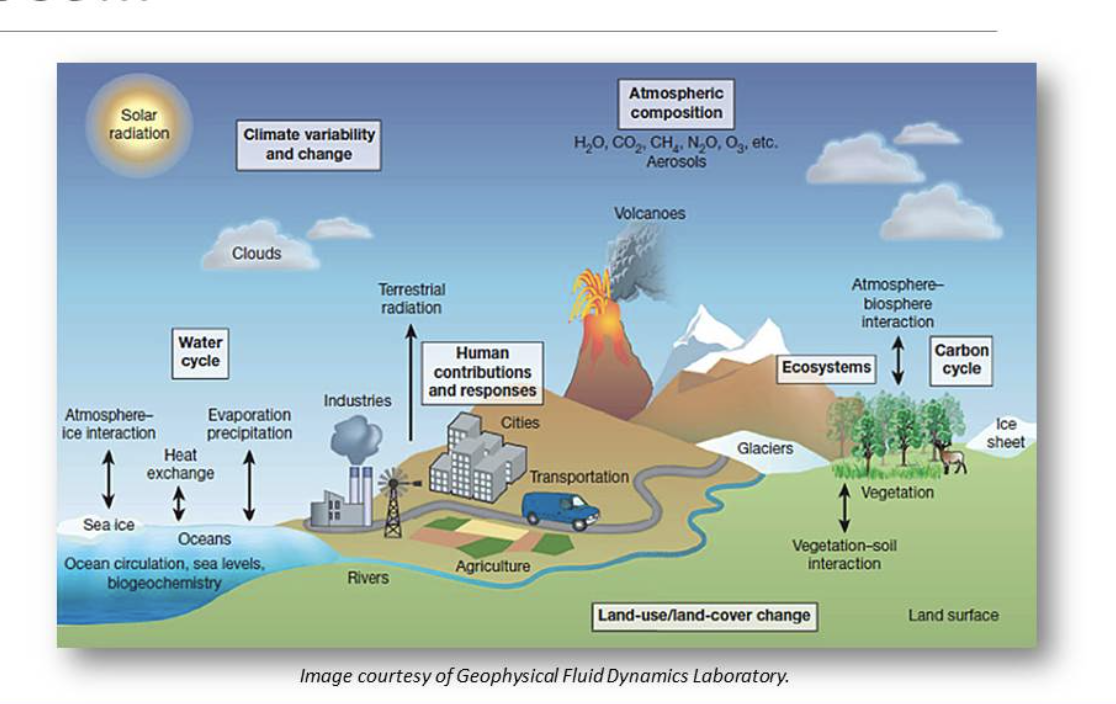
The view of Earth from a spaceship, a blue-green sphere floating in blackness, triggers emotional feelings of a home teeming with life set in a lifeless void, as well as more analytical perceptions of a materially limited and self-contained entity.
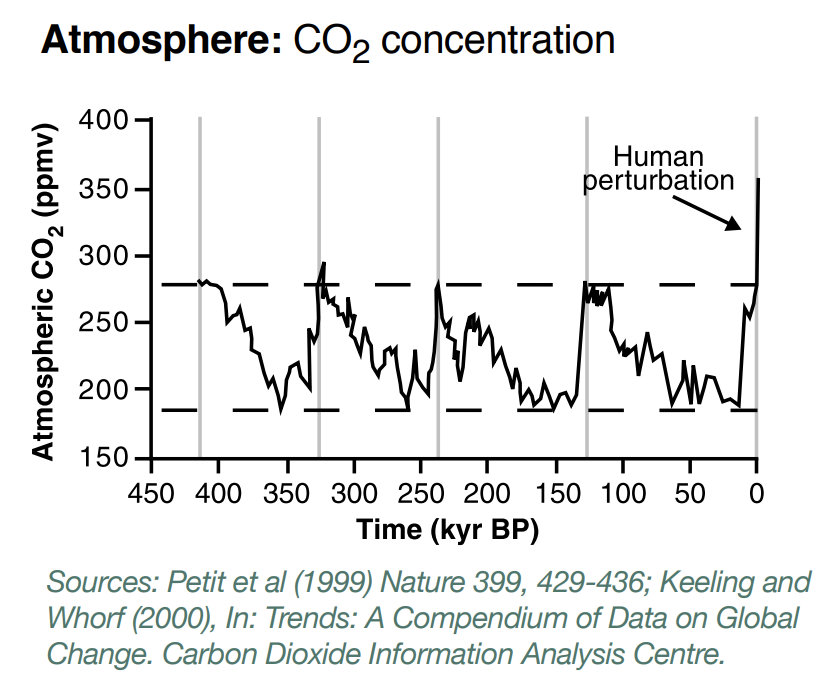
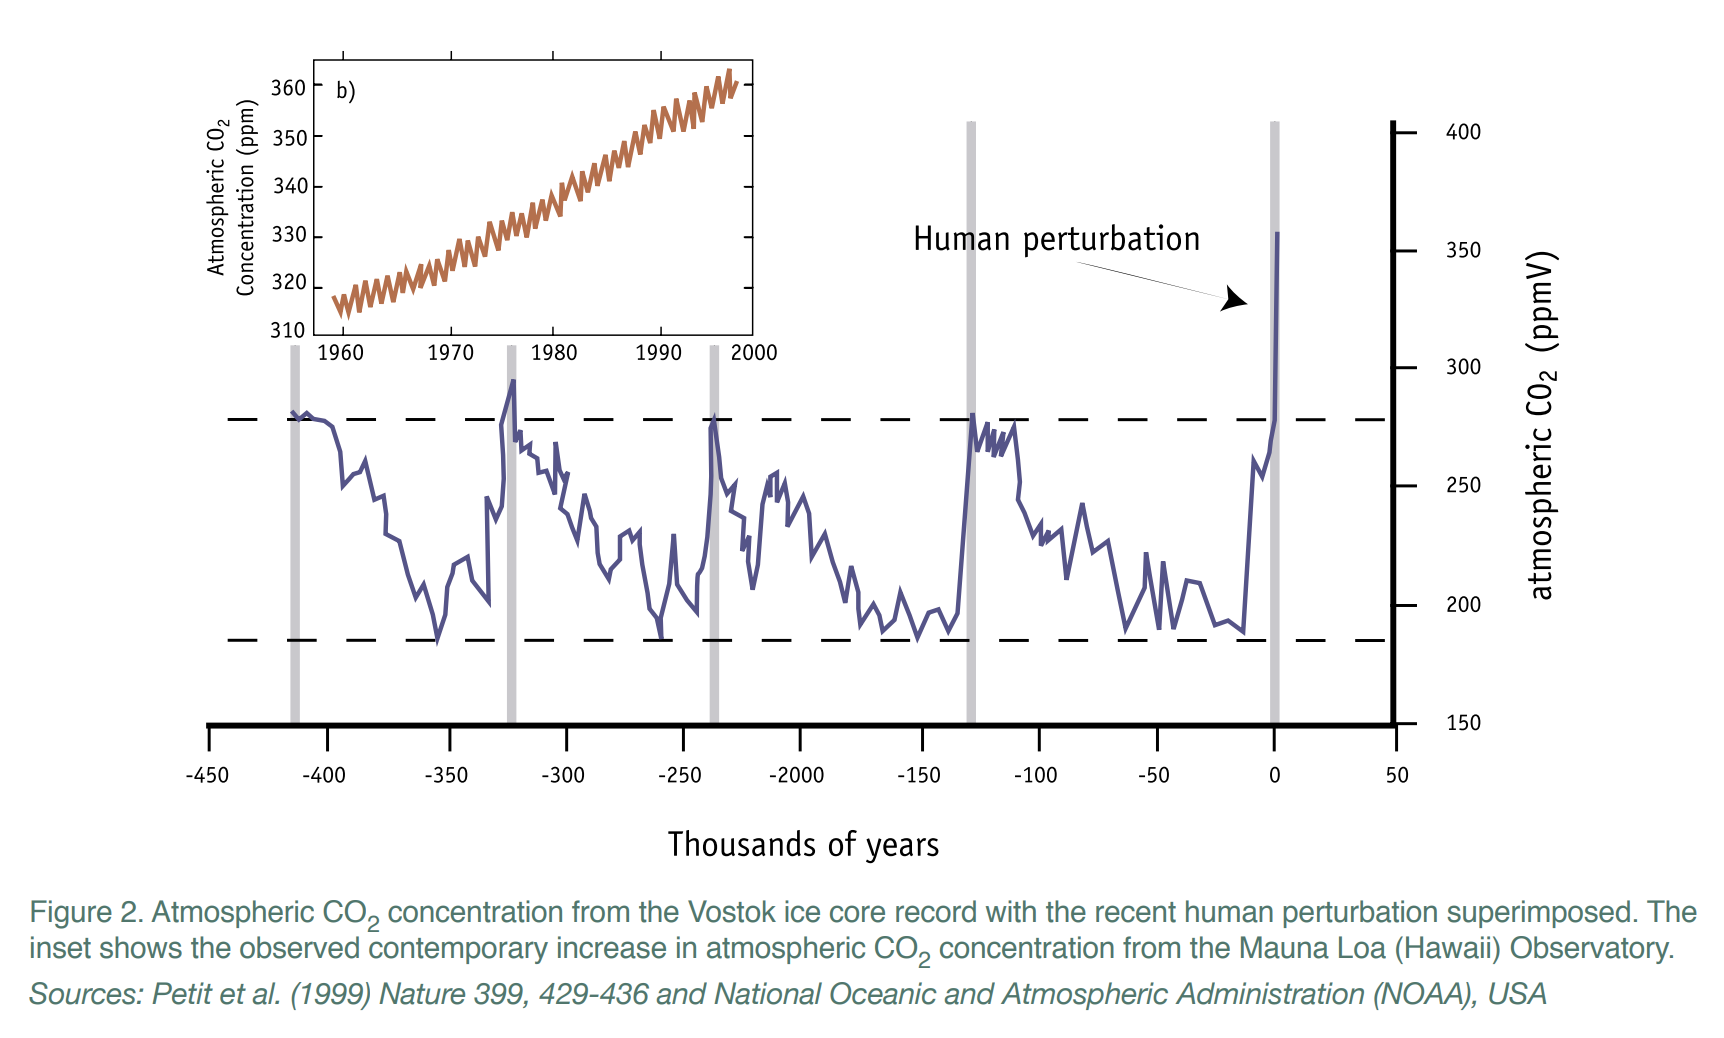
The 1999 publication of the 420,000-year record from the Vostok ice core. These data, arguably among the most important produced by the scientific community in the 20c, provide a powerful temporal context and dramatic visual evidence for an integrated planetary environmental system. The Vostok ice core data give a wealth of insights into the Earth System. Three striking characteristics demonstrate beyond any doubt that the Earth IS a system, with properties and behavior that are characteristic of the System as a whole. 1) The temporal dynamics of global temperature and of the global carbon cycle, as represented by the atmospheric concentration of the trace gases CO2 and CH4, are tightly coupled and show very similar patterns throughout the record. 2) The main maxima and minima of temperature and atmospheric trace gas concentration follow a regular pattern through time, each cycle spanning ~100,000 years; 3) The range over which temperature and trace gas concentrations varied is bounded at upper and lower limits; the values fall recurrently within the same envelope through four cycles of the Earth System over the last half million years.
Without the thin layer of ozone in the upper atmosphere, much more harmful UV radiation would penetrate to the Earth’s surface; and without the thin layer of heat absorbing GHGs in the lower atmosphere, the planet’s mean surface temperature would be about 33 °C lower than it is now.
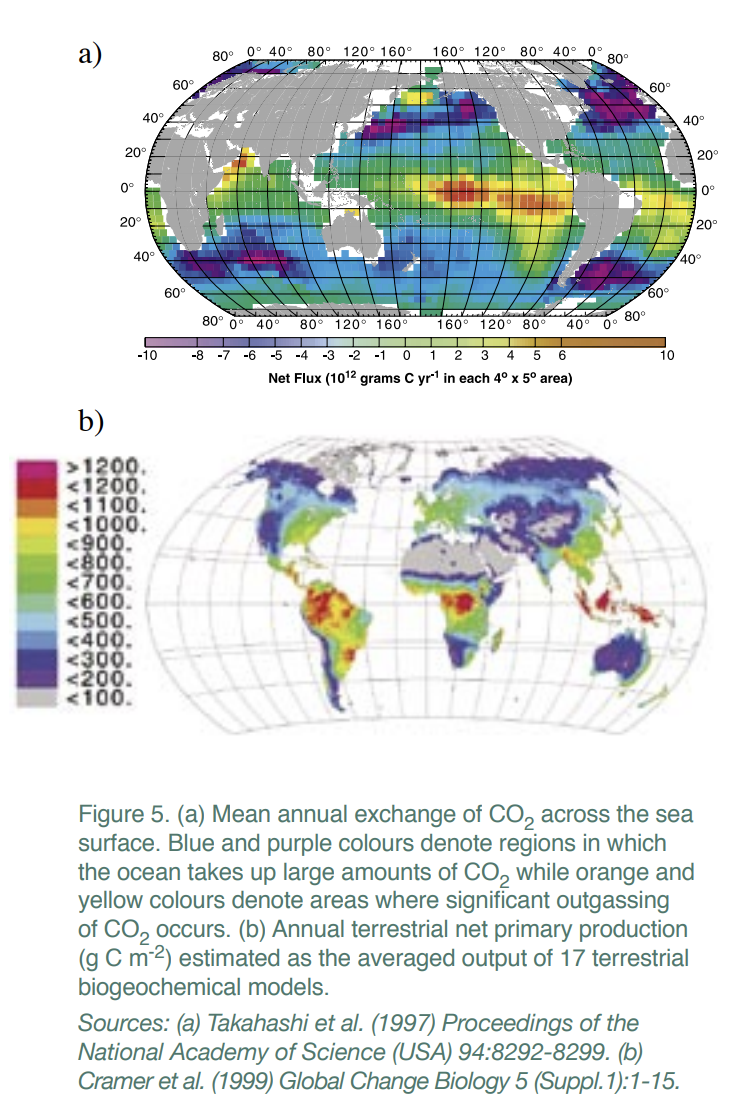
A cooler and drier climate leads to less vegetation cover on the land surface, which in turn leads to an increase in bare soil and thus dustiness. Fe-containing dust from the land is transported by wind over the oceans, where it acts as a fertilizer to phytoplankton (Fe is a micro-nutrient) when it is deposited on the ocean surface. This causes a phytoplankton bloom, which increases the productivity of the ocean biota and consequently draws down CO2 from the atmosphere. Decreasing atmospheric CO2 concentration leads to a cooler and drier climate, completing the positive feedback loop.
Recent work shows that a simulated dust field for the Last Glacial Maximum, consistent with the Vostok data, can provide enough Fe to the Southern Ocean to stimulate a diatom bloom, drawing down CO2 substantially.
Anthropocene Era (a term coined by Paul Crutzen and Eugene Stoermer), has begun:
In the last 150 years humankind has exhausted 40% of the known oil reserves that took several hundred million years to generate.
Nearly 50% of the land surface has been transformed by direct human action, with significant consequences for biodiversity, nutrient cycling, soil structure, soil biology, and climate.
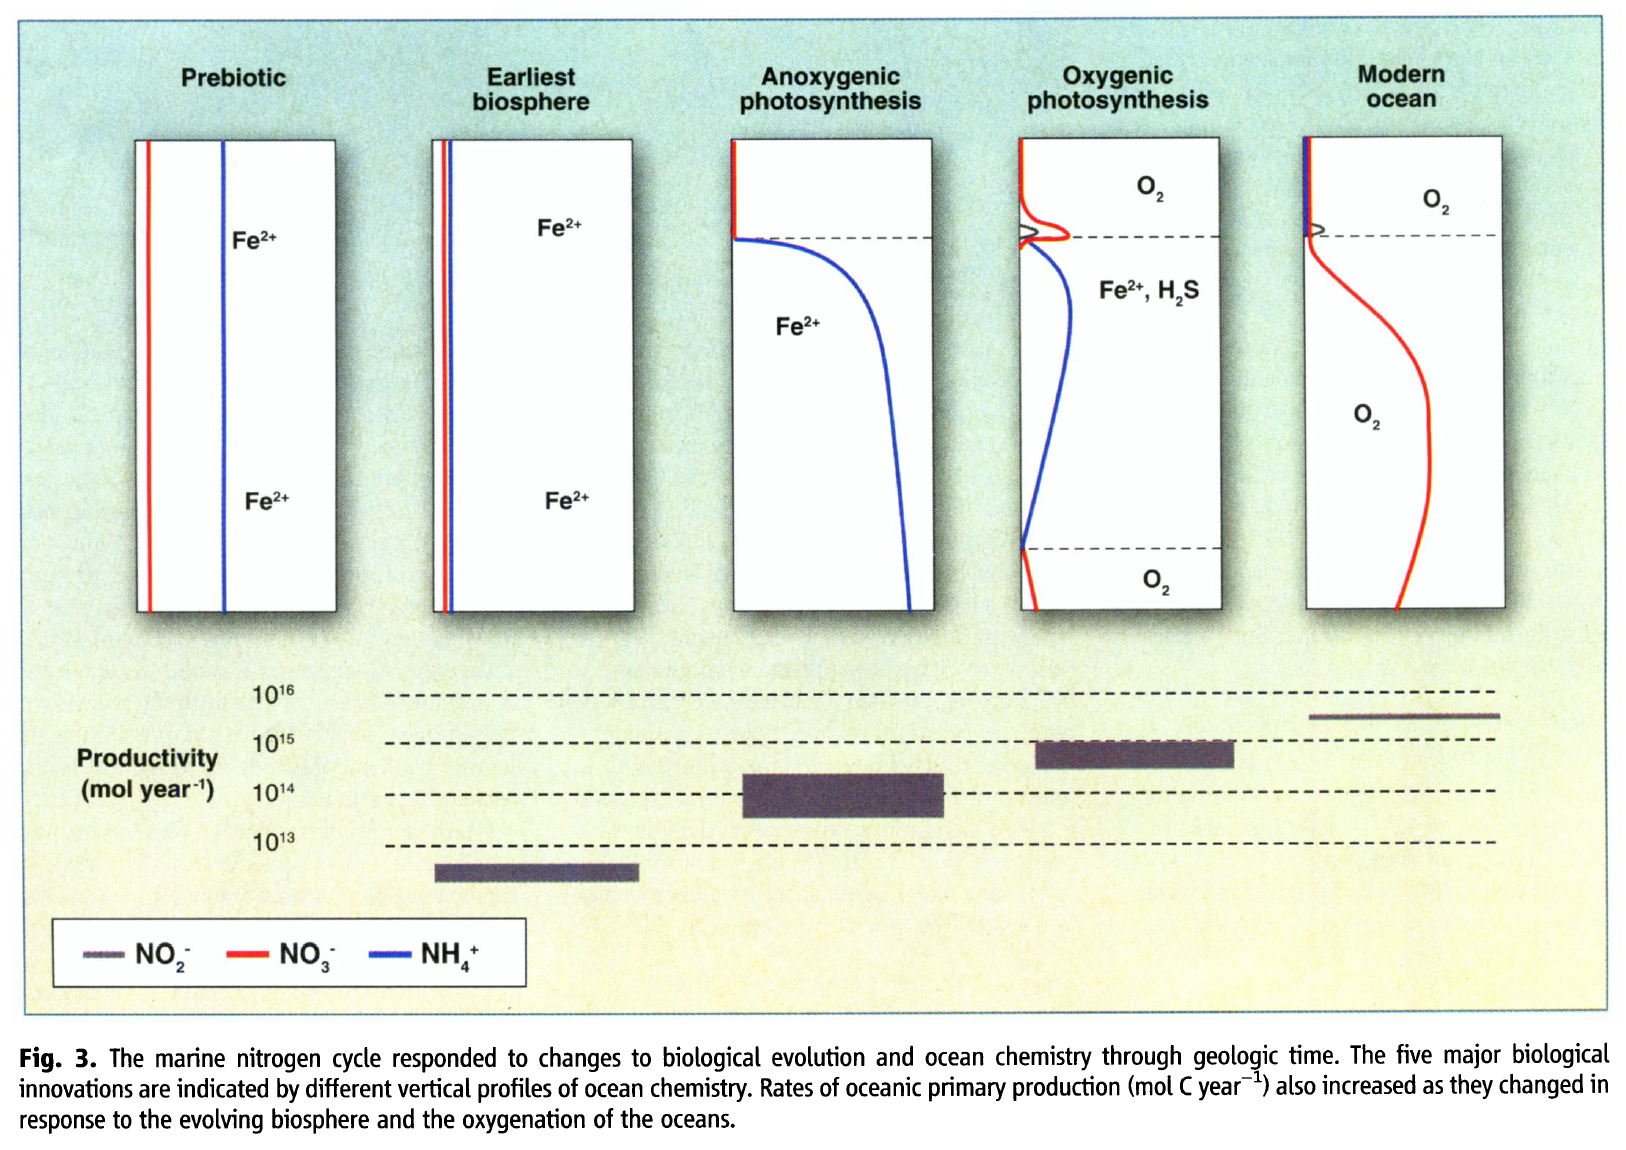
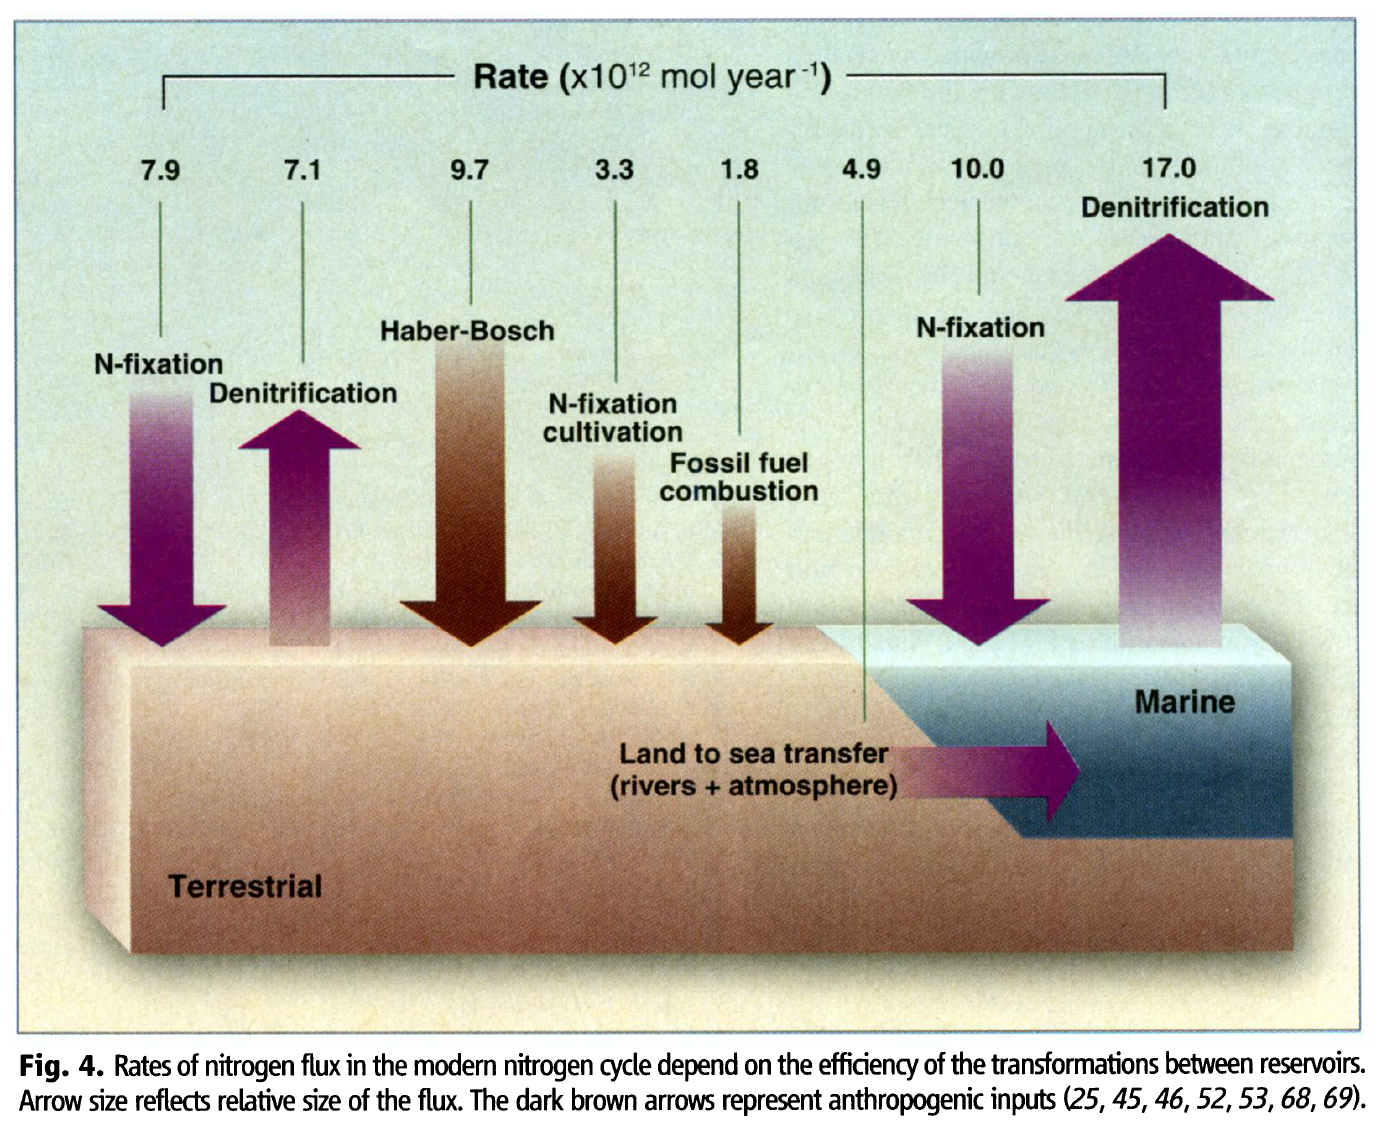
More nitrogen is now fixed synthetically for fertilisers and through fossil fuel combustion than is fixed naturally in all terrestrial ecosystems.
More than half of all accessible freshwater is appropriated for human purposes, and underground water resources are being depleted rapidly in many areas.
The concentrations of several climatically important GHGs, in addition to CO2 and CH4 , have substantially increased in the atmosphere.
Coastal and marine habitats are being dramatically altered; 50% of mangroves have been removed and wetlands have shrunk by one-half.
About 22% of recognized marine fisheries are overexploited or already depleted, and 44% more are at their limit of exploitation.
Extinction rates are increasing sharply in marine and terrestrial ecosystems around the world; the Earth is now in the midst of its first great extinction event caused by the activities of a single biological species (humankind).
Over just the past few hundred years, human activities have clearly evolved from insignificance in terms of Earth System functioning to the creation of global-scale impacts that: 1) are approaching or exceeding in magnitude some of the great forces of nature; 2) operate on much faster time scales than rates of natural variability, often by an order of magnitude or more; 3) taken together in terms of extent, magnitude, rate and simultaneity, have produced a no-analogue state in the dynamics and functioning of the Earth System.
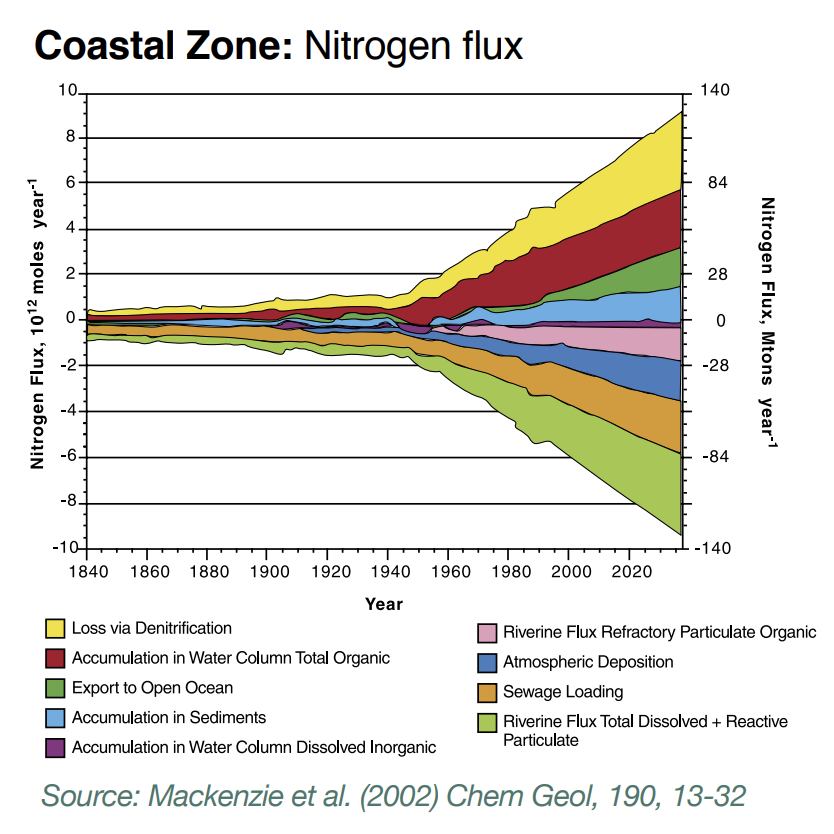
The Earth System cannot assimilate fast enough the large amounts of reactive N compounds created by humans, largely for fertilisers. Significant amounts of N are accumulating in vegetation, soils and groundwater, with leakage to the coastal zone and to the atmosphere.
Land degradation, soil erosion, eutrophication and pollution of both freshwater and marine aquatic systems, surface water acidification, salinization, non-linear changes in ecosystem structure and functioning and a wide range of multiple stresses arising from the combination of climate variability and human actions.
Societies can have little or no warning that a forcing factor is approaching a threshold, and by the time that the change in Earth System functioning is observed, it will likely be too late to avert the major change.
Thermohaline Circulation (THC): Consists of ocean currents driven by surface fluxes of heat and freshwater and subsequent interior mixing of heat and salt, and can be summarized as a global-scale deep overturning of water masses. A prominent feature of the THC is the sinking motion in the North Atlantic Ocean, which, as the water cools and sinks, releases vast amounts of heat to the atmosphere and makes northern Europe significantly warmer than other regions of the Earth at that latitude
The majority of global climate models indicate a reduction of the THC from 10% to 80% in response to increasing CO2 concentrations in the atmosphere for the next 100 years.
Virtually no analyses consider the psychological impacts or consequences of global change on individual humans and on their societies. Yet, in the final analysis, it will be the human perceptions of global change and the risks associated with it that will determine societal responses.
Humanity is already managing the planet, but in an unconnected and haphazard way driven ultimately by individual and group needs and desires. As a result of the innumerable human activities that perturb and transform the global environment, the Earth System is being pushed beyond its natural operating domain.
The most challenging scientific task of all is to build a common international framework for Earth System science that can harness the potential synergies that will arise from the interactions of tens of thousands of investigators, research groups and institutions around the world. The ultimate challenge, however, is directed towards the governance and management communities, as they must deal with the implications of Earth System science. How can a large group of independent nations with differing cultures, values, wealth, social organization and world views come together to manage their own single, connected life support system in a coherent and effective way?
As global change assumes a more central place in human affairs, science must accept the responsibility of developing and communicating the essential knowledge base societies can use to debate, consider and ultimately decide on how to respond to global change. Ultimately, upon this science the preservation of the Earth’s life support system depends.
____________________________________________________________________
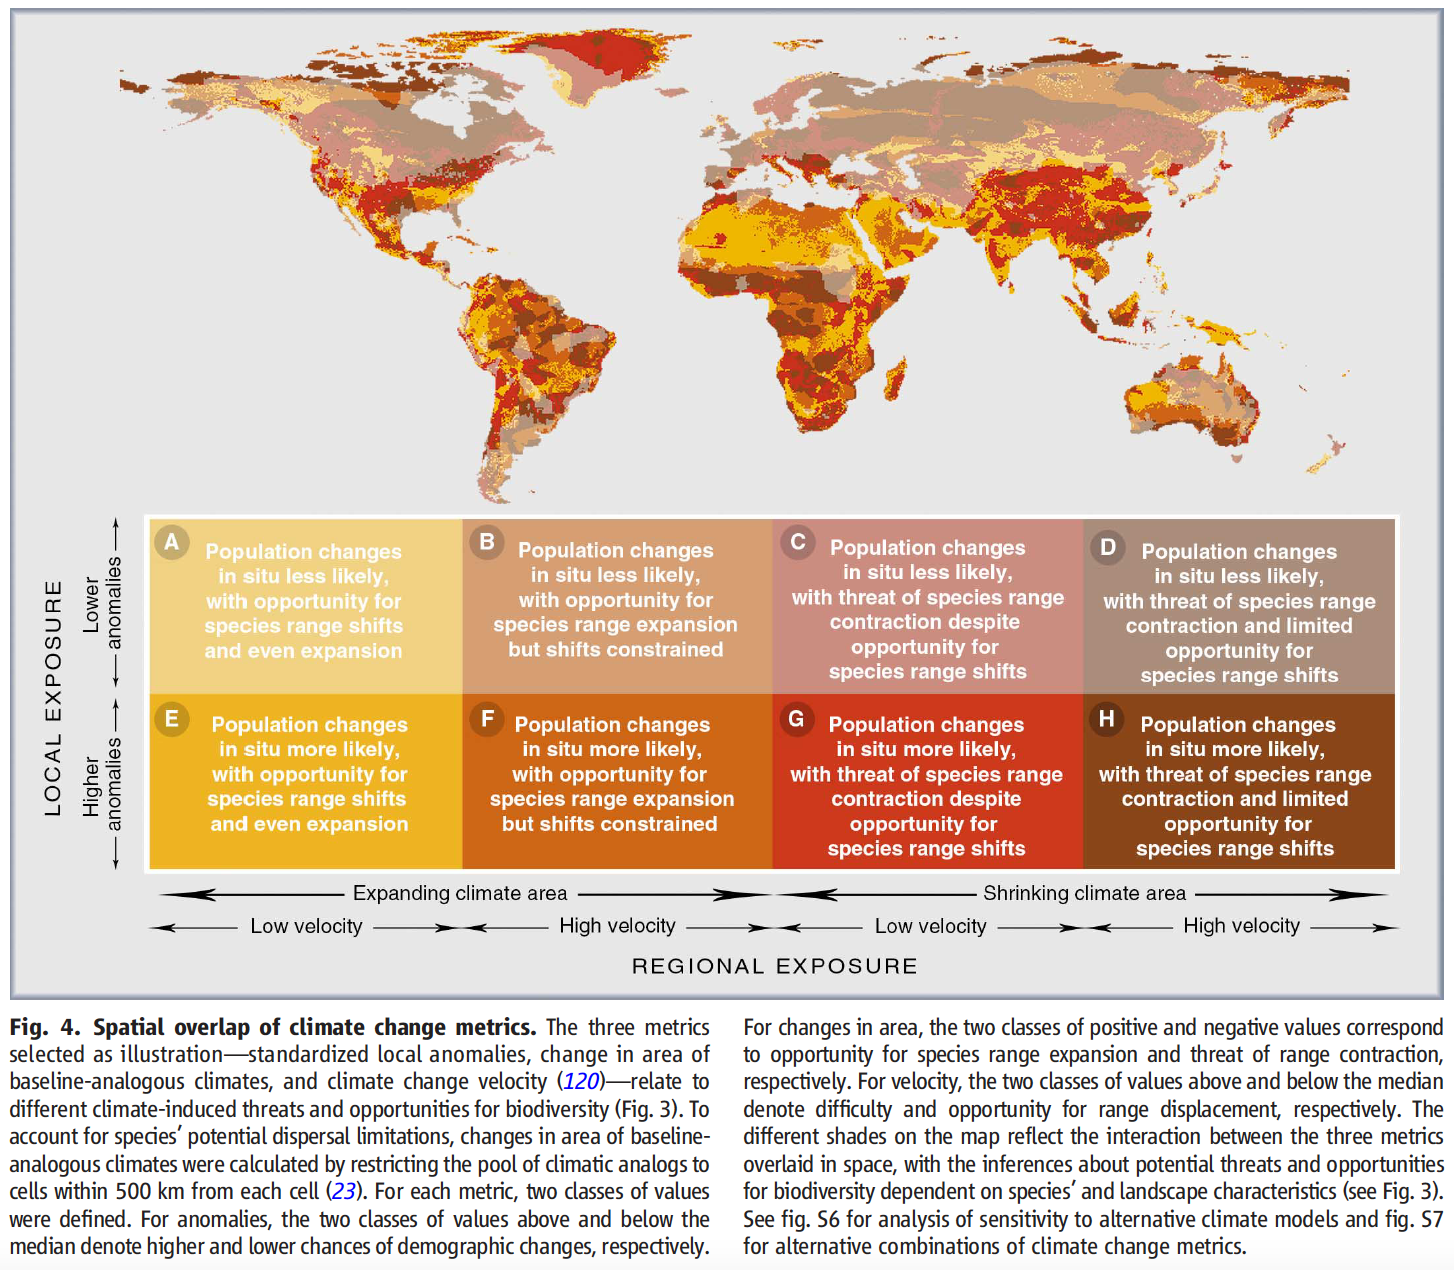
A New Method for Analyzing Socio-Ecological Patterns of Vulnerability by Kok
Ref: Kok et al (2015). A New Method for Analyzing Socio-Ecological patterns of Vulnerability. Regional Environmental Change.
Kok presents a method for the analysis of socio-ecological patterns of vulnerability of people being at risk of losing their livelihoods as a consequence of global environmental change. The proposed method consists of four steps that include both quantitative and qualitative analyses. To start, the socio-ecological system (SES) exposed to global environmental changes that will be studied needs to be determined. Next, the core dimensions that shape vulnerability in the socio-ecological system of interest need to be defined. Subsequently, a set of spatially explicit indicators that reflect these core dimensions is selected. Cluster analysis is used for grouping the indicator data. The clusters found, referred to as vulnerability profiles, describe different typical groupings of conditions and processes that create vulnerability in the socio-ecological system under study, and their spatial distribution is provided. Interpretation and verification of these profiles is the last step in the analysis.
Most frameworks for vulnerability analysis discussed in the literature distinguish between three components: exposure, sensitivity and coping/adaptive capacity.
One of the reasons that vulnerability studies are difficult to compare, relates to the different spatial scales on which they operate. Often, vulnerability analyses are local case studies that address the usually complex, context-specific situations that shape vulnerabilities of a particular group in a specific socio-ecological situation.
Global vulnerability assessments are based on aggregated data and rather crude assumptions about the underlying mechanisms being assessed.
Analyzing patterns of vulnerability helps to systematize outcomes of case studies with regard to the general, functional processes that shape vulnerability. Furthermore, this analysis does provide both global overviews and sub-national detail on the spatial distribution of these patterns. These insights can be used as entry points for developing policy responses to reduce vulnerability in different locations in which similar vulnerability-creating mechanisms play a role and facilitate learning across places. Furthermore, it renders a useful basis for understanding specific impacts in vulnerable situations, such as the occurrence of conflicts, through for example an overlay analysis (Sterzel et al. 2014) or migration.
Method for Analyzing Patterns of Vulnerability: For analyzing patterns of vulnerability within a chosen socio-ecological system, it is necessary to answer the following questions:
What are the main exposures, key vulnerable groups, their sensitivities and their coping and adaptive capacities?
What are the core dimensions of the patterns of vulnerability occurring in the socio-ecological system under investigation?
In which regions do we find similar vulnerability characteristics (vulnerability profiles)?
What do the different vulnerability profiles signify in terms of vulnerability-creating processes?
____________________________________________________________________
Thinking in Systems, A Primer by Meadows
Ref: Donella Meadows (2009). Thinking in Systems, A Primer. Taylor and Francis Group.
A system is more than the sum of its parts. It may exhibit adaptive, dynamic, goal-seeking, self-preserving, and sometimes evolutionary behavior.
Can you identify parts? . . . and Do the parts affect each other? . . . and Do the parts together produce an effect that is different from the effect of each part on its own? . . . and perhaps Does the effect, the behavior over time, persist in a variety of circumstances?
If a government proclaims its interest in protecting the environment but allocates little money or effort toward that goal, environmental protection is not, in fact, the government’s purpose. Purposes are deduced from behavior, not from rhetoric or stated goals.
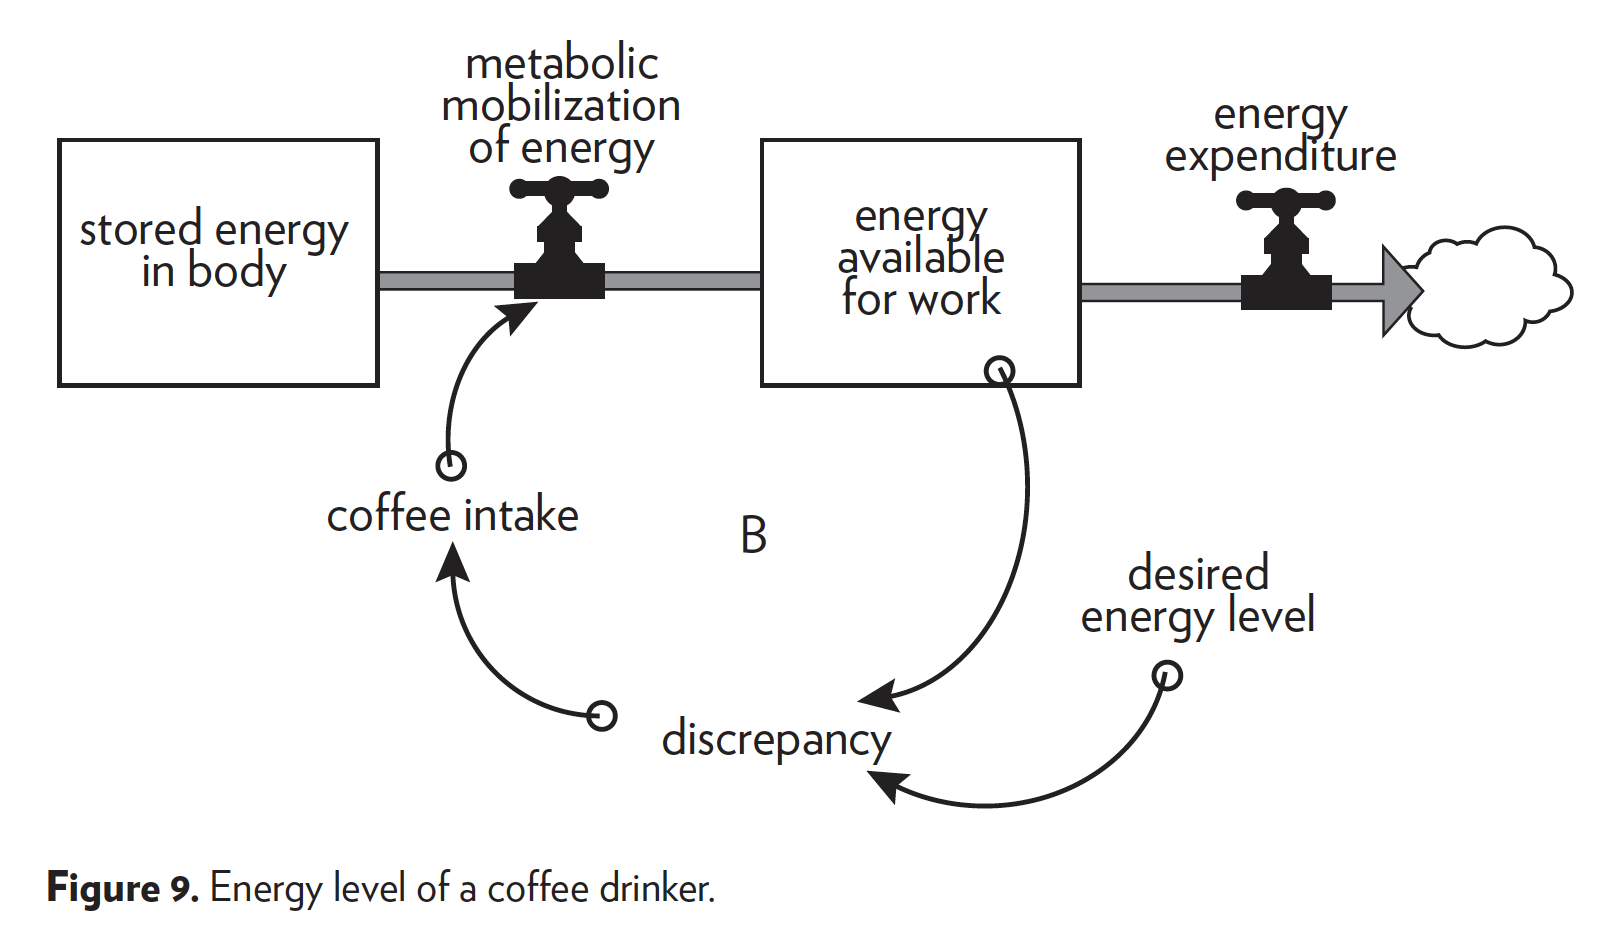
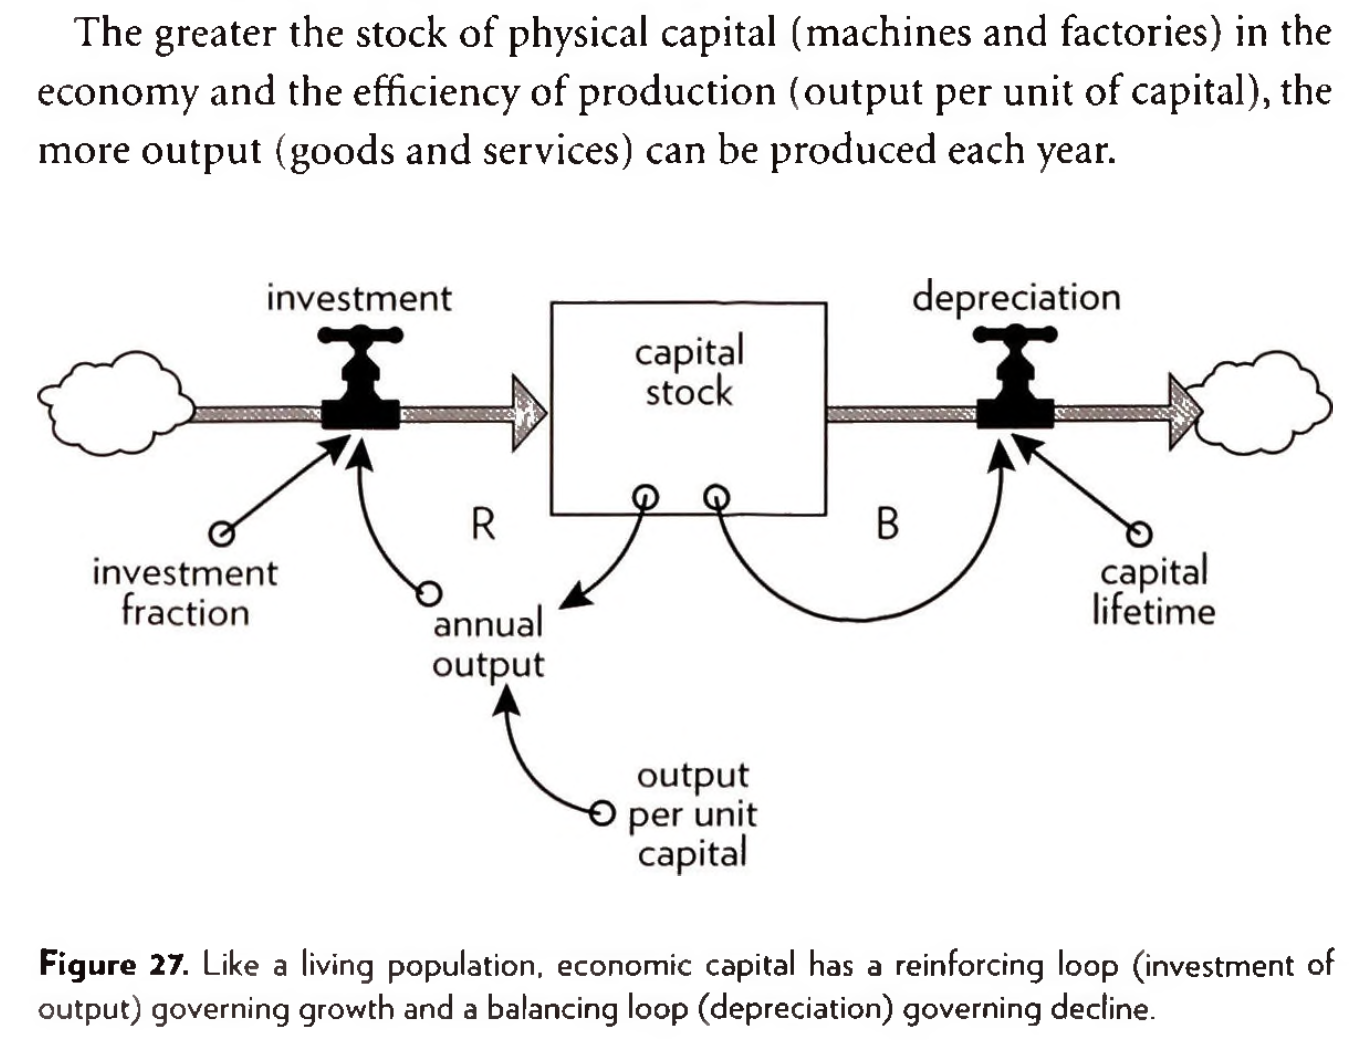
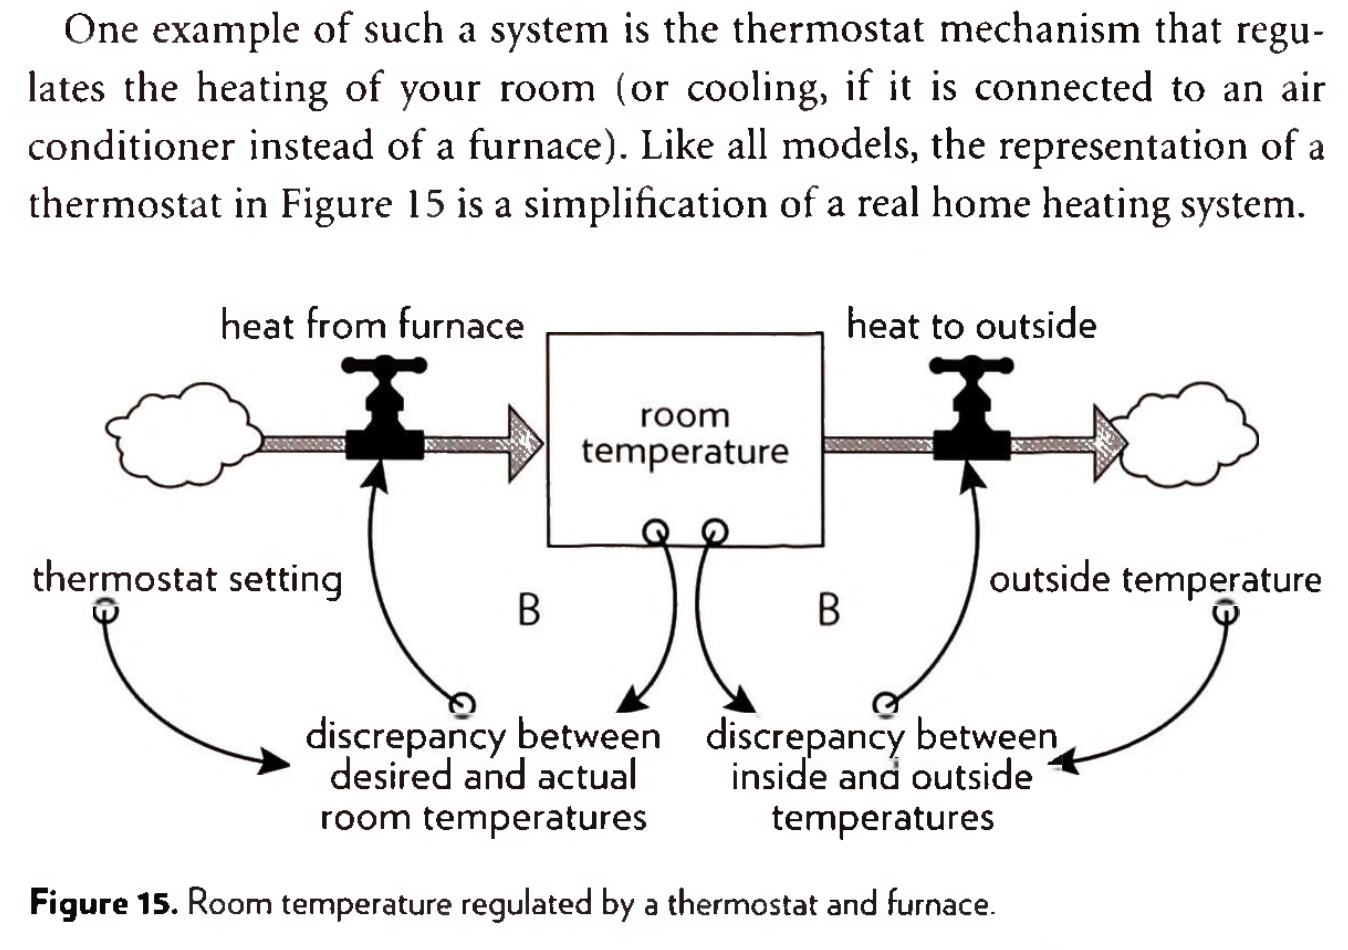
Systems thinkers see the world as a collection of stocks along with the mechanisms for regulating the levels in the stocks by manipulating flows. That means system thinkers see the world as a collection of “feedback processes.”
All system diagrams are simplifications of the real world.
Stop looking for who’s to blame; instead you’ll start asking, “What’s the system?” The concept of feedback opens up the idea that a system can cause its own behavior.
Dominance is an important concept in systems thinking. When one loop dominates another, it has a stronger impact on behavior. Because systems often have several competing feedback loops operating simultaneously, those loops that dominate the system will determine the behavior.
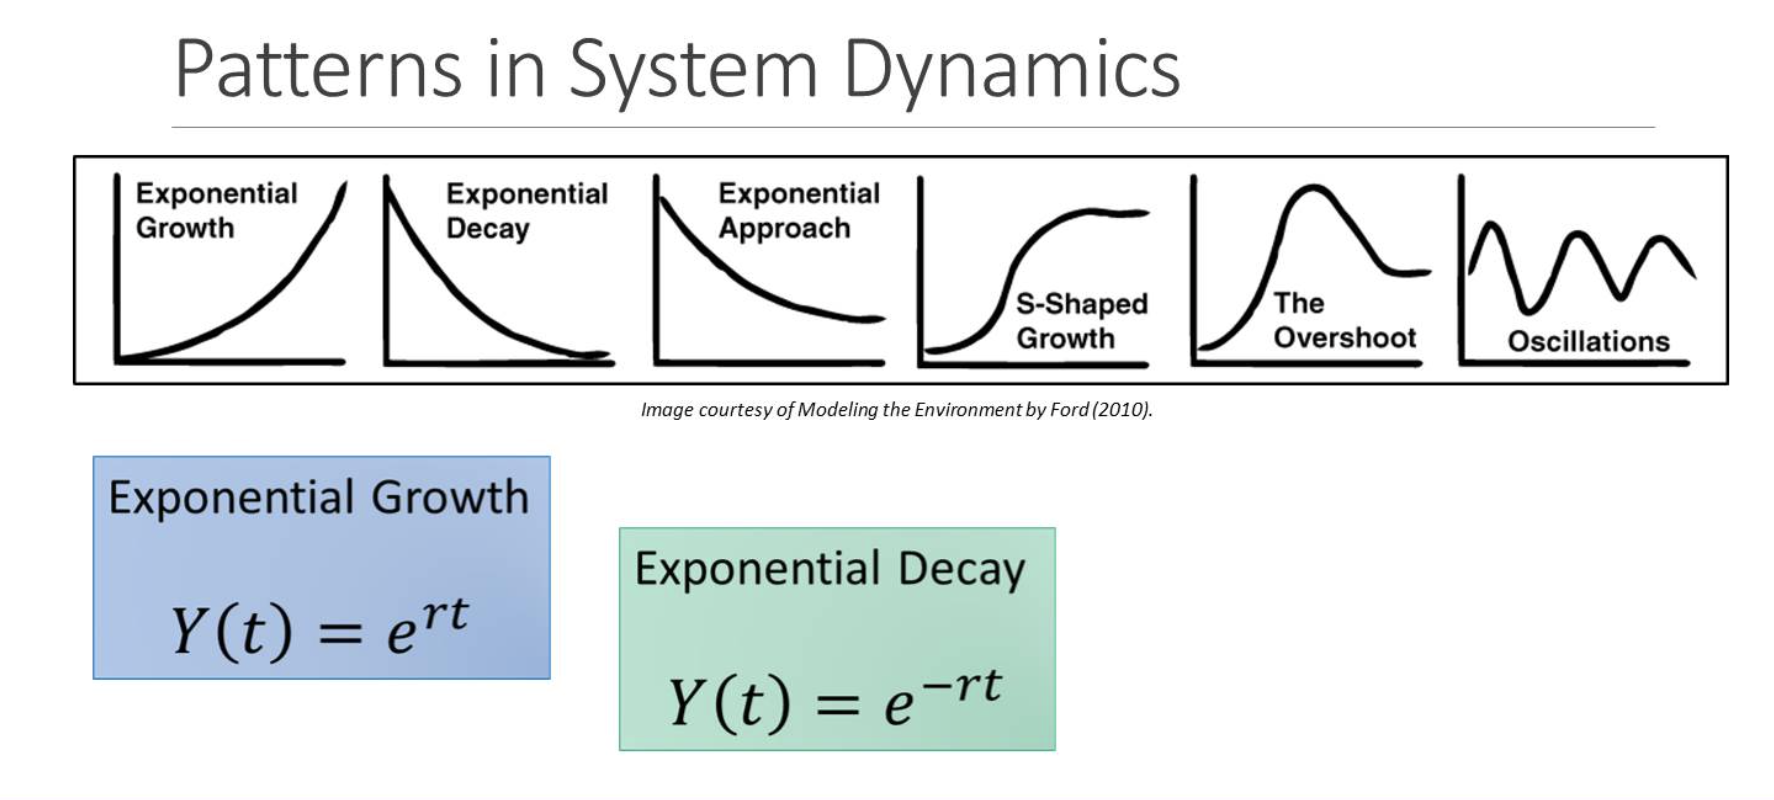
In physical, exponentially growing systems, there must be at least one reinforcing loop driving the growth and at least one balancing loop constraining the growth, because no physical system can grow forever in a finite environment.
Resources
Nonrenewable resources are stock limited. The entire stock is available at once, and can be extracted at any rate (limited mainly by extraction capital). But since the stock Is not renewed, the faster the extraction rate, the shorter the lifetime of the resource.
Renewable resources are flow- limited. They can support extraction or harvest Indefinitely, but only at a finite flow rate equal to their regeneration rate. If they are extracted faster than they regenerate, they may eventually be driven below a critical threshold and become, for all practical purposes, nonrenewable.
Three sets of possible behaviors of renewable systems:
Overshoot and adjust to a sustainable equilibrium.
Overshoot beyond that equilibrium followed by oscillations.
Overshoot followed by collapse of the resource and the industry dependent on it.
Outcome to this depends on two things:
Critical threshold beyond which the resource population’s ability to regenerate itself is damaged.
The rapidity and effectiveness of the balancing feedback loop that slows capital growth as the resource becomes depleted.
System Design
Function: The purpose of a nonhuman system.
Purpose: The function of a human system.
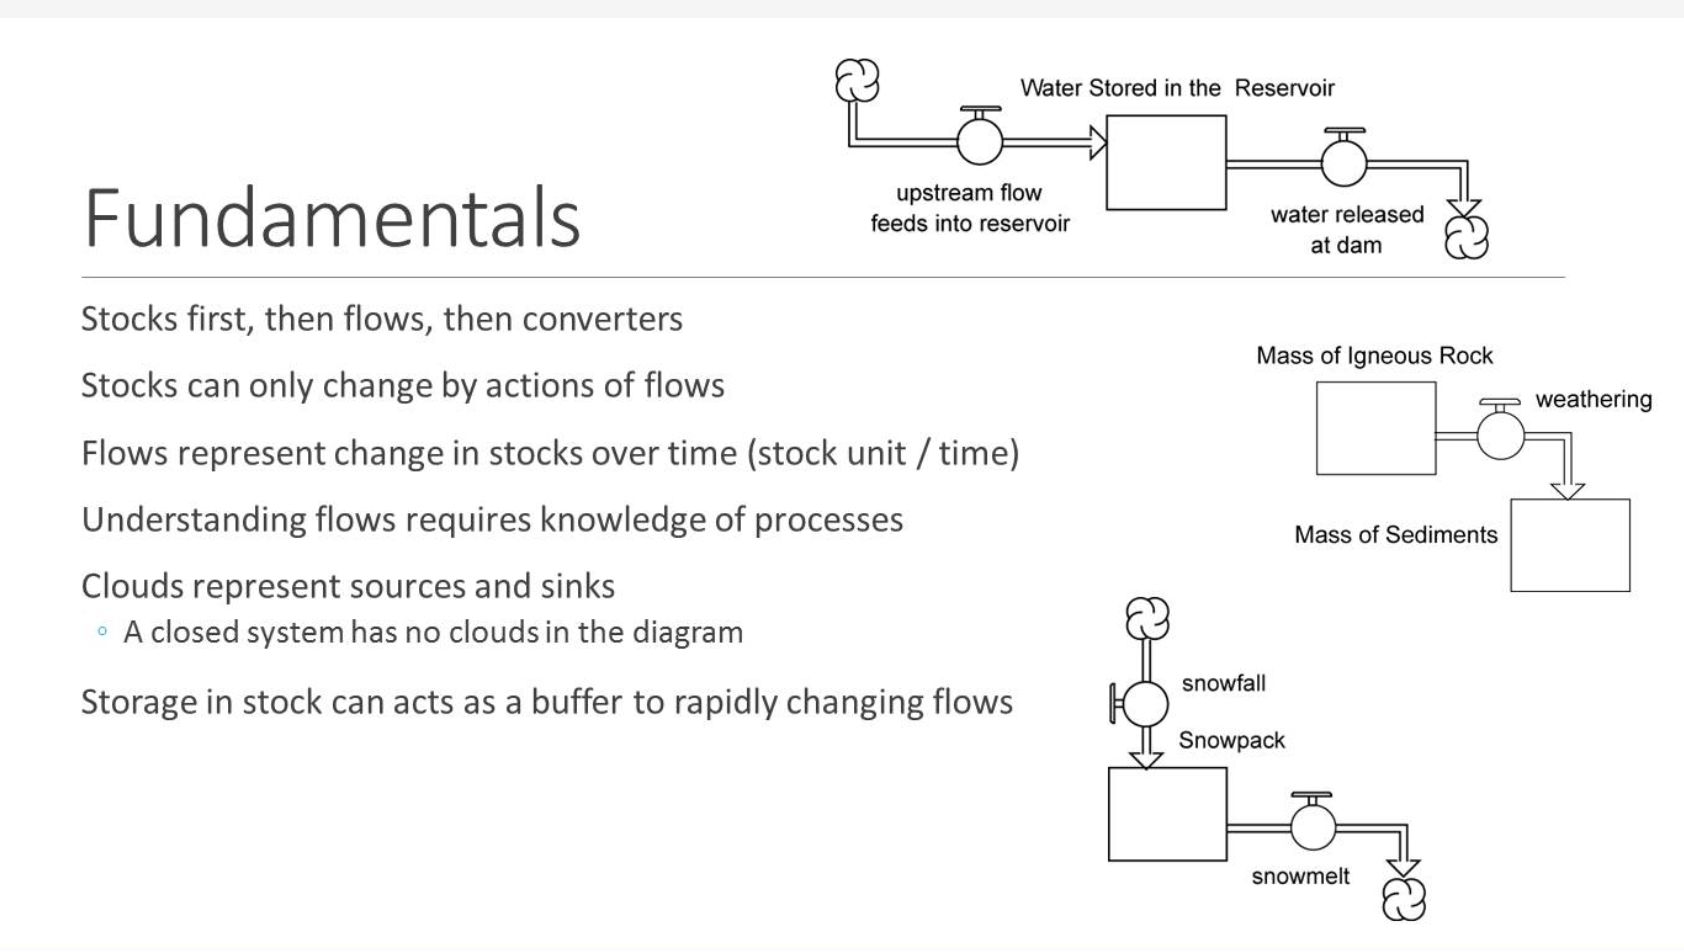
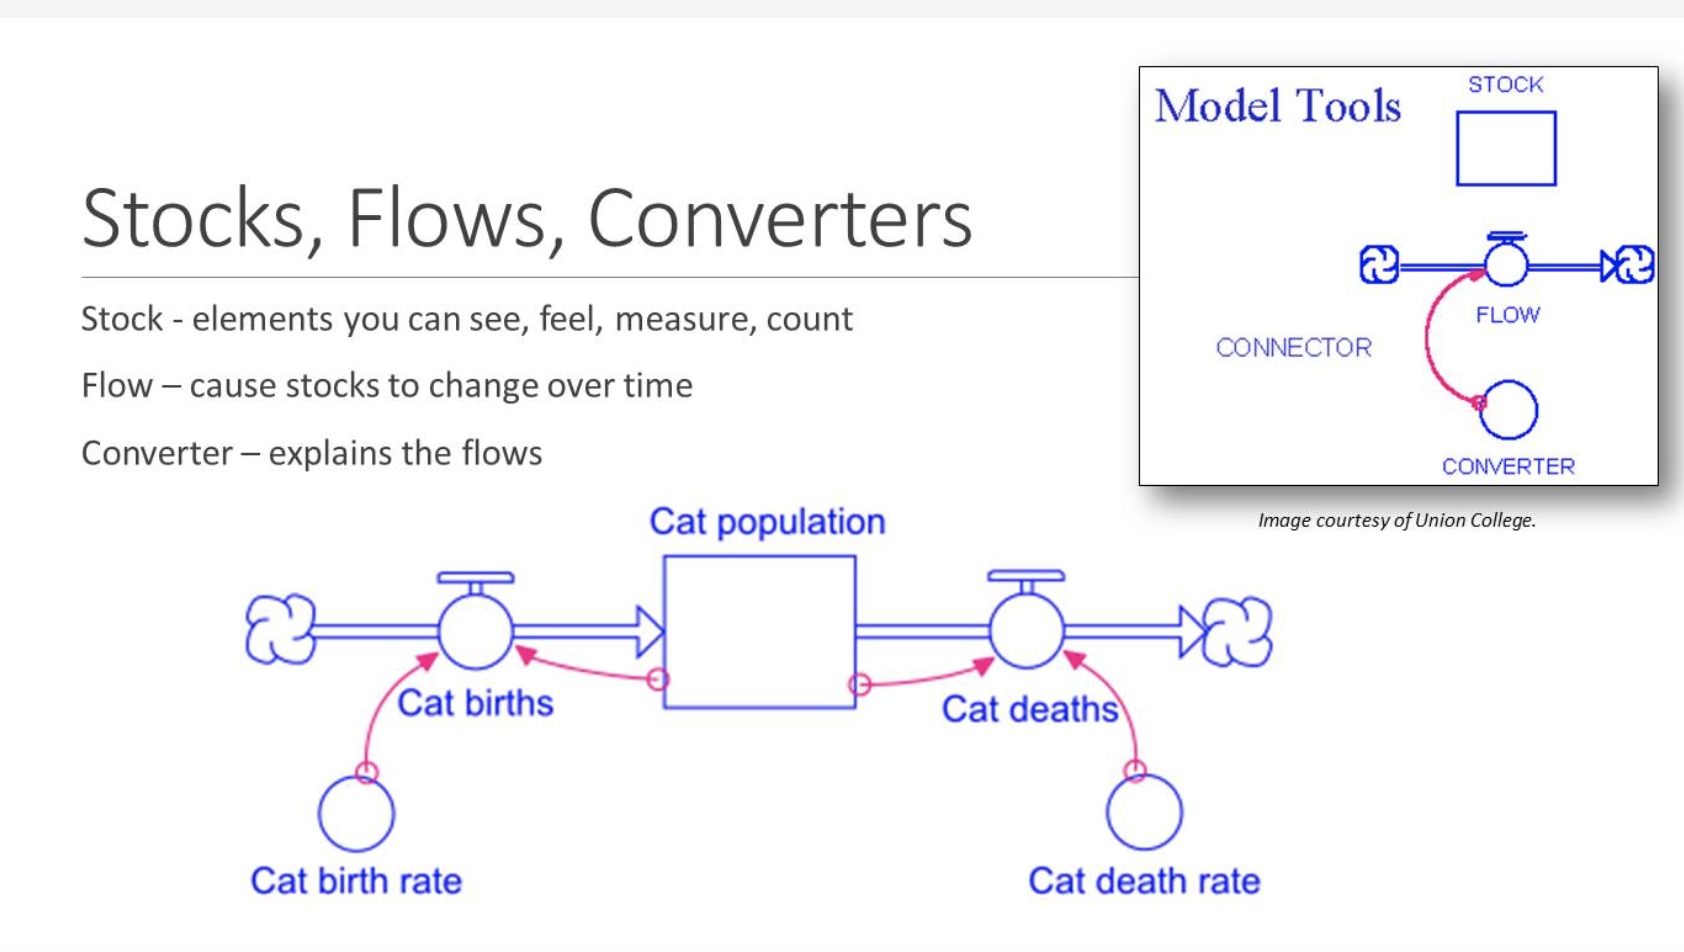
Stock: The foundation of a system; an element of a system that you can see, feel, count, or measure at any given time. A system stock is a store, a quantity, an accumulation of material or information that has built up over time.
Stocks change over time through the actions of a flow.
Flow: How stocks change over time; filling and draining, births and deaths, purchases and sales, growth and decay, deposits and withdrawals, successes and failures.
Time: The horizontal axis; allows you to ask questions about what came before, and what might happen next.
Stock takes time to change, because flows take time to flow. Stocks usually change slowly. They can act as delays, lags, buffers, ballast, and sources of momentum in a system.
Feedback Loop: A close chain of causal connections from a stock, through a set of decisions or rules or physical laws or actions that are dependent on the level of the stock, and back again through a flow to change the stock. Formed when changes in a stock affect the flows into or out of that same stock.
If you see a behavior that persists over time, there is likely a mechanism creating that consistent behavior. That mechanism operates through a feedback loop. It is the consistent behavior pattern over a long period of time that is the first hint of the existence of a feedback loop.
Feedback loops can cause stocks to maintain their level within a range or grow or decline. In any case, the flows into or out of the stock are adjusted because of changes in the size of the stock itself.
Balancing feedback loops are equilibrating or goal-seeking structures in systems and are both sources of stability and sources of resistance to change.
Feedbacks—the interconnections, the information part of the system—can fail for many reasons. Information can arrive too late or at the wrong place. It can be unclear or incomplete or hard to interpret. The action it triggers may be too weak or delayed or resource constrained or simply ineffective.
A delay in a balancing feedback loop makes a system likely to oscillate.
Any physical, growing system is going to run into some kind of constraint, sooner or later. That constraint will take the form of a balancing loop that in some way shifts the dominance of the reinforcing loop driving the growth behavior, either by strengthening the outflow or by weakening the inflow.
Reinforcing Feedback Loop (R ): Generates more input to a stock the more that is already there (and less input the less that is already there). A reinforcing feedback loop enhances whatever direction of change is imposed on it. Reinforcing feedback loops are self-enhancing, leading to exponential growth or to runaway collapses over time. They are found whenever a stock has the capacity to reinforce or reproduce itself.
____________________________________________________________________
Global Sustainability, A Nobel Cause by Luther
Ref: Luther et al (2010). Global Sustainability, A Nobel Cause. Cambridge University Press.
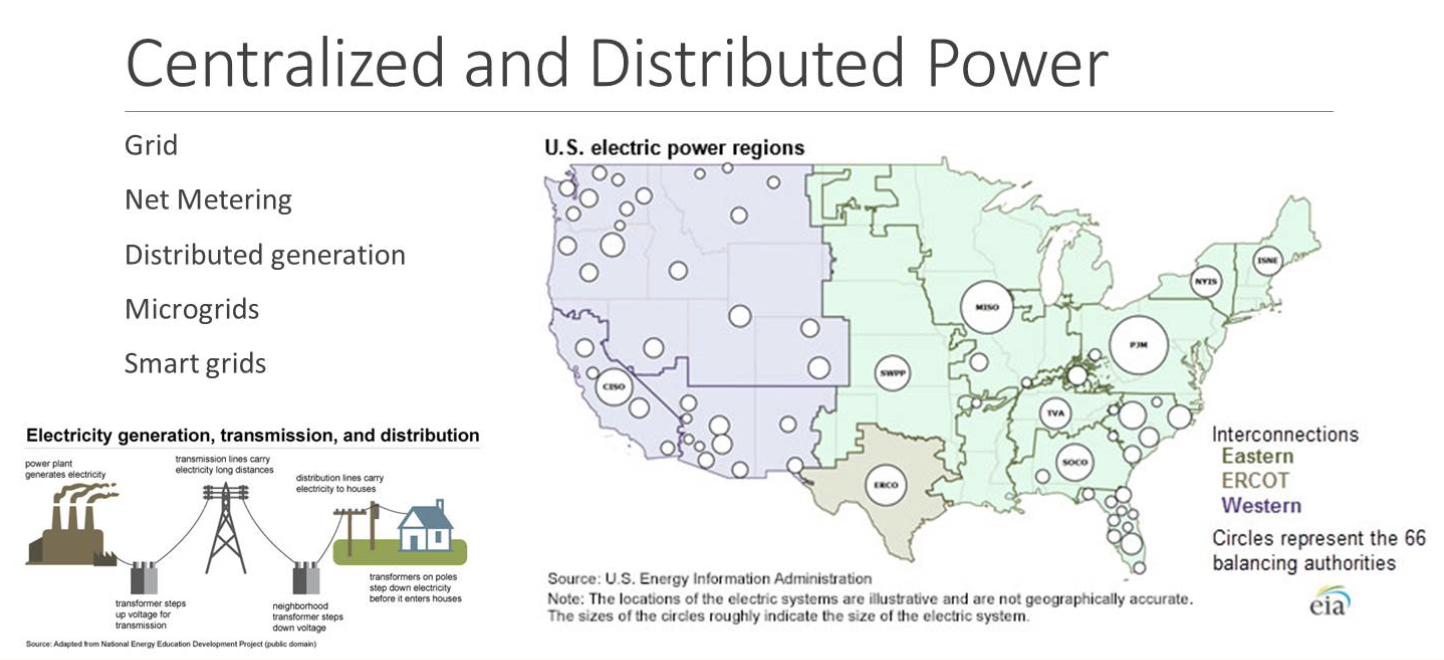
Buildings characterized by an extremely low demand for external energy input for heating and AC, and to a highly efficient transport system based largely on electric batteries, biofuels, and novel fuels like hydrogen (generated using electricity from renewable sources) or H derivatives.
The answer has several principal components: 1. distributed energy generation and smart grids; 2. energy meteorology; 3. smart loads; 4. careful use of dispatchable sources for electricity generation; and 5. energy storage systems (both centralized and decentralized).
Renewable energy sources - particularly solar, wind and biomass - are characterized by a relatively low spatial power density (W/m2).
By applying the concepts of smart grids, smart loads and energy storage, grids with a high penetration of fluctuating energy inputs from solar and wind sources can be designed and operated reliably, while at the same time maintaining a high degree of energy security and power quality.
As a rule of thumb, the larger the spatial extension of such a grid, the smaller the (relative) investment needed to construct and to operate the energy supply system.
Political will, coherence and a suitable global financing scheme are required to transform today’s energy supply system towards sustainability.
____________________________________________________________________
Creating Chemistry by BASF
Ref: BASF (Nov, 2020). Creating Chemistry. BASF’s Sustainability Magazine, Diet for Earth. Issue Nine.
As Western-style diets become more popular in rapidly developing countries, demand for meat is growing.
In Sub-Saharan Africa, many people could benefit from the protein and iron gained through eating more meat.
Recent trends suggest there is actually a growing awareness, particularly among your urban consumers, that we need to eat less meat. There has been a rise in “flexitarians”- people who have a primarily vegetarian diet but occasionally eat meat or fish. A survey in the UK found that 14% of the British identify as Flexitarian.
In 2018, 16% of all new food product launches were vegan.
Variations on Meat-Free Monday’s have spread to more than 40 countries in the past 10 years.
It is the soy leghemoglobin, containing the Fe-rich molecule heme, that gives vegan burgers their meaty flavor.
Agriculture
Traditional farming involves tilling the soil to clean the field of weeds and remnants of the old crop before the planting for the new season.
No-Till: Soil is left undisturbed with its organic matter and nutrients intact. The residue from the previous crop acts as cover to maintain the moisture in the soil. By not disturbing the soil we create a more stable surface that absorbs more water. The soil is well-structed and is getting good yields.
Meeting the nutritional needs of the world’s population in 2050 means increasing the global food production to 50% compared to 2013, according to the FAO.
Sustainable Intensification: Grow more on existing farmland without increasing negative impacts on the environment.
Microdosing: A way of using fertilizer more efficiently- in which a small quantity of fertilizers are applied directly in the seed hole. It requires only a tenth of the fertilizer typically used. When the method was trialed by 25,000 farmers in Mali, Niger, and Burkina Faso between 2009-2012, sorghum and millet yields increased by up to 120%. The downside is it’s very labor intensive.
Sustainable Agriculture: Meeting our needs today in a way that leaves it possible for future generations to meet theirs. That involves providing enough safe and nutritious food for a growing population at an affordable price and in a way that is profitable for farmers with as little as possible negative impact on the environment.
Encouraging natural predators is one part of integrated pest management, a practice based on using a variety of pest-control methods and techniques.
Cattle are major emitters of CH4. Researchers at UC have found that cattle feed containing 1% seaweed cuts methane production by up to 60%.
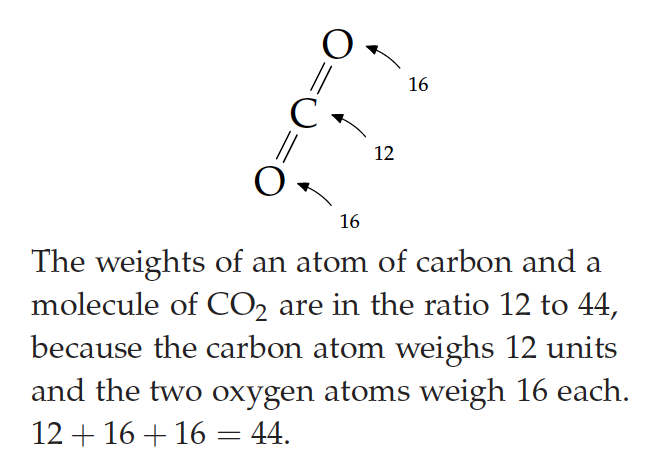
Carbon Dioxide (CO2): A natural, non-toxic by-product of the breathing of many living creatures, and is also released when wood, coal, oil, or gas are burned. It has a very small concentration in the air, at only .04%. However, it plays a big part as a GHG. CO2 absorbs a proportion of the heat given off by the Earth into space and reflects it back.
Insects
Insects are involved in many ecological processes, like recycling dead organic matter, whether its dung, dead plants and trees, or dead animals. This is one of the basic processes of life. If nutrients aren’t recycled into new fertile soil, there is no way plants can grow. Then there is pollination. Three-quarters of our crop types are dependent on insect pollination. That includes fruits, vegetables, and a lot of nuts. Insects are also necessary as food for a lot of the bigger animals, such as birds.
The Krefeld study in Germany found that flying insect biomass had declined by 75% in just 27 years.
The Krefeld study involved a large number of volunteers who made their data available to scientists. One assumes that the volunteers went repeatedly to many sites and monitored the populations over 27 year, but most sites were visited only once, 20 were visited twice, and only one was visited regularly for 4 years. These were pieced together into a time series of insect biomasses. These aren’t species changes but overall sample weight changes in the insect community sampled. We work differently because we identify all aphids and larger moths to species, and many other insect groups, too. We also monitor all our sites daily and some have been running for more than 50 years. Insect populations vary naturally, so to get something meaningful you need a long stretch of time to see the big picture. Our study is the world’s longest standardized time series on invertebrates. We report principally on aphids and moths. Over the long term, the overall abundance of Britain’s larger moths is declining at a rate of 28%. On the other hand, one third of moth species are increasing. One example is the lichen-feeding moths. Lichen is very sensitive to pollution. Clean air legislation means there is more lichen. The numbers of some of those moths have increased over 1000% since the UK Clean Air Acts of the 1990s. Estimates for aphids vary between a rise of 3% to a decline of 3.2%. In another study we looked at biomass trends, rather than number of individuals, at four sites. We found that one of the sites was in decline. But that was explained by the decline of one very heavy fly, the fever fly, which was biasing the samples.-James Bell, Quantitative Ecologist.
One of the initial big drivers of insect declines is the conversion of land from natural habitat into agriculture that supports a vastly lower range of species.
Insects are vulnerable to agrochemicals, changes in land use, managed landscapes, and the effects of global warming.
At a local level, citizen science programs are very useful as they help to organize information and local practices. Training children is also needed. All information about pollinators, their use and conservation, is important, as it creates a connection with nature and raises awareness about the need to improve the quality of our environment- Vera Lucia Imperatriz-Fonseca.
Three main drivers that cause declines in insect populations: loss of habitat and food sources, climate change, and pollution of soil and water.
It’s easy to be aware of all the bad things happening in the world. It’s harder to know about the good things: billions of improvements that are never reported. Hans Rosling is by no means an incorrigible optimist, but identifies himself as a possibilist. Both are correct. The world is both bad and better…that is how we have to think about the current state of the world. This means paying close attention and observing long-term trends but also not overlooking fluctuations. To keep in mind that we all tend to simplifications and generalizations. Critically scrutinize your own perception and check the facts. Mistrust extreme examples.
Constructive Journalism: Not just reporting on problems, but also pointing out solutions.
____________________________________________________________________
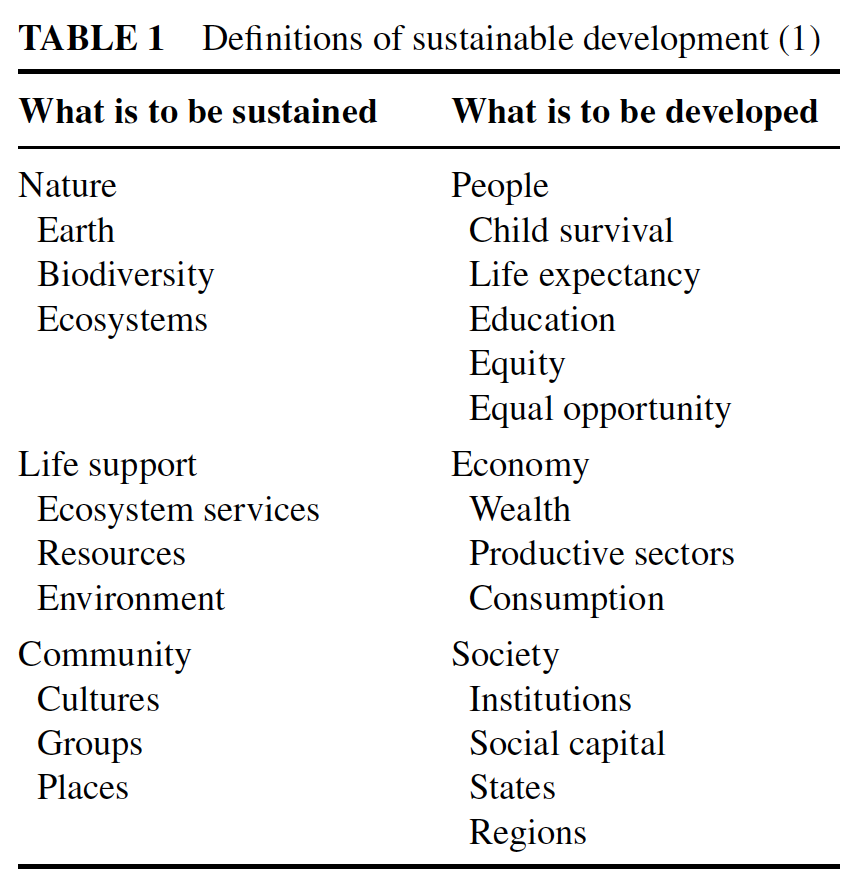
Sustainability Values, Attitudes, and Behaviors: A Review of Multinational and Global Trends by Leiserowitz
Ref: Leiserowitz et al (2006). Sustainability Values, Attitudes, and Behaviors: A Review of Multinational and Global Trends. Annual Reviews Environmental Resources, 31.
There is a need for changes in human values, attitudes, and behaviors in order to achieve a sustainability transition that will meet human needs and reduce hunger and poverty while maintaining the life support systems of the planet.
Values: Abstract ideals, such as freedom, equality, and sustainability. They often evoke emotional reactions and are typically expressed in terms of good or bad, better or worse, desirability or avoidance. Values define or direct us to goals, frame our attitudes, and provide standards against which the behavior of individuals and societies can be judged.
Four grand values that emerged in the collective aspirations of the world’s peoples following WWII: peace, freedom, development, and environment.
Attitudes: The evaluation of a specific object, quality, or behavior as good or bad, positive or negative. Attitudes often derive from and reflect abstract values.
Behavior: Concrete decisions and actions taken by individuals and groups, which are often rooted in underlying values and attitudes.
Sustainable development emerged out of the effort to reconcile the competing demands of development and environmental protection beginning with the 1972 Stockholm Conference on the Human Environment and the 1980 World Conservation Strategy of the International Union for the Conservation of Nature.
Sustainable development became a formal world aspiration in 1987 with the report of the World Commission on Environment and Development entitled Our Common Future (Bruntland Report).
Life Support Systems: Natural resources and services requisite for the utilitarian life support of humankind.
World Commission on Environment and Development: Created “a universal declaration” that would “consolidate and extend relevant legal principles” creating “new norms…needed to maintain livelihoods and life on our shared planet” and “to guide state behavior in the transition to sustainable development.” Launched in 1994, the Initiative claims to be “the most open and participatory consultation process ever conducted in connection with an international document.
Millennium Declaration: Outlines 60 goals for peace; development; the environment; human rights; the vulnerable, hungry, and poor. “We consider certain fundamental values to be essential to international relations in the 21c. These include:
Freedom: Men and women have the right to live their lives and raise their children in dignity, free from hunger and from the fear of violence, oppression or injustice. Democratic and participatory governance based on the will of the people best assures these rights.
Equality: No individual and no nation must be denied the opportunity to benefit from development. The equal rights and opportunities of women and men must be assured.
Solidarity: Global challenges must be managed in a way that distributes the costs and burdens fairly in accordance with basic principles of equity and social justice. Those who suffer or who benefit least deserve help from those who benefit most.
Tolerance: Human beings must respect one or another, in all their diversity of belief, culture and language. Differences within and between societies should be neither feared nor repressed, but cherished as a precious asset of humanity. A culture of peace and dialogue among all civilizations should be actively promoted.
Respect for Nature: Prudence must be shown in the management of all living species and natural resources, in accordance with the precepts of sustainable development. Only in this way can the immeasurable riches provided to us by nature be preserved and passed on to our descendants. The current unsustainable patterns of production and consumption must be changed in the interest of our future welfare and that of our descendants.
Shared Responsibility: Responsibility for managing worldwide economic and social development, as well as threats to international peace and security, must be shared among the nations of the world and should be exercised multilaterally. As the most universal and most representative organization in the world, the UN must play the central role.”
Great Transition Scenario: Values change as intrinsic to its success.
I = PAT Identity: environmental impact (I) is a function of population (P), affluence (A), and technology (T).
D = PAE: Development (D) is a function of population (P), affluence (A), and entitlements and equity (E).
Access to entitlements—the bundle of income, natural resources, familial and social connections, and societal assistance that are key determinants of hunger and poverty—has recently declined with the emergence of market-oriented economies in Eastern and Central Europe, Russia, and China; the rising costs of entitlement programs in the industrialized countries, including access to and quality of health care, education, housing, and employment; and IMF–recommended structural adjustment programs in developing countries.
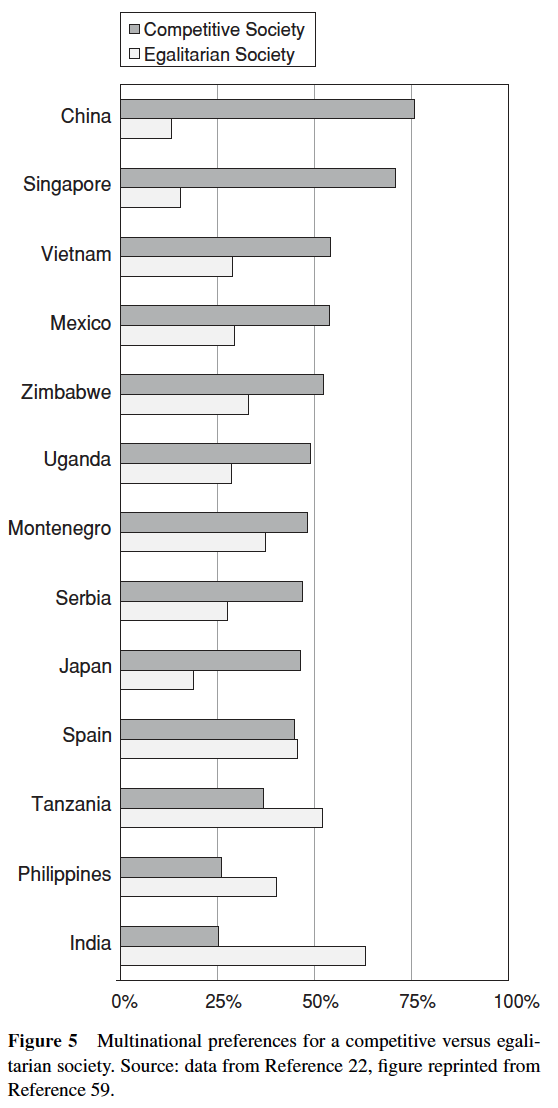
48% of respondents from 13 countries preferred a “competitive society, where wealth is distributed according to one’s achievement,” whereas 34% preferred an “egalitarian society, where the gap between rich and poor is small, regardless of achievement.” Interestingly, two of the largest and most rapidly industrializing countries in the world had opposing views of this issue, with 75% of respondents in China preferring a competitive society, whereas 60% of respondents in India preferred an egalitarian society. Worldwide, 58% of respondents agreed with the statement “most people are better off in a free market economy, even though some people are rich and some are poor.”
Globalization: The widening, deepening and speeding up of global interconnectedness.
The limited data suggest that, although large majorities worldwide believe the gap between rich and poor is widening, many also prefer competitive economic systems that produce income inequalities while rewarding individual incentive over more egalitarian systems.
1984, many US states started requiring automobile passengers to wear seat belts, leading to a dramatic increase in the number of lives saved in auto accidents.
Large majorities worldwide value both environmental protection and economic prosperity. Yet these two values often conflict in particular situations, as difficult choices have to be made between species protection versus commercial exploitation, forest protection versus logging, or shifting to cleaner, but more expensive energy sources versus the exploitation of polluting, but cheap fossil fuels, e.g., coal. Further, these collective decisions are often made even more difficult because some decision makers are willing to compromise and trade off particular values, whereas others consider certain values absolute and view any effort to compromise them as taboo. Thus, most debates over social policies, decisions, and actions are fundamentally disagreements over the relevance and priority of particular values.
Sustainable development, at the most abstract level, emphasizes the values of economic development, environmental protection, and social progress/equity.
____________________________________________________________________
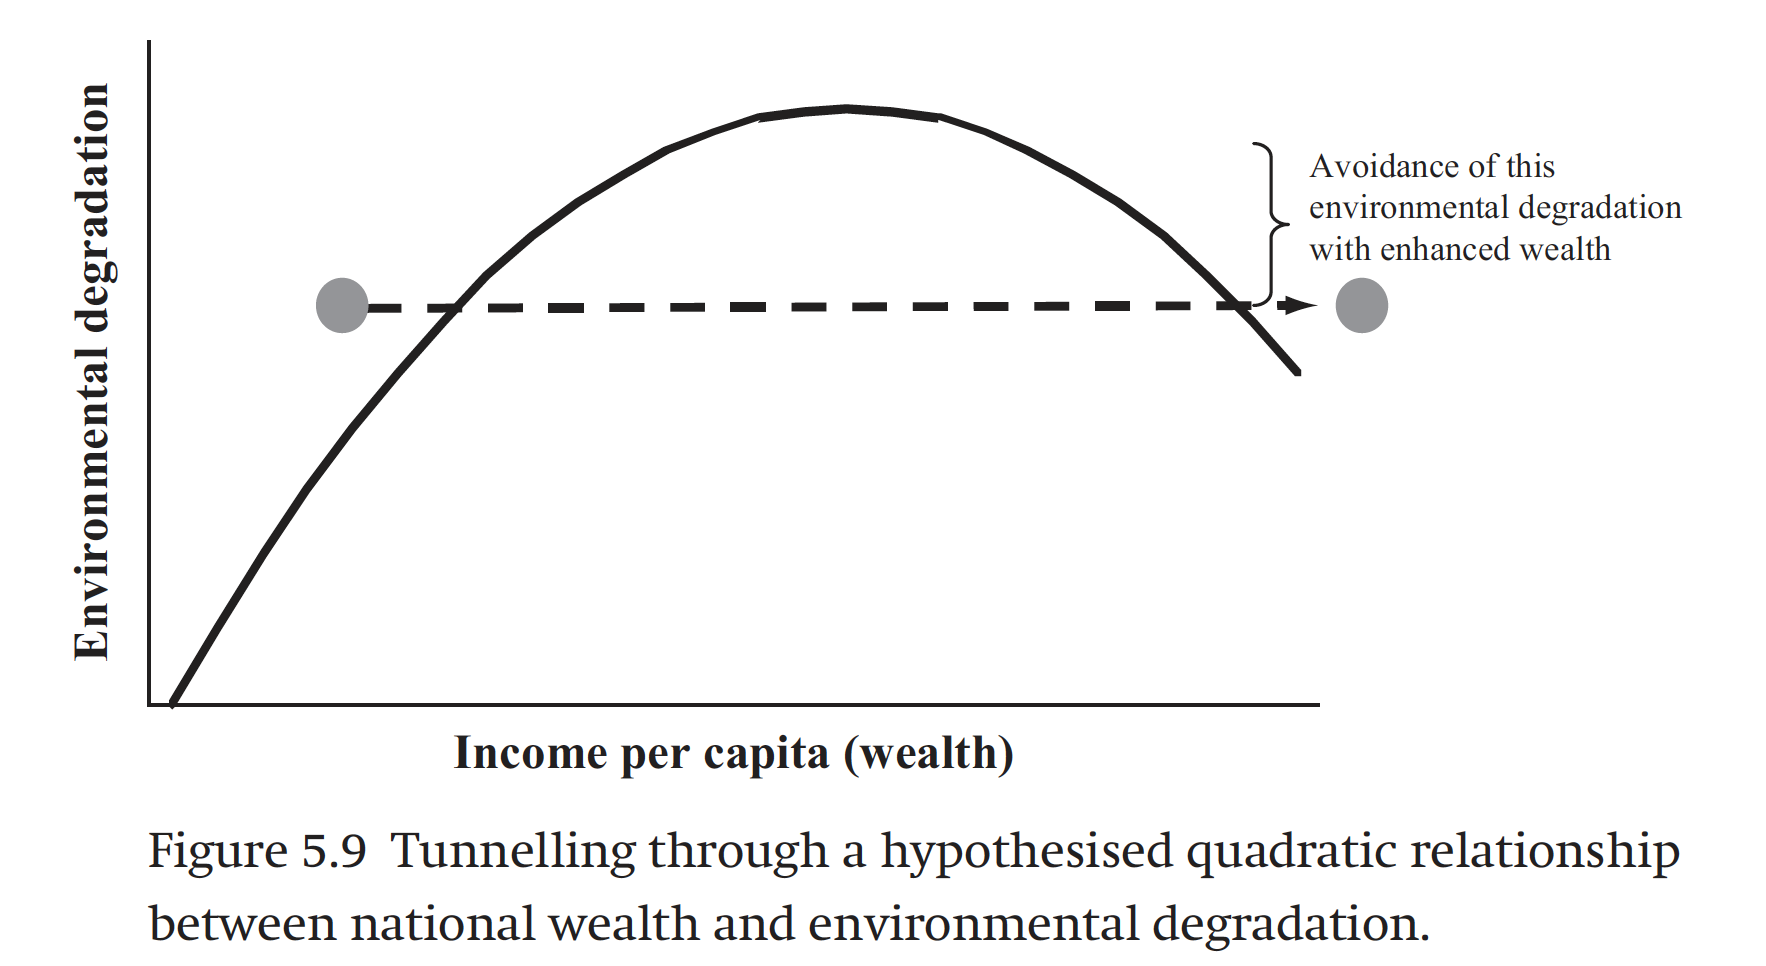
The Environmental Kuznets Curve by Yandle
Ref: Yandle et al (unk).The Environmental Kuznets Curve, A Primer.
Environmental Quality- A luxury good?
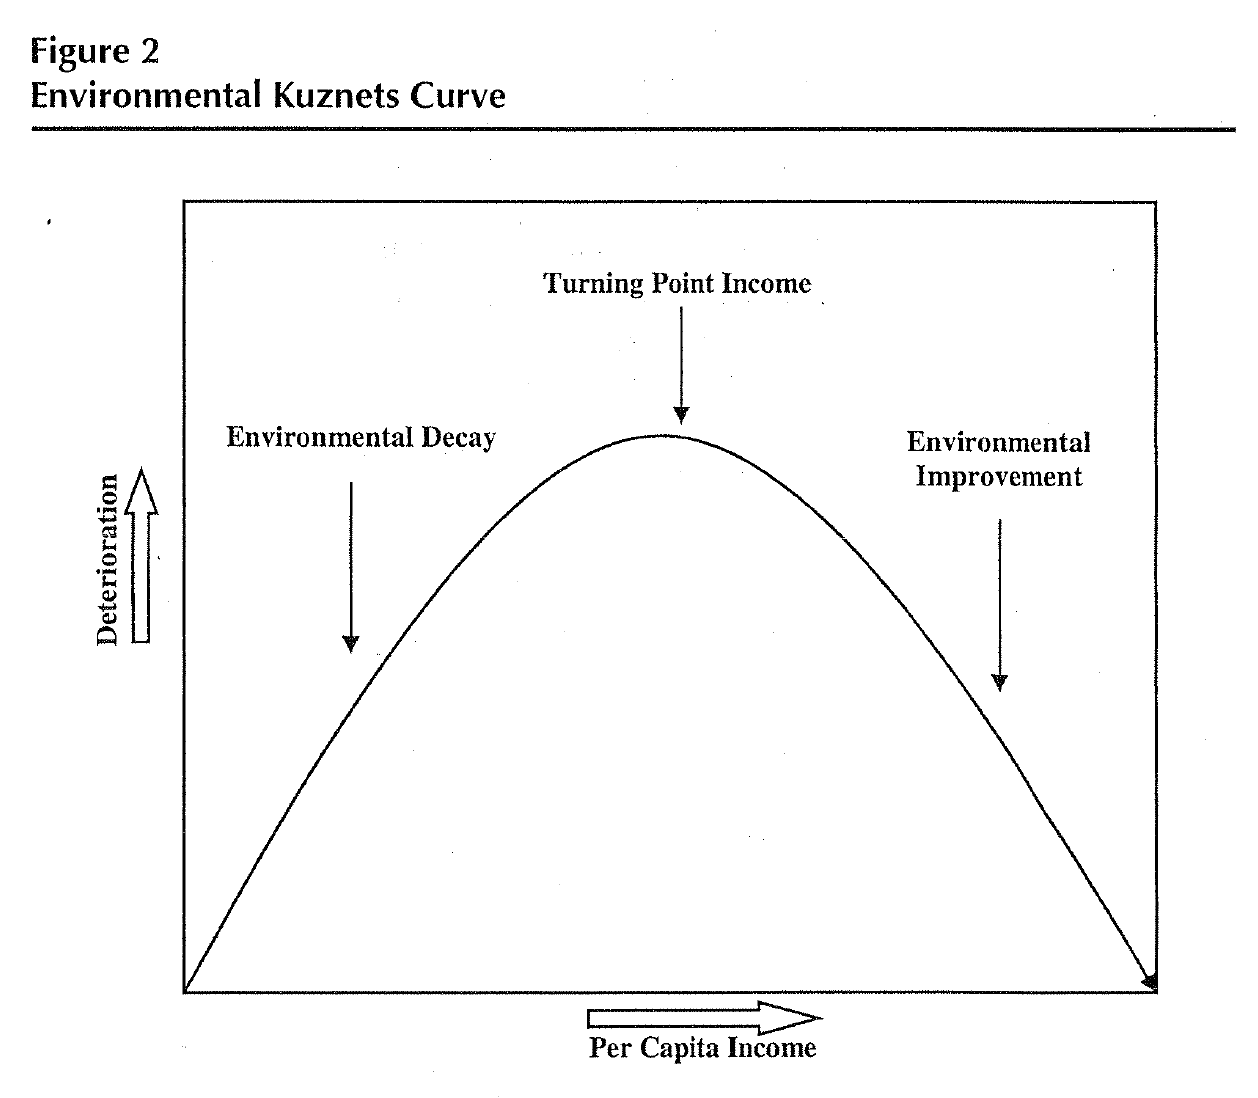
1991: Economists first report a systematic relationship between income changes and environmental quality (EKC).
Early estimates showed that some important indicators of environmental quality such as the levels of SO2 and particulates in the air actually improved as income and levels of consumption went up.
1971: Vernon Ruttan in his presidential address to the American Agricultural Economics Association, hypothesized the luxury nature of environmental quality when he said: “In relatively high-income economies the income elasticity of demand for commodities and services related to sustenance is low and declines as income continues to rise, while the income elasticity of demand for more effective disposal of residuals and for environmental amenities is high and continues to rise. This is in sharp contrast to the situation in poor countries where the income elasticity of demand is high for sustenance and low for environmental amenities.”
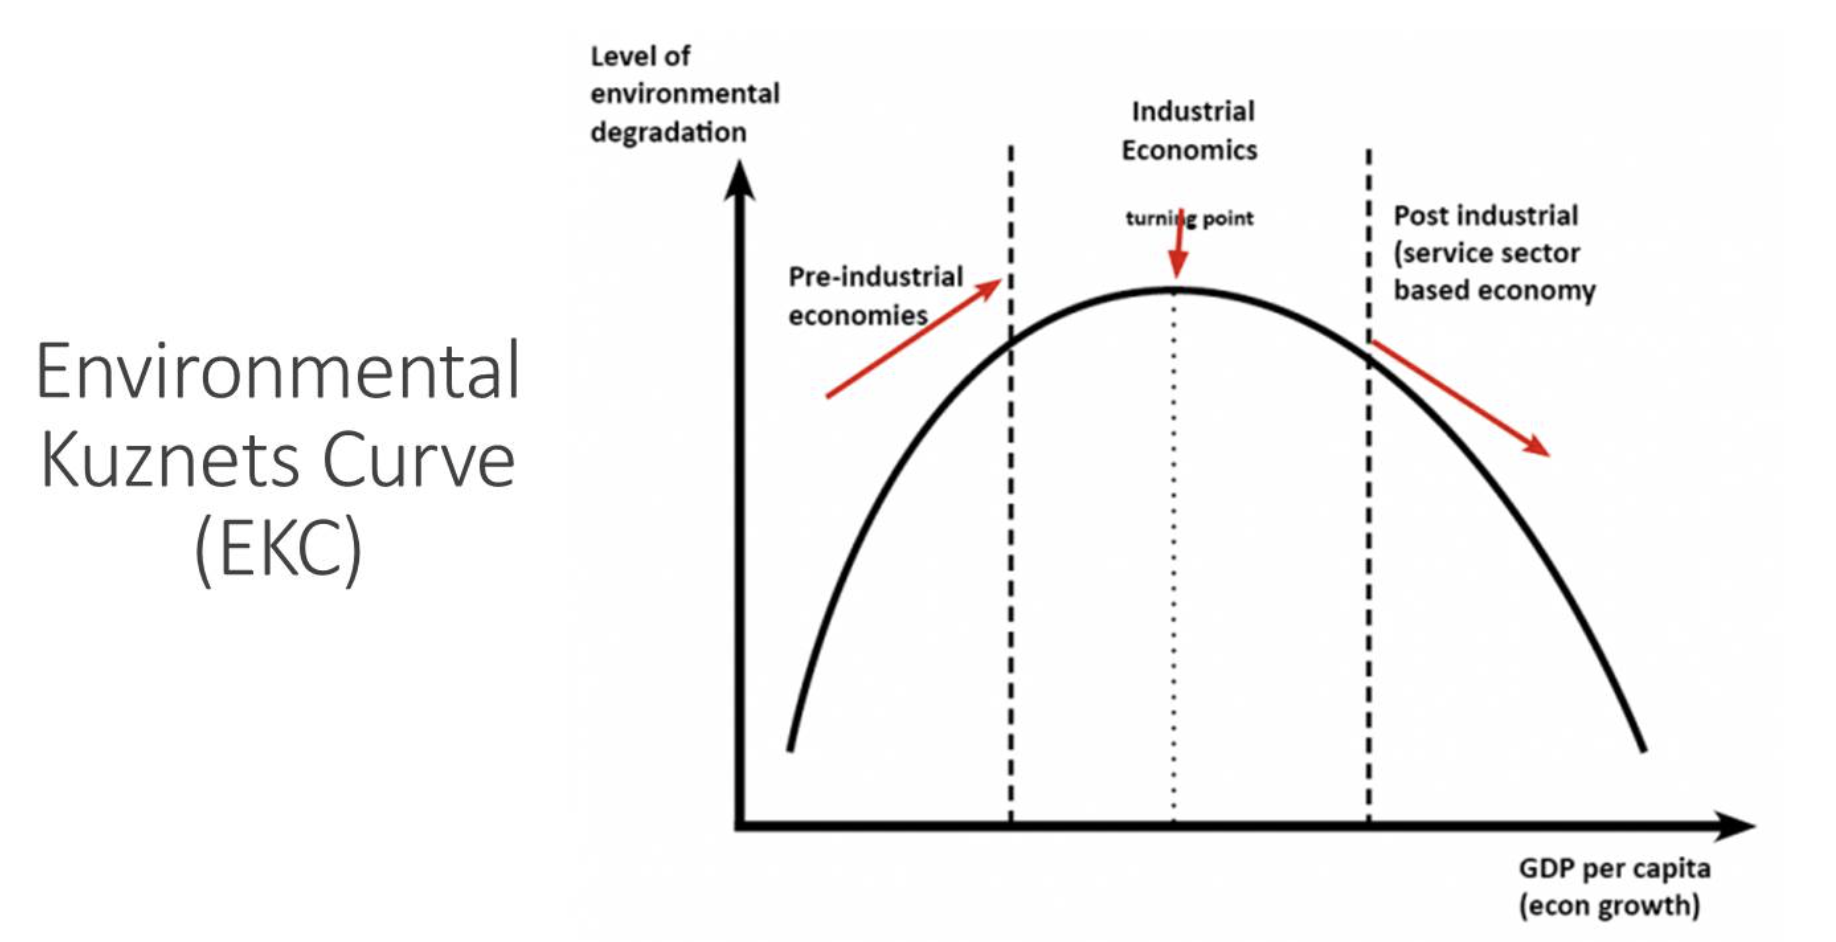
Environmental Transition Hypothesis: Demand for environmental quality rises once an income threshold is reached; reflects the trade-off between the environment and economic development.
There is no evidence to support the EKC hypothesis for gases such as CO2.
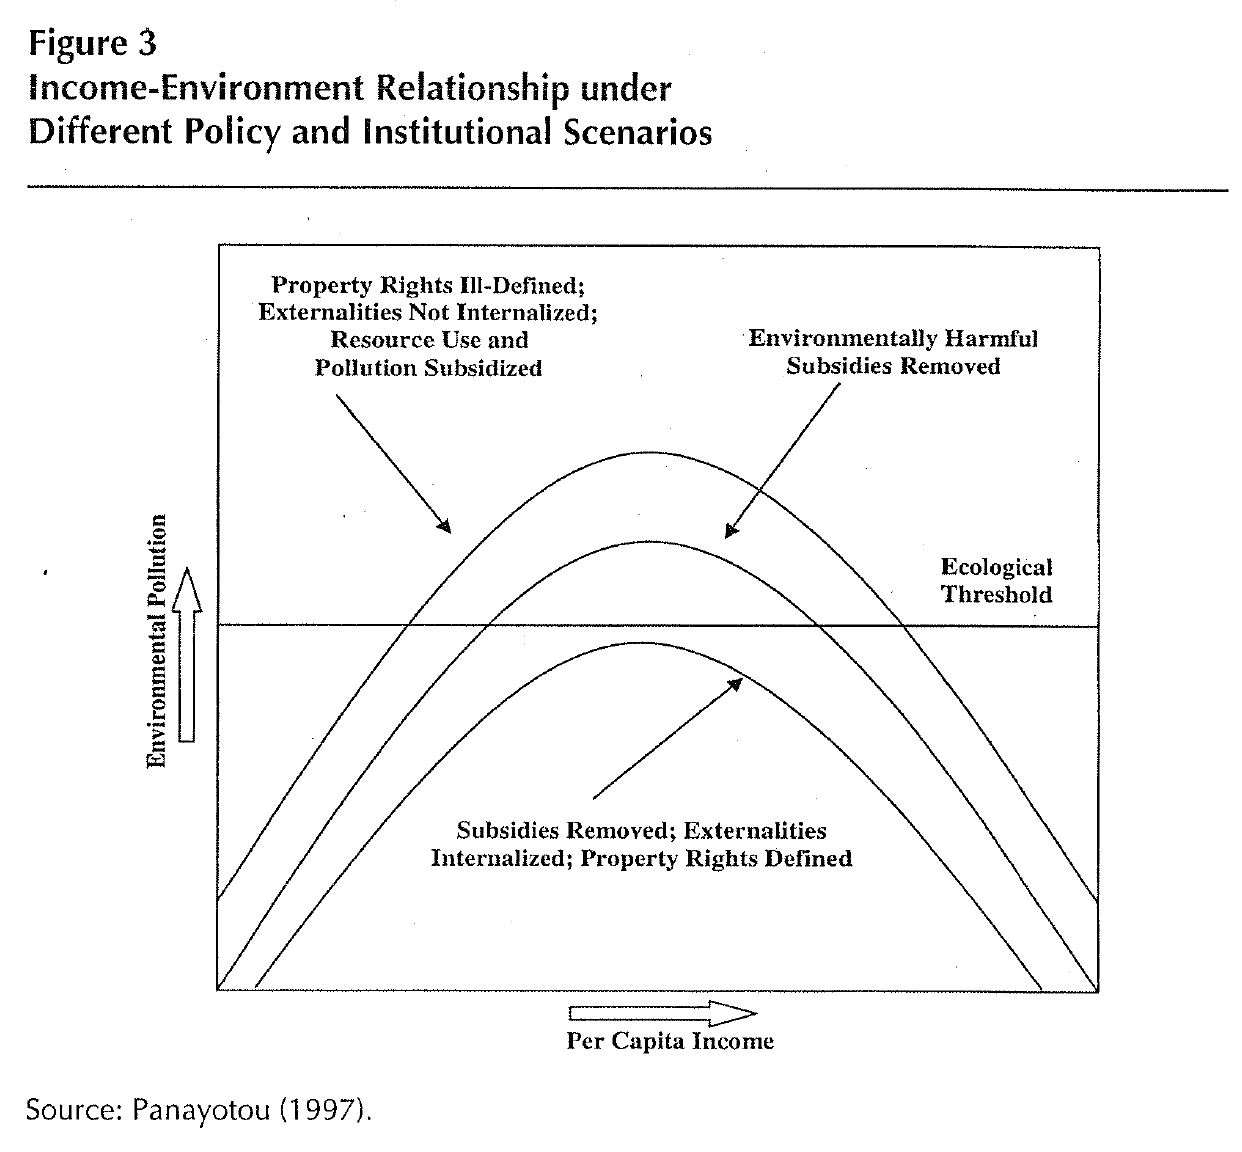
Normal EKC suggests that as the development process picks up, when a certain level of per capita income is reached, economic growth helps to undo the damage done in earlier years. If economic growth is good for the environment, policies that stimulate growth (trade liberalization, economic restructuring, and price reform) ought to be good for the environment.
GDP growth creates the conditions for environmental improvement by raising the demand for improved environmental quality improvements materializes or not, when and how, depends critically on government policies, social institutions, and the completeness and functioning of markets.
Better policies such as the removal of distorting subsidies, and the introduction of more secure property rights over resources, and the imposition of pollution taxes to connect actions taken to prices paid will flatten the underling EKC and perhaps achieve an earlier turning point. Because market forces will ultimately determine the price of environmental quality, policies that allow market forces to operate are expected to be unambiguously positive.
____________________________________________________________________
Making Sense of the Voluntary Carbon Market by Kollmuss
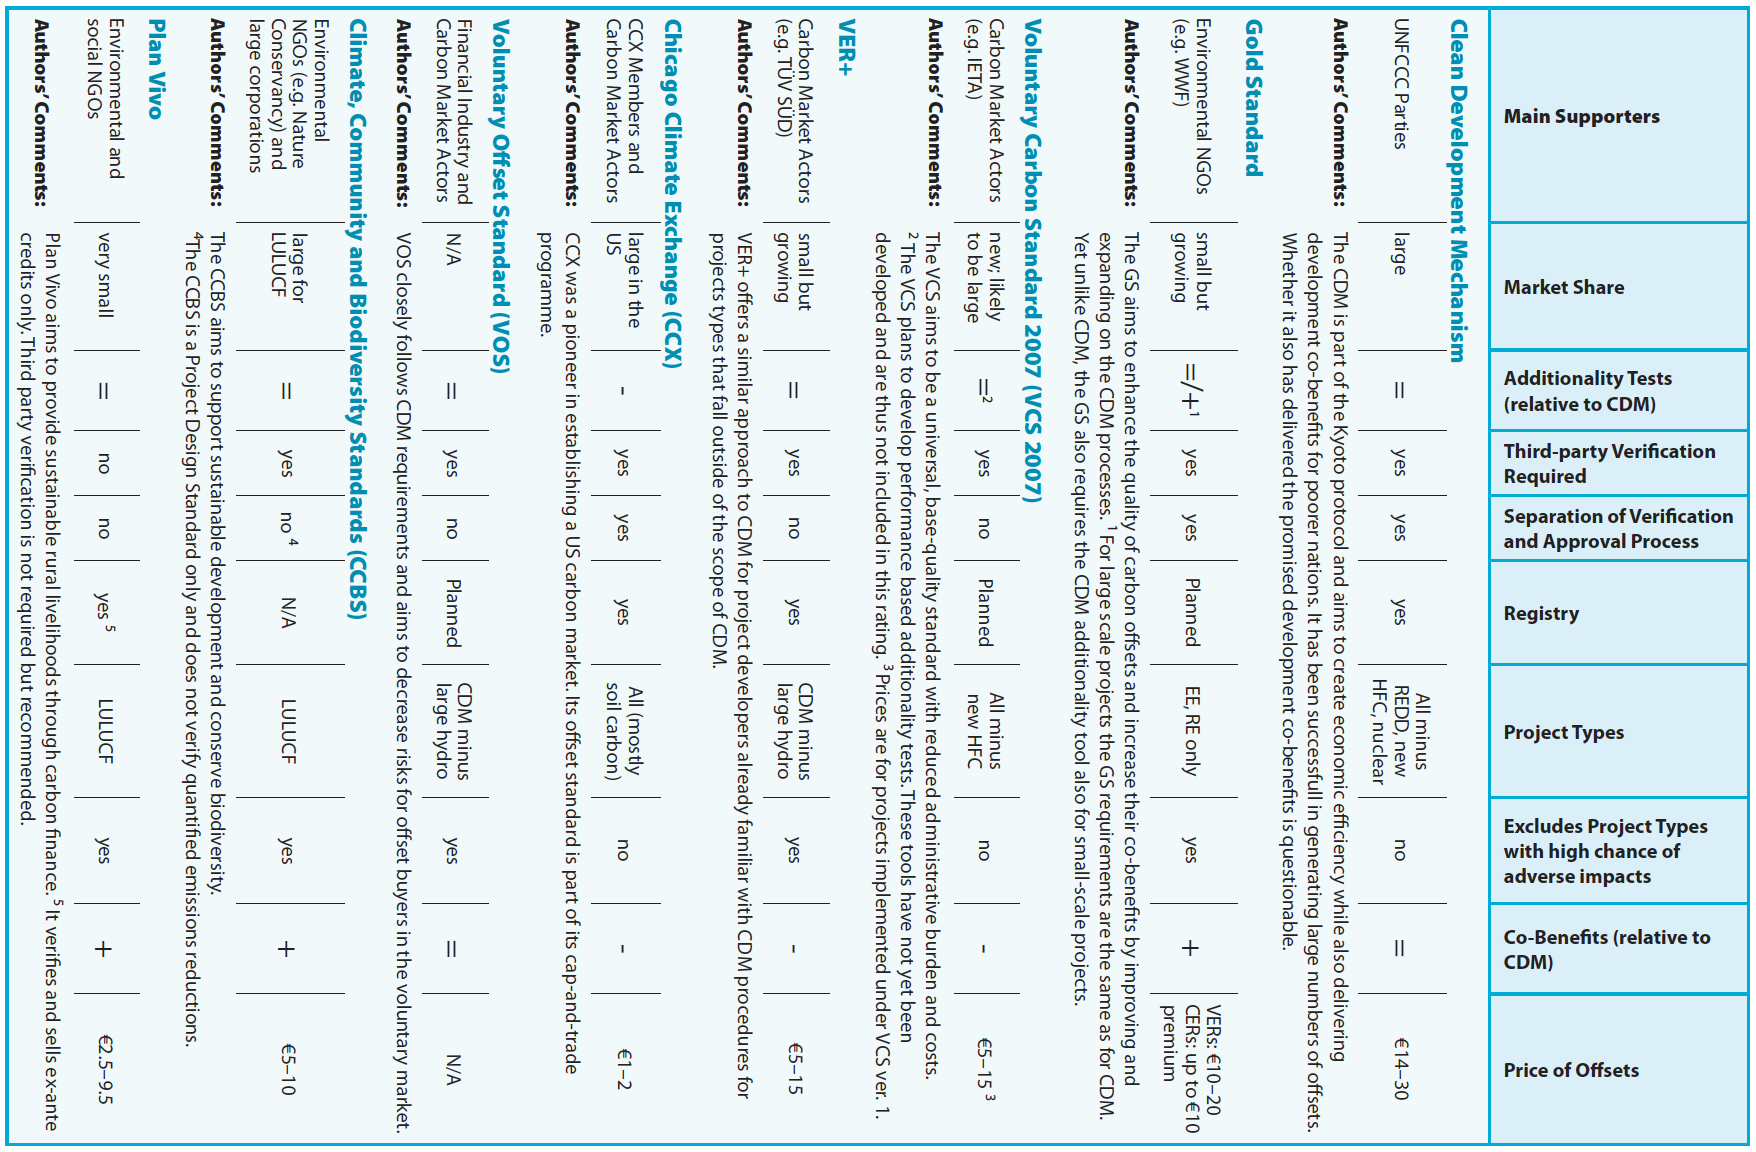
Ref: Kollmuss et al (Mar, 2008). Making Sense of the Voluntary Carbon Market: A Comparison of Carbon Offset Standards. WWF Germany.
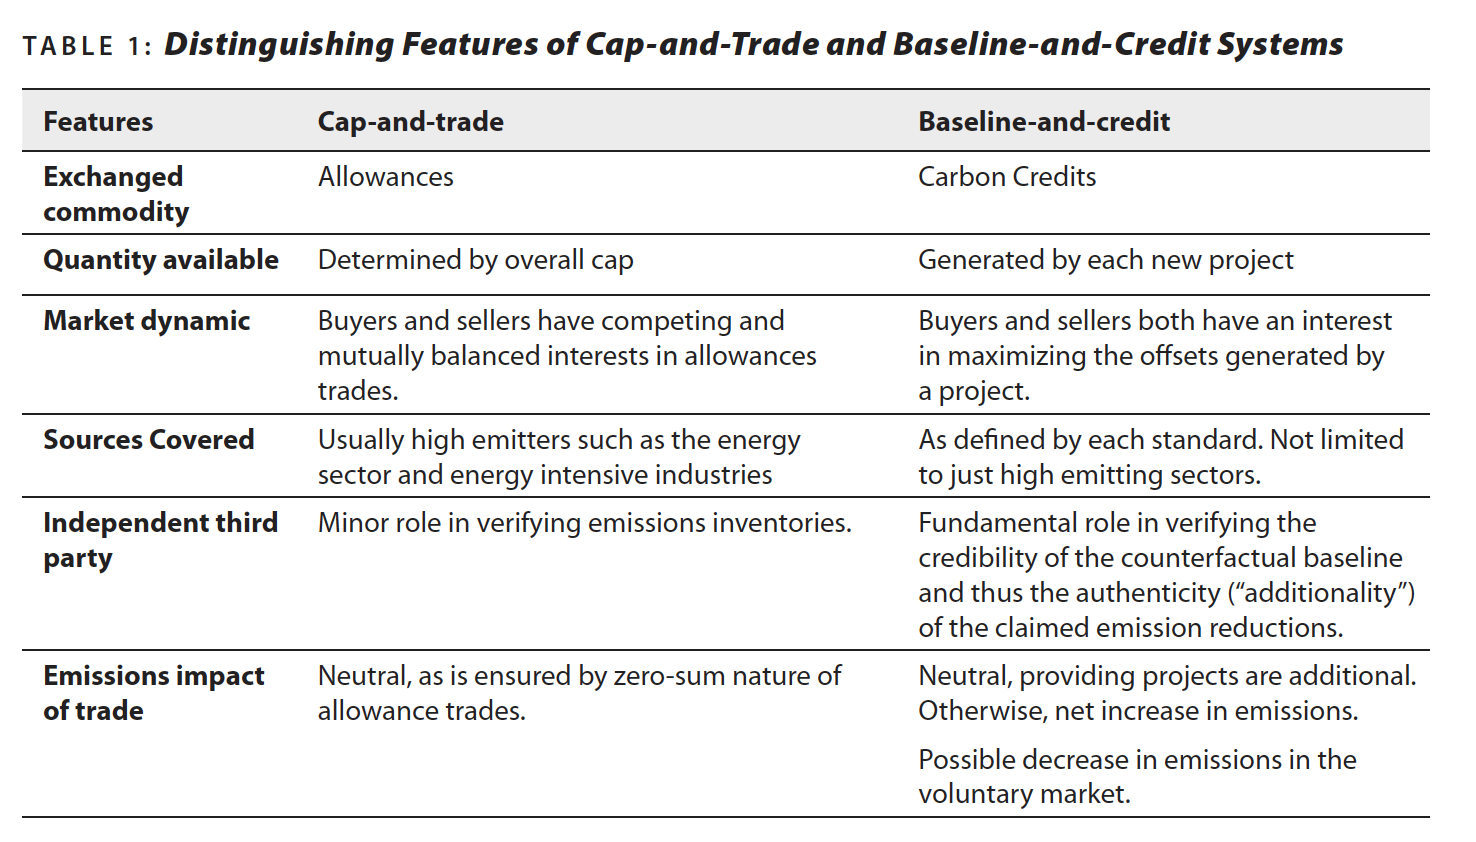
Cap-and-Trade: An overall cap is set to achieve emissions reductions; each of the participants within a cap-and-trade system (usually countries, regions or industries) is allocated a certain number of allowances based on an emissions reduction target. In a cap-and-trade system the cap constitutes a finite supply of allowances, set by regulation and political negotiation. These allowances are traded among participants. This finite supply creates a scarcity and drives the demand and price for allowances.
A cap-and-trade system aims to internalize (some of) the costs of emissions, and thus drives actors to seek cost-effective means to reduce their emissions.
Retirement: A method of reducing overall emissions by purchasing C offsets and retiring them so that they may not be used to offset others’ emissions. Retired credits can no longer be traded.
Baseline-and-Credit: Credits are generated with each new project implemented. These credits can then be used by buyers to comply with a regulatory emission target, to “offset” an emitting activity (such as an airline flight), or to be a “C neutral” organization with zero “net” emissions.
In a baseline-and-credit system a C offset buyer can only legitimately claim to offset his emissions if the emissions reductions come from a project that would not have happened anyway (Additionality).
Resources
Clean Development Mechanism (CDM): Allows Annex I countries to partly meet their Kyoto targets by financing C emission reductions projects in developing countries. Such projects are arguably more cost-effective than projects implemented in richer nations because developing countries have on average lower energy efficiencies, lower labor costs, weaker regulatory requirements, and less advanced technologies. The CDM is also meant to deliver sustainable development benefits to the host country.
CDM projects generate emissions credits called Certified Emissions Reductions or CERs (1x CER = 1 ton of CO2e) which are then bought and traded.
A provision of the Kyoto Protocol that allows developed countries (Annex 1) to offset their emissions by funding emissions-reduction projects in developing countries (non-Annex 1).
Capacity Development for the Clean Development Mechanism (CD4CDM): A project developed by the UNEP with financial support from the Dutch government; established to promote GHG emission reduction projects that are consistent with national sustainable development goals, particularly projects in the energy sector. CD4CDM gives guidance to participating developing countries about the opportunities offered by CDM projects, and helps these countries develop the necessary institutional and human capabilities to plan and implement projects under the CDM (see http://cd4cdm.org).
Gold Standard (GS): Developed by a group of environmental and social non-profit organizations to strengthen the social and environmental benefits of C offset projects. The Gold Standard can be used for voluntary as well as CDM projects. It has a very well developed stakeholder process and stresses environmental and socio-economic co-benefits for the host communities.
Climate, Community & Biodiversity Standards (CCBS): Focuses exclusively on bio-sequestration projects and emphasizes the social and environmental benefits of such projects. CCBS is a project design standard and offers rules and guidance for project design and development. It has a very well-developed stakeholder process and stresses environmental co-benefits.
CCBS offers rules and guidance for project design and development. It is intended to be applied early on during a project’s design phase to ensure robust project design and local community and biodiversity benefits. It does not verify quantified C offsets nor does it provide a registry. The CCBS focus exclusively on land-based bio-sequestration and mitigation projects and require social and environmental benefits from such projects.
Plan Vivo: A standard for community-based agro forestry projects and focuses on promoting sustainable livelihoods in rural communities.
Plan Vivo is an Offset Project Method for small scale LULUCF projects with a focus on promoting sustainable development and improving rural livelihoods and ecosystems. Plan Vivo works very closely with rural communities, emphasizes participatory design, ongoing stakeholder consultation, and the use of native species. The Plan Vivo Foundation certifies and issues only ex-ante credits, called Plan Vivo Certificates, and therefore does not verify ex-post offsets.
Voluntary Carbon Standard (VCS): A full-fledged C offset standard that focuses on GHG reduction attributes only and does not require projects to have additional environmental or social benefits. VCS approved C offsets are registered and traded as Voluntary Carbon Units (VCUs) and represent emissions reductions of 1 ton CO2.
VCS includes bio-sequestration and land-based emissions reductions projects and has developed a specific set of rules to address the particular issues and risks associated with these project types. The VSC uses the acronym AFOLU (Agriculture, Forestry and Other Land Use) for its bio-sequestration projects.
VER+: A C offset standard that closely follows the Kyoto Protocol’s project-based mechanisms (CDM and JI).
Chicago Climate Exchange (CCX): A voluntary GHG emissions cap-and-trade scheme based in North America. Although participation is voluntary, compliance with emission reduction objectives is legally binding once a member joins. CCX has as part of its cap-and-trade scheme an offset programme with a full-fledged C offset standard. CCX members commit to reduce their emissions by a fixed amount below the established baseline level. Members who cannot achieve the reduction target through cutting their emissions internally can meet their compliance commitment by purchasing emission allowances (called Carbon Financial Instruments; CFI) through CCX’s electronic trading platform from other CCX Members that reduce their emissions beyond the reduction target. Offsets from projects implemented through the CCX offset programme can also be used to comply with reduction targets. Total use of offsets for compliance is limited to no more than one half of the required reductions.
Voluntary Offset Standard (VOS): A C offset screen that accepts other standards and methodologies using certain screening criteria. It currently accepts Gold Standards VER projects and projects that employ CDM procedures but which are implemented in countries that have not ratified Kyoto and are therefore not eligible for CDM.
United Nations
Conference of Parties (COP): The meeting of parties to the UNFCCC.
Emissions Trading: A provision of the Kyoto Protocol that allows Annex 1 countries to trade emissions reduction credits in order to comply with their Kyoto-assigned targets. This system allows countries to pay and take credit for emissions reduction projects in developing countries where the cost of these projects may be lower, thus ensuring that overall emissions are lessened in the most cost-effective manner.
Kyoto Mechanisms: The three flexibility mechanisms that may be used by Annex I Parties to the Kyoto Protocol to fulfil their commitments through emissions trading (Art.17). Those are the Joint Implementation (JI, Art.6), Clean Development Mechanism (CDM, Art.12) and trading of Assigned Amount Units (AAUs).
Kyoto Protocol: An international treaty that requires participating countries to reduce their emissions by 5% below 1990 levels by 2012.The Protocol, developed in 1997, is administered by the Secretariat of the UNFCC.
Land Use, Land Use Change, and Forestry (LULUCF): Tree-planting projects, reforestation and afforestation projects designed to remove C from the atmosphere.
Millennium Development Goals (MDGs): Commit the international community to an expanded vision of development, one that vigorously promotes human development as the key to sustaining social and economic progress in all countries, and recognizes the importance of creating a global partnership for development. The goals have been commonly accepted as a framework for measuring development progress.
Greenhouse Gases (GHGs): Gases that cause climate change. The GHGs covered under the Kyoto Protocol are: CO2, CH4, N2O, HFCs, PFCs, and SF6.
Secondary Market: The exchange of emission reductions, offsets, or allowances between buyer and seller where the seller is not the originator of the supply and represents a secondary trade in the particular product.
Primary Market: The exchange of emission reductions, offsets, or allowances between buyer and seller where the seller is the originator of the supply and where the product has not been traded more than once.
United Nations Framework Convention on Climate Change (UNFCCC): An international treaty, developed at the 1992 UN Conference on Environment and Development, which aims to combat climate change by reducing global greenhouse gas emissions. The original treaty was considered legally non-binding, but made provisions for future protocols, such as the Kyoto Protocol, to set mandatory emissions limits.
Leakage: The unanticipated loss of C reductions outside a project boundary.
Permanence: The length of time that C will remain stored after being sequestered in vegetation.
Methane (CH4): Produced and emitted by landfills, during wastewater treatment, in natural gas and petroleum systems, by agriculture (livestock and rice cultivation), and during coal mining. Methane is natural gas and can therefore be captured and used as a source of energy. CH4’s global warming potential is about 21x greater than that of CO2.
CH4 Projects: Two types; 1) capture and flare and 2) capture and produce energy.
Capture and Flare: Through combustion, CH4 is turned into less potent CO2 and H2O. Examples of such projects include the capture and flaring of landfill gas and of coal mining gas.
Capture and Energy: Captures CH4 and uses it to produce either hot water or electricity. Such projects include those that capture and purify CH4 in wastewater treatment plants or landfills and use it for electricity production or the production of another form of energy.
Biofuel plants that use agricultural or forestry waste to produce electricity also use CH4 – organic matter is anaerobically digested and the resulting CH4 is used to produce electricity – but such biofuel projects are considered renewable energy projects rather than methane capture.
____________________________________________________________________
Sustainability Principles and Practice by Robinson
Ref: Margaret Robinson (2017). Sustainability Principles and Practice. Second Edition.
Materials from the lithosphere are nonrenewable resources, which means there is no sustainable rate of consumption. In the US, 95% of the materials flowing through the industrial economy are nonrenewable; in China, the share is 88% (Worldwatch Institute 2013). Consumption of these nonrenewable resources is accelerating exponentially as a result of the dual pressures of rising populations and growing affluence in China, India, and other developing countries. Their use is part of a complex picture in which products commonly seen as environmentally friendly have negative tradeoffs.
Platinum, a rare metal, is a vital component not only of catalytic converters that reduce pollutants from car exhausts but also of fuel cells. Solar cells can replace fossil-fuel power sources, and smartphones and computers can reduce the number of automobile miles driven by connecting people and businesses virtually instead of physically, but their manufacture requires rare metals including gallium and indium. Rare earth elements, 97% of which are produced in one country, China, are essential in climate-friendlier devices including neodymium used in wind turbines and dysprosium used in batteries for hybrid and electric cars.
Cradle to Grave: The standard approach to product life cycle; materials and resources follow a one-way trip from production to disposal.
Cradle to Cradle: A product life-cycle approach that focuses on biological and technical nutrient recycling to return products to the biosphere, where they biodegrade and become food within biological systems.
1982: Swiss Architect Walter Stahel introduces the concept of “cradle to cradle” for product life-cycle.
2002: Architect William McDonough and chemist Michael Braungart challenged the usual eco-efficiency approach to design thinking in their seminal book Cradle to Cradle. They pointed out that being less bad is still bad. Being less bad means that resources are still depleted and toxins still accumulate; they just do so gradually and quietly. They proposed an alternative approach based on nature’s model in which waste equals food, with waste at one level becoming a nutrient at another level.
Manufacturers can apply for Cradle to Cradle (C2C) certification for products. In a certification audit, materials and manufacturing processes for a product are assessed in each of five categories: material health, material reutilization, renewable energy use, water stewardship, and social responsibility. A product can receive C2C basic certification or can be certified as C2C Silver, C2C Gold, or C2C Platinum. Similar to LEED certification, points are awarded with higher numbers of points required for successively higher categories. While the C2C certification process provides intensive technical support and expert advice to manufacturers, the certification .audit itself has not yet achieved third-party status; C2C is a proprietary program from the private company of McDonough Braungart Design Chemistry (MBDC).
Technical Nutrients: Materials that will not biodegrade or become part of any ecosystem. They remain within closed-loop technical cycles, circulating within industry and not allowed to contaminate biological systems. Technical nutrients are durable substances for which the manufacturer is responsible.
Toxic and Hazardous substances (X-ingredients): Categorized as unmarketable; substances which should never be used; include persistent organic pollutants, heavy metals, and PVC.
Circular-Economy Concept (CEC): Modeled on nature; waste from one process becomes food for another, often summarized “waste equals food.” Each part of the system is connected to other parts in closed loops and waste is designed out of the system entirely so that the system can function in the long term. CEC is envisioned to be not just “less bad” but restorative by relying on renewable energy, eliminating the use of toxic chemicals, and avoiding waste by design through the use of technical and biological nutrient cycles.
Industrial Ecology: The study of material and energy flows through an industrial system with a focus on shifting them from a linear model to a closed-loop model.
Life cycle assessment (LCA): A method for measuring a product’s impact on the environment throughout its entire life cycle, from “cradle to grave.” LCA quantifies energy flows, material flows, and environmental impacts of extraction, acquisition, production, use, and disposal, and typically involves a supply chain whose scope can be ever-expanding.
Product Design
Eco-Efficiency: Designing products in environmentally responsible ways.
Design for the Environment (DFE, DfE): The practice of designing products and the processes for making those products in environmentally responsible ways.
Three packaging characteristics are relevant to DFE: type of material used, amount of material used, and whether the packaging is reusable.
Product Design Goals: Design for Detoxification, dematerialization, longevity, energy efficiency, disassembly, biomimicry, packaging, transportation/shipping.
Biomimicry: Modeling natural design; nature runs on sunlight, uses only the energy it needs, fits form to function, recycles everything, rewards cooperation, banks on diversity, demands local expertise, curbs excess from within, and taps the power of limits.
The Twelve Principles of Green Chemistry
Prevention: It is better to prevent waste than to clean up or treat it after it is formed.
Atom Economy: Design synthetic methods to maximize incorporation of all materials used in the process into the final product.
Less Hazardous Chemical Syntheses: Design synthetic methods to use and generate substances that minimize toxicity to human health and the environment.
Designing Safer Chemicals: Design chemical products to affect their desired function while minimizing their toxicity.
Safer Solvents and Auxiliaries: Minimize the use of auxiliary substances (e.g., solvents and separation agents) wherever possible and make them innocuous when used.
Design for Energy Efficiency: Minimize the energy requirements of chemical processes and conduct syntheses at ambient temperature and pressure if possible.
Use of Renewable Feedstocks: Use renewable raw material or feedstock whenever practicable.
Reduce Derivatives: Minimize or avoid unnecessary derivatization, which requires additional reagents and can generate waste.
Catalysis: Catalytic reagents are superior to stoichiometric reagents.
Design for Degradation: Design chemical products so they break down into innocuous products that do not persist in the environment.
Real-Time Analysis for Pollution Prevention: Use real-time, in-process monitoring and control to avoid formation of hazardous substances.
Inherently Safer Chemistry for Accident Prevention: Choose substances and the form of a substance used in a chemical process to minimize hazard and risk.
International Organization for Standardization (ISO): Established in 1947 in Geneva, ISO is a consensus-based network of national standards institutes from 163 countries, with standards developed by hundreds of ISO Technical Committees composed of volunteer stakeholders. Thousands of different standards cover almost every area of modem daily life. For example, an ISO standard for the size and shape of credit cards ensures that a card issued by any company will fit in any credit card slot.
ISO 14000: A series of standards for environmental management. ISO defines the environment as the “surroundings in which an organization operates, including air, water, land, natural resources, flora, fauna, humans, and their interrelation.” The standard says that the environment “extends from within an organization to the global system.” The ISO 14000 Family of Standards for Environmental Management:
ISO 14001: Environmental Management Systems Requirements.
ISO 14004: Implementation Guidelines.
ISO 14006: Eco-Design Guidelines.
ISO 14010: Environmental Auditing.
ISO 14020: Environmental Labels—General Principles.
ISO 14021: Environmental Labels—Self-Declared Environmental Claims (Type II).
ISO 14024: Environmental Labels—Type 1 Environmental Labeling.
ISO 14025: Environmental Labels—Type III Environmental Declarations.
ISO 14031: Environmental Performance Evaluation.
ISO 14040: Life Cycle Assessment ISO 14050: Terms and Definitions.
ISO 14060: Inclusion of Environmental Aspects in Product Standards.
ISO 14062: Product Design and Development.
ISO 14063: Environmental Communication.
ISO 14064: Greenhouse Gas (GHG) Accounting and Verification.
ISO 14065: Accreditation.
ISO 14067: Carbon Footprint of Products.
ISO 14069: Greenhouse Gas (GHG) Reporting.
Green Seal: A large third-party certifier in the US, and EcoLogo; founded in 1988 by the Government of Canada but now used across North America and globally.
Eco-Label: Any label on a product that tells consumers that the product provides environmental or social benefit. ISO 14020 recognizes 3 types of environmental labels:
Type I: Indicate that products are independently verified by a third party based on specific criteria; these are referred to by ISO as eco-labels. Like a seal of approval, an eco-label is applied when the product meets a certifying standard. “USDA Organic” and “FSC” are examples of this type. The international Fairtrade Mark and the US Fair Trade Certified label are examples of Type I eco-labels. These third-party verified labels certify that an individual product meets international standards for fair prices, fair labor conditions, and environmental sustainability.
Type II: Self-declarations about a product. They are claims that may or may not be verifiable. A Type II label makes claims using descriptive terms, such as “biodegradable.”
Type III: Indicate independent third-party verification. In addition, award of a Type III label is based on a full life cycle assessment of the product.
Forest Stewardship Council (FSC): Founded in 1993 by a group of loggers, foresters, social activist groups, and environmental NGOs to help prevent loss of the world’s forests. Its strategy is to certify wood products that come from sustainably harvested forests.
Fair Trade Labels.
____________________________________________________________________
Thinking in Systems by Wright & Meadows
Ref: Wright & Meadows (2009). Thinking in Systems: A Primer. ProQuest Ebook Central. From: http://ebookcentral.proquest.com/lib/jhu/detail.action?docID=430143.
“I have yet to see any problem, however complicated, which, when looked at in the right way, did not become still more complicated.”-Poul Anderson.
When someone tells you that population growth causes poverty, you’ll ask yourself how poverty may cause population growth. You’ll be thinking not in terms of a static world, but a dynamic one. You’ll stop looking for who’s to blame; instead you’ll start asking, “What’s the system?” The concept of feedback opens up the idea that a system can cause its own behavior.
If A causes B, is it possible that B also causes A?
One of the central insights of systems theory, as central as the observation that systems largely cause their own behavior, is that systems with similar feedback structures produce similar dynamic behaviors, even if the outward appearance of these systems is completely dissimilar.
Growth in a constrained environment is very common, so common that systems thinkers call it the “limits-to-growth” archetype.
In physical, exponentially growing systems, there must be at least one reinforcing loop driving the growth and at least one balancing loop constraining the growth, because no physical system can grow forever in a finite environment.
Investment Fraction: How much output a society invests rather than consumes.
Efficiency of Capital: How much capital it takes to produce a given amount of output.
System: An interconnected set of elements that is coherently organized in a way that achieves something; a system must consist of elements, interconnections, and a function or purpose.
Stock: The foundation of any system; elements of the system that you can see, feel, count, or measure at any given time; a store, quantity, an accumulation material or information that has built up over time.
Stocks change over time through the actions of a flow.
Flow: Filling and draining, births and deaths, purchases and sales, growth and decay, deposits and withdrawals, successes and failures.
Balancing Feedback Loop: A stabilizing, goal-seeking, regulating loop.
A delay in a balancing feedback loop makes a system likely to oscillate.
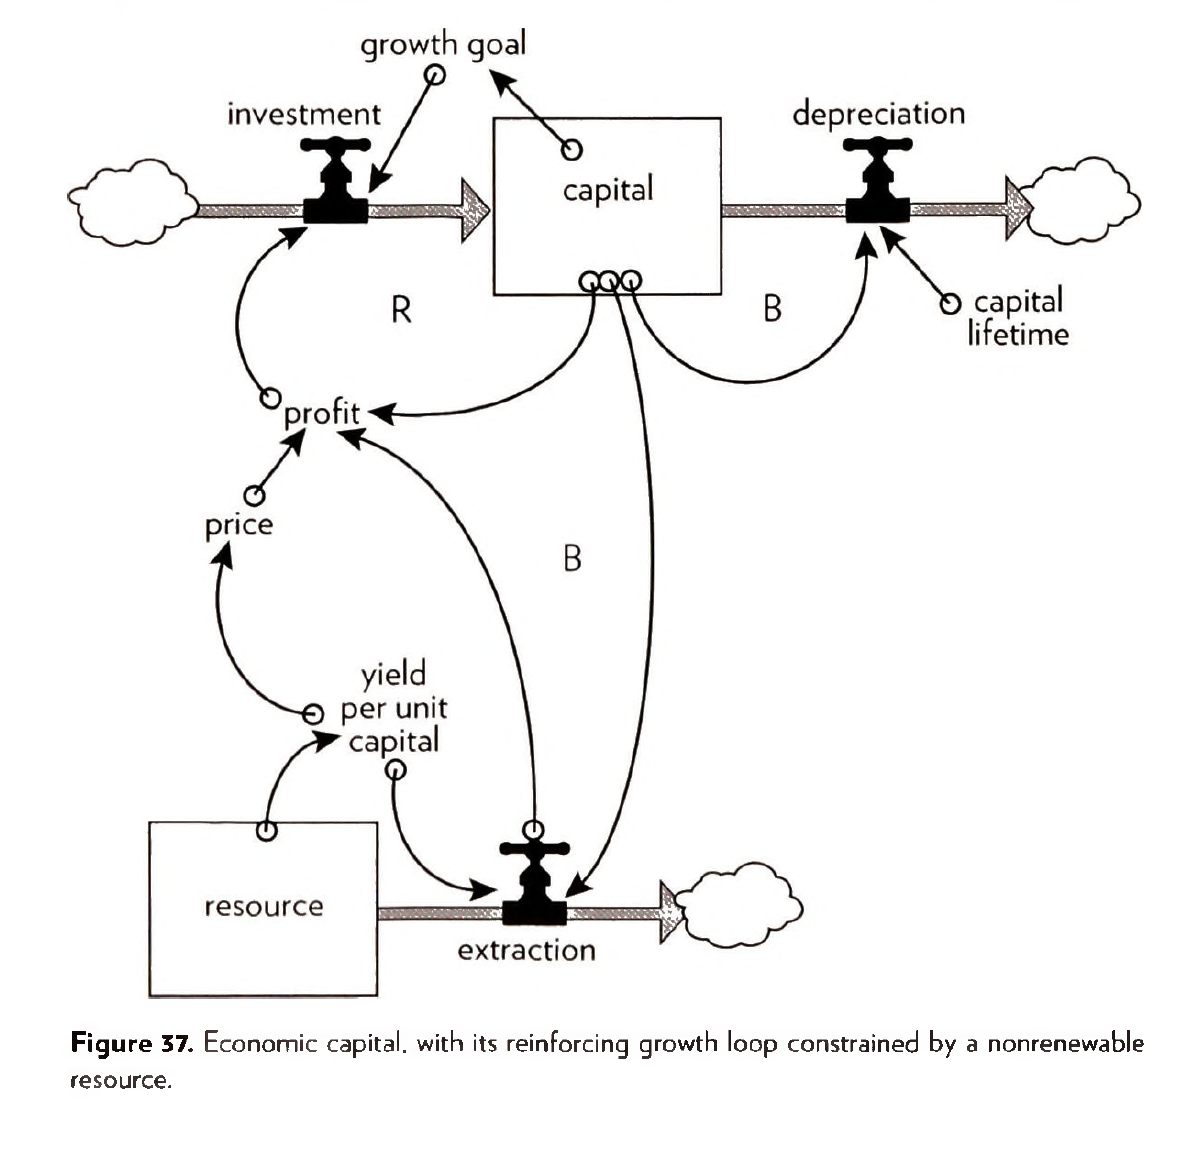
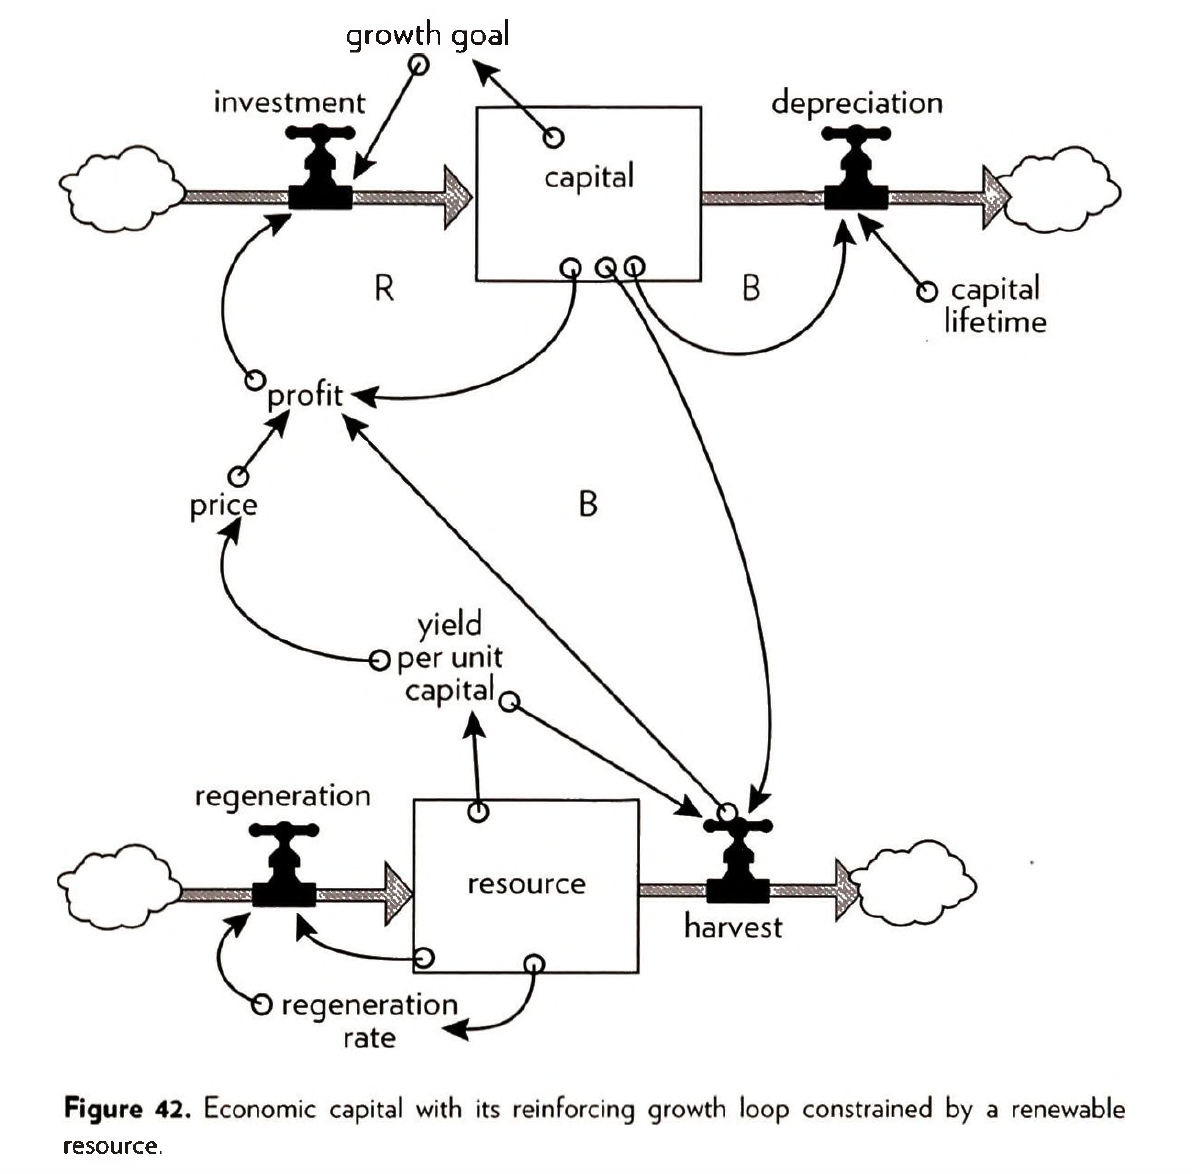
Here is a new balancing feedback loop that ultimately will control the growth of capital: the more capital, the higher the extraction rate. The higher the extraction rate, the lower the resource stock. The lower the resource stock, the lower the yield of resource per unit of capital, so the lower the profit (with price assumed constant) and the lower the investment rate—therefore, the lower the rate of growth of capital. I could assume that resource depletion feeds back through operating cost as well as capital efficiency. In the real world it does both. In either case, the ensuing behavior pattern is the same—the classic dynamics of depletion.
Reinforcing Feedback Loop (R ): Generates more input to a stock the more that is already there (and less input the less that is already there).
Resources
Nonrenewable resources are stock/r-limited. The entire stock is available at once, and can be extracted at any rate (limited mainly by extraction capital). But since the stock Is not renewed, the faster the extraction rate, the shorter the lifetime of the resource.
Renewable resources are flow- limited. They can support extraction or harvest Indefinitely, but only at a finite flow rate equal to their regeneration rate. If they are extracted faster than they regenerate, they may eventually be driven below a critical threshold and become, for all practical purposes, nonrenewable.
Three sets of possible behaviors of this renewable resource system here: 1) overshoot and adjustment to a sustainable equilibrium, 2) overshoot beyond that equilibrium followed by oscillation around it, and 3) overshoot followed by collapse of the resource and the industry dependent on the resource.
Which outcome actually occurs depends on two things; 1) the critical threshold beyond which the resource population’s ability to regenerate itself is damaged and 2) the rapidity and effectiveness of the balancing feedback loop that slows capital growth as the resource becomes depleted. If the feedback is fast enough to stop capital growth before the critical threshold is reached, the whole system comes smoothly into equilibrium. If the balancing feedback is slower and less effective, the system oscillates. If the balancing loop is very weak, so that capital can go on growing even as the resource is reduced below its threshold ability to regenerate itself, the resource and the industry both collapse.
____________________________________________________________________
Sustainable Intensification in Agriculture: Premises and Policies by Garnett
Ref: Garnett et al (2013). Sustainable Intensification in Agriculture: Premises and Policies. Science 341 (6141), Pg 33-34.
Sustainable Intensification (SI): Increasing food production from existing farmland in ways that place far less pressure on the environment and that do not undermine our capacity to continue producing food in the future. The origins of SI lie in discussions about increasing yields, chiefly of arable crops.
SI includes moderation (and reduction) in demand for resource-intensive foods (such as meat and dairy products) a decrease in food waste, an integration of agriculture and conservation goals through wildlife-friendly land-sharing practices.
SI does not mean business-as-usual food production moderated by marginal improvements in sustainability.
We have an excessive dependence on a few high yielding commodity crops bred for productivity rather than for micronutrient quality. Postharvest fortification as well as breeding strategies (including biofortification) that improve crops’ nutritional content can help mitigate these problems but may be counterproductive if they exacerbate reduced dietary diversity.
____________________________________________________________________
Challenges Faced by the Sustainability Movement by Caradonna
Ref: Jeremy Caradonna (unk). Challenges Faced by the Sustainability Movement.
CREATE ASHARED VISION FOR THE FUTURE— AND STICK TO IT.
Broadly, the vision of these thinkers is of a low-C, powered-down, and ecologically sound economy buttressed by decentralized democratic institutions
MOVE PAST NEOCLASSICAL ECONOMICS, DEREGULATION, AND THE GROWTH OBSESSION.
Degrowth is an anti-consumerist movement that seeks to reverse the trend of economic expansion by deliberately powering down society, rediscovering local economies, and promoting non- materialistic lifestyles.
Degrowth is an anti-consumerist movement that seeks to reverse the trend of economic expansion by deliberately powering down society, rediscovering local economies, and promoting non- materialistic lifestyles. Heinberg’s Powerdown, Lewis and Conaty’s The Resilience Imperative, Fodor’s Better Not Bigger, Ted Trainer’s The Transition, and Hopkins's Transition Companion are all books that lay out practical steps for transitioning away from energy- intensive industrialism to more sustainable and localized forms of life.16 Ozzie Zehner’s Green Illusions and Trainer’s Renewable Energy Cannot Sustain a Consumer Society remind us that growth in material consumption—which is the desired outcome of neoclassical economic policies—is unsustainable and that renewable energy makes sense for modern society only if energy demands and consumption levels are first greatly reduced.
FACE SHORTAGES, BECOME RESILIENT.
The ecological concept of “resilience” refers to the capacity of ecosystems (or species) to cope with change. The extrapolated lessons that come from this science seem increasingly germane for human beings. What ecologists have found is that species that are best able to “absorb disturbance,” adapt, and transform are those most likely to evolve successfully.
The 7 principles of resilience are diversity, modularity, social capital, innovation, overlap, tight feedback loops, and ecosystem services.
On a more practical and immediate level, resilience means coping with the present and planning for the future.
HARMONIZE THE NEEDS OF RICH AND POOR, THE DEVELOPED AND THE DEVELOPING.
RETHINK ENVIRONMENTAL MANAGEMENT, SAFEGUARD ECOSYSTEM SERVICES, AND RESTORE NATURAL CAPITAL.
Weak sustainability means that humanity moves away from its destructive habits and manages to stabilize ecosystems, the climate, and the human population. Strong sustainability goes a step further and demands that humans actively repair much of the environmental damage that they have done (to the extent that this is possible).
“When humans maximize the harvest of a particular species, for example, we inadvertently alter the species’ relationship to multiple other species (e.g., predators and prey) in the ecosystem, setting off a cascade of feedback responses that can fundamentally erode the system’s integrity.” In short, when an ecosystem is engineered to produce a maximum yield, it loses resilience and collapses.
Shift resource management from maximization to “sufficiency.”
Concentrating on the safeguarding of crucial ecosystem services. Ecosystem services are all those natural processes that allow for a healthy and functional environment and that, by extension, ensure the stability of our societies and economies. Examples include the climate’s ability to regulate the temperature of the planet, the pollination of crops by bees, the purification of water and air, the decomposition and detoxification of waste, the dispersal of seeds, and the ability of nutrients to disperse and circulate through an ecosystem.
CLIMATE CHANGE IS A GIGANTIC PROBLEM ...
The atmosphere in pre-industrial times contained 280 ppm CO2, and thus there was a more or less stable amount of C in the atmosphere. But by 2013, the ppm of CO2 had surpassed 400. All of these new C molecules act like a blanket that traps heat in the atmosphere. The bonds that hold the molecules together absorb and radiate energy at IR wavelengths, which prevents energy from flowing from the Earth’s surface up to space.
First, the world’s oceans are becoming more acidic and warmer and are thus less able to absorb CO2. The oceans are an important “sink,” along with forests, that must be able to absorb and process the excess carbon in the atmosphere. Second, the warming of tundra and permafrost is contributing to the release of natural stores of methane gas, which is many times more harmful for the climate than CO2. Third, a process called “ice-albedo feedback” is occurring as the polar ice caps melt. Those regions become less reflective and thus absorb more solar radiation
FIGHT GREENWASHING AND THE DENIAL INDUSTRY.
Greenwashing: The use and abuse of sustainability language or imagery to mask conventional, destructive practices. Greenwashing is a way of exaggerating or fabricating the environmental benefits of a product, practice, or service—and indeed many corporations have greenwashed their own products through buzzwords and misinformation in an effort to tap in to the growing market in “green products
The 7 “sins” of greenwashing— hidden trade-offs, an absence of proof, vagueness, irrelevance, the lesser of two evils, fibbing, and the worshipping of false labels—and found that a whopping 95% of “greener” products commit one or more of the seven sins.
GALVANIZE PUBLIC SUPPORT AND POLITICAL ACTION WITHOUT GETTING POLITICIZED.
Fear is that sustainability will become politicized and associated with particular political parties, thereby undermining its ability to float above the political fray.
If the sustainability movement hopes to achieve real change, then it must galvanize public support without becoming associated with an established political ideology or party.
FINANCE THE REVOLUTION.
Much of the “clean tech” that will facilitate the transition to a sustainable society, such as third-generation micro-algae biofuels, new forms of waste-free production, and hydrogen storage, require years of research and development, involve large capital commitments, and yield little or no immediate returns on investment.
____________________________________________________________________