Hydrology with Runyan
Ref: Chrissy Runyan (2019). Hydrology and Water Resources. JHU MS-ESP Course of Instruction (420.604.81.SU19). Email: Runyan.cw@gmail.com & crunyan2@jhu.edu
_____________________________________________________________________________
Summary
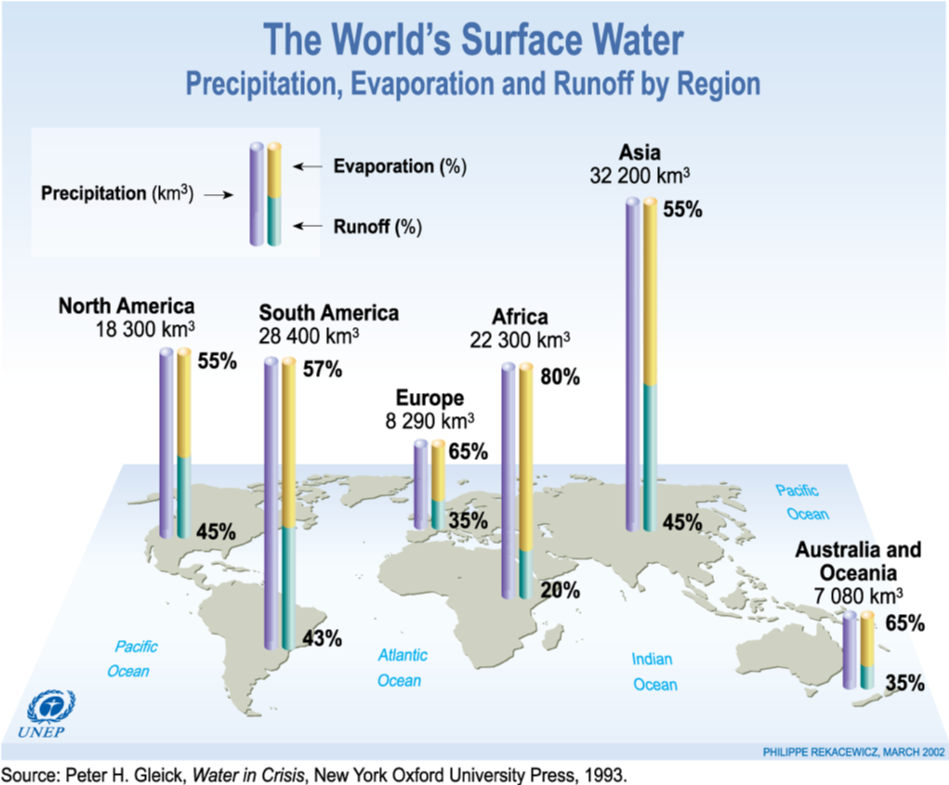
Globally, 60-70% of water is used in food production.
By 2030, 1 in 5 developing countries will face water shortages.
_____________________________________________________________________________
Solar Energy
Stefan-Boltzmann Law: All matter above absolute zero radiates energy (E); E=εσT^4
T is the temp of the surface [K], σ is the Stefan-Boltzmann constant (5.67 x 10 -8 W m^-2 T^-4), and ε is emissivity (dimensionless quantity that varies from 0 to 1).
The wavelength at which the maximum energy radiation occurs is given by Wien’s Law: Λmax = 2897/T and has units [μm].
The sun’s energy arriving at the surface is at wavelengths less than 4 μm (Shortwave Radiation). Earth emits longwave radiation. Sun emits shortwave radiation.
Gases within Earth’s atmosphere are capable of absorbing energy at specific wavelengths. Because gases are capable of absorbing energy at specific wavelengths, radiation striking the earth’s surface is depleted in certain wavelengths (e.g., 0.1-0.3 μm from the absorption of this wavelength range by ozone). Absorption of energy is also important because if gases in the atmosphere did not absorb radiation, our planetary temperature would be approximately 253 K.
Solar radiation strikes perpendicularly near the equator with the average incoming solar radiation approximately equal to 270 W m-2. In contrast, near the poles solar radiation strikes at an oblique angle, with the average incoming solar radiation equal to ~90 W m-2. This creates an energy imbalance between the poles and the equator.
Solar Constant: The amount of incoming solar energy; ~1370 W m-2, equal to 100% of the incoming solar (or shortwave) energy.
The surface energy budget can be expressed as: dW/dt=Rn ± LE ± H ± G
dW: The change in energy (E) for a given area
dt: The change in time
Rn: Net radiation (W m-2)
LE: Latent heat (W m-2). To determine latent heat (LE) from ET, multiply by the latent heat of vaporization (Lv). The latent heat of vaporization is largely a constant value (i.e., Lv =2.45 *106 J kg-1). Similarly, to convert from LE to ET all you would have to do to obtain ET is divide LE by the latent heat of vaporization. But what does the latent heat of vaporization tell us? The latent heat of vaporization is the amount of energy that is needed for a phase transformation of 1 kg of water to go from liquid to gas.
H: The sensible heat flux (W m-2). H is the energy that goes into the heating of the surface through conduction; while LE is the energy expended in the transformation of liquid water to vapor. Fluxes are positive when they are towards the surface and negative when they are away from the surface. When the surface is warmer than the air above, heat will be transferred upwards from the surface into the air. In contrast, if the air is warmer than the surface, heat is transferred from the air to the surface. Heat is also transferred from the surface downwards via conduction (this is referred to as the ground heat flux). Heat is transferred downwards when the surface is warmer than the subsurface; however, if the subsurface is warmer than the surface, then heat is transferred upwards.
G: The ground heat flux (W m-2). ~2 m beneath the surface, the soil temperature is ~constant.

_____________________________________________________________________________
Albedo (α)
Albedo (α): The ratio of the shortwave reflected radiation to the incoming shortwave radiation.
High Albedo: More reflection, less absorption; a surface reflects the majority of the radiation that hits it and absorbs the rest.
Low Albedo: Less reflection, more absorption; a surface reflects a small amount of the incoming radiation and absorbs the rest.
The Earth has an Average Albedo of .3 (30%).
The balance between incoming and outgoing radiation (Rn): Rn = Rswdown (1-α) + Rlwdown – Rlwup
α: Albedo
Rlwup: A function of the temperature of the surface of the Earth
Rlwdown: Largely a function of the cloud cover (so Rlwdown will be ~0 on a clear night).
Net Radiation: The amount of longwave and shortwave energy that is available for an area.
_____________________________________________________________________________
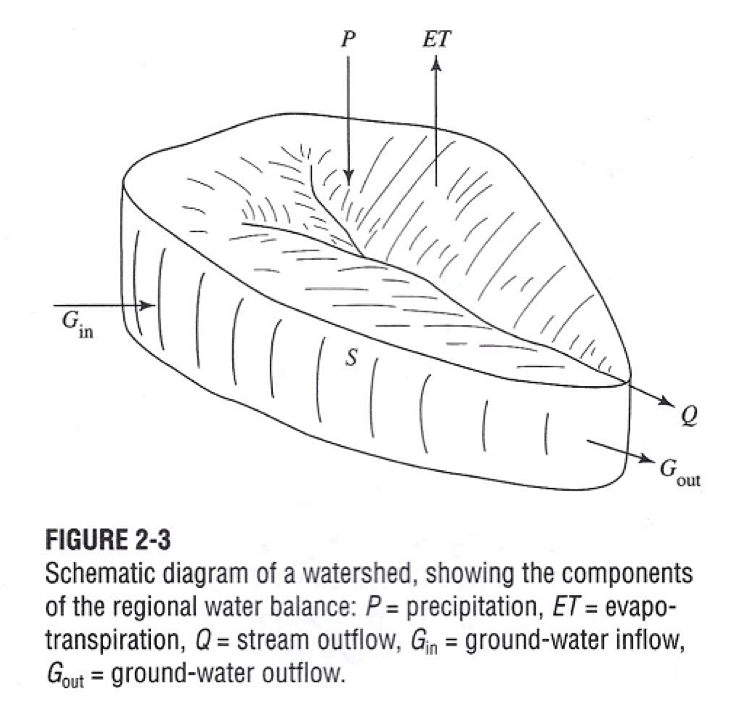
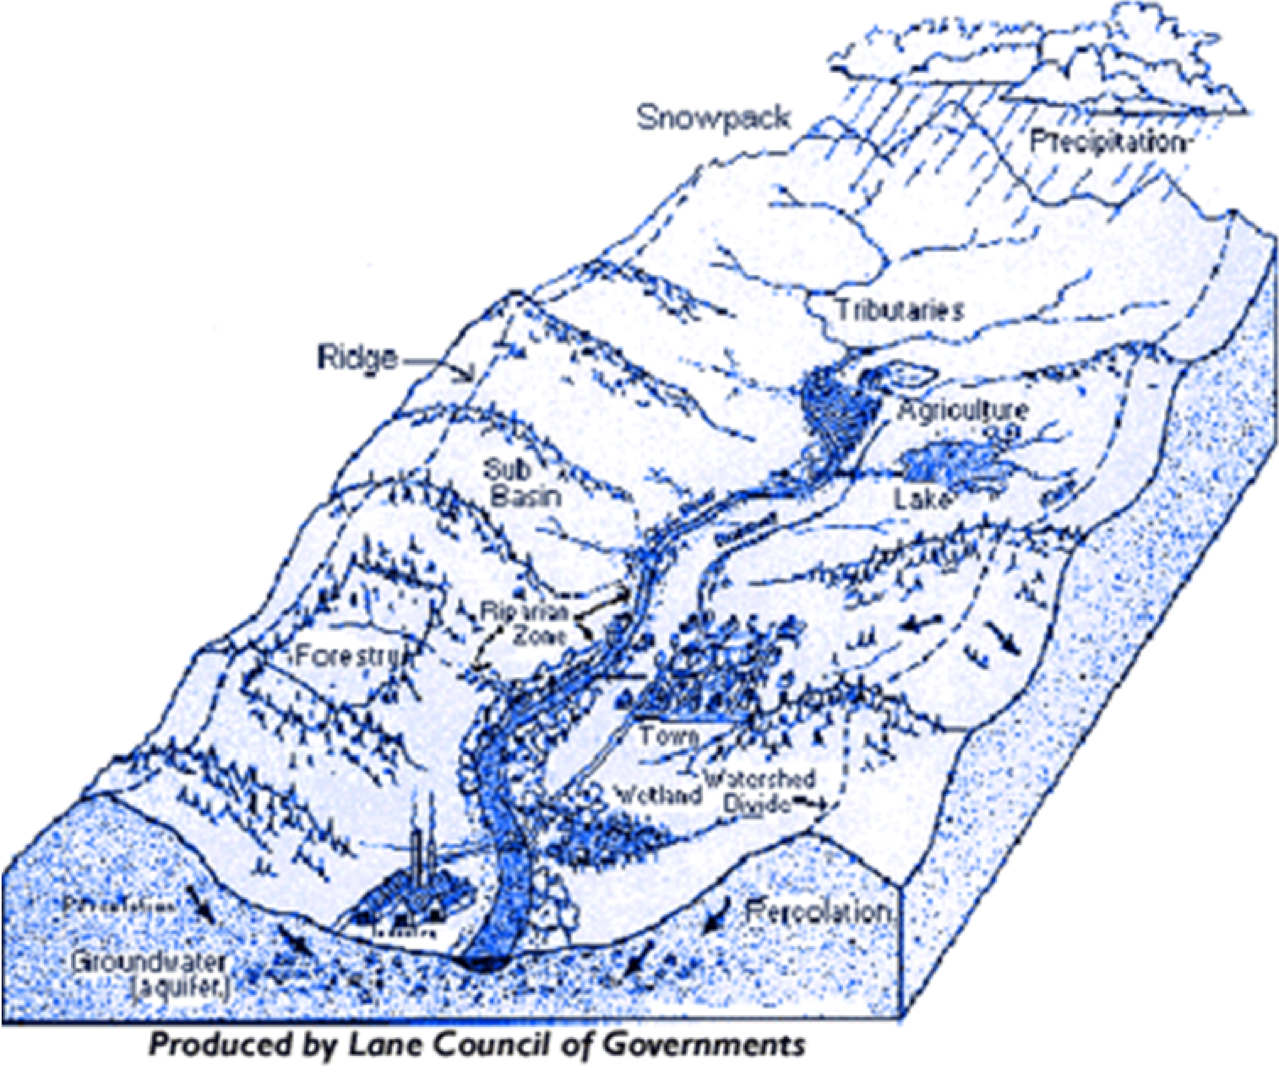
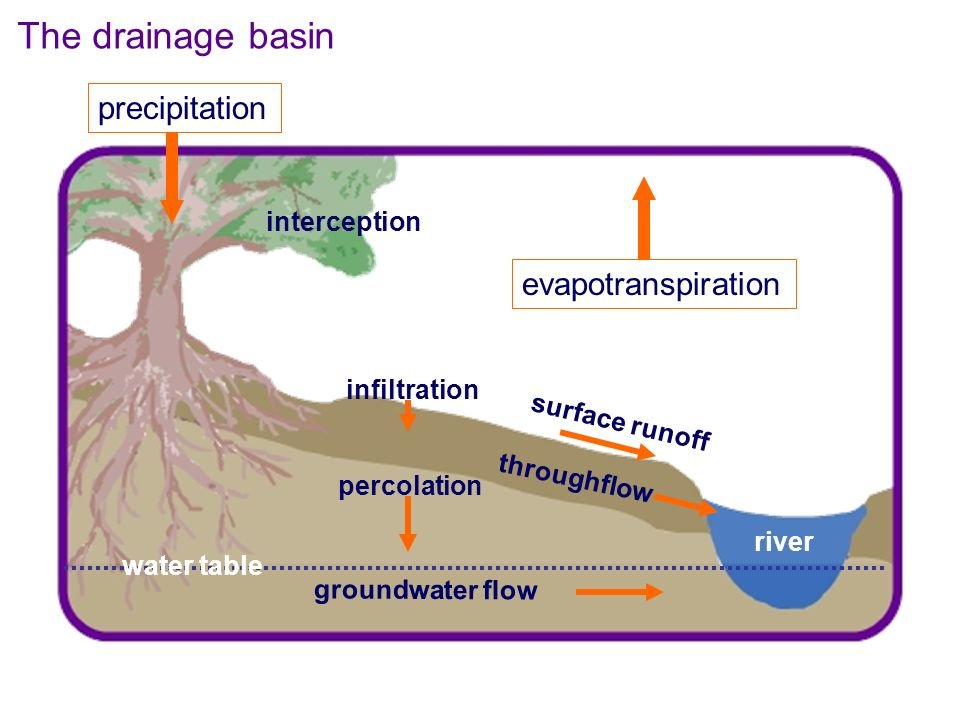
Watersheds
Watershed: An area of land where all of the water drains into the same place.
Highest Point: Divide.
Lowest Point: Basin Outlet.
The change in the amount of water stored in a watershed (dS) with respect to a given time interval (dt or ∆t) is equal to precipitation plus groundwater inflows minus discharge minus evapotranspiration minus groundwater outflows: dS/dt = P + Gin - (Q+ ET+ Gout).
Groundwater flows and discharge are measured as a volume per unit time (m3 per second). Precipitation and evaporation are often measured as a depth per unit time (e.g., meter per day).
Oftentimes the volume of water is divided by the surface area of the region so the quantities have dimensions [L T-1].
Steady State: Water in = Water out. Mathematically, we can set the derivatives equal to zero and rearrange the terms: P + Gin = Q+ ET+ Gout.
The conservation equation would take the form: ΔS/Δt= mI – mQ; mI is equal to the average rate of input to the control volume over the time period Δt and mQ is equal to the average rate of output from the control volume over the time period, Δt.
Residence Time (Tr): The Average time that a given parcel of water spends in a reservoir; Tr=S/mQ =S/mI
S= Mass or Volume
mQ= Average rate of outflow
mI: Average Rate of Inflow
For steady state or a current estimate, assume mQ= mI.
_____________________________________________________________________________
Precipitation
Process of Precipitation
A parcel of air cool as it rises until it reaches the dew point temperature.
Cooling at the Dry Adiabatic Lapse Rate: 1C/100m.
Adiabatic: No heat exchanged with surrounding air.
As parcel of air rises, the pressure decreases, and the volume increases.
Air parcel rises via convergence, convection, and orography.
Convection: Rise of warm air due to solar warming.
Air rises and cools giving off latent heat that helps other air around it to rise and cool.
Storms tend to be shorter and more intense.
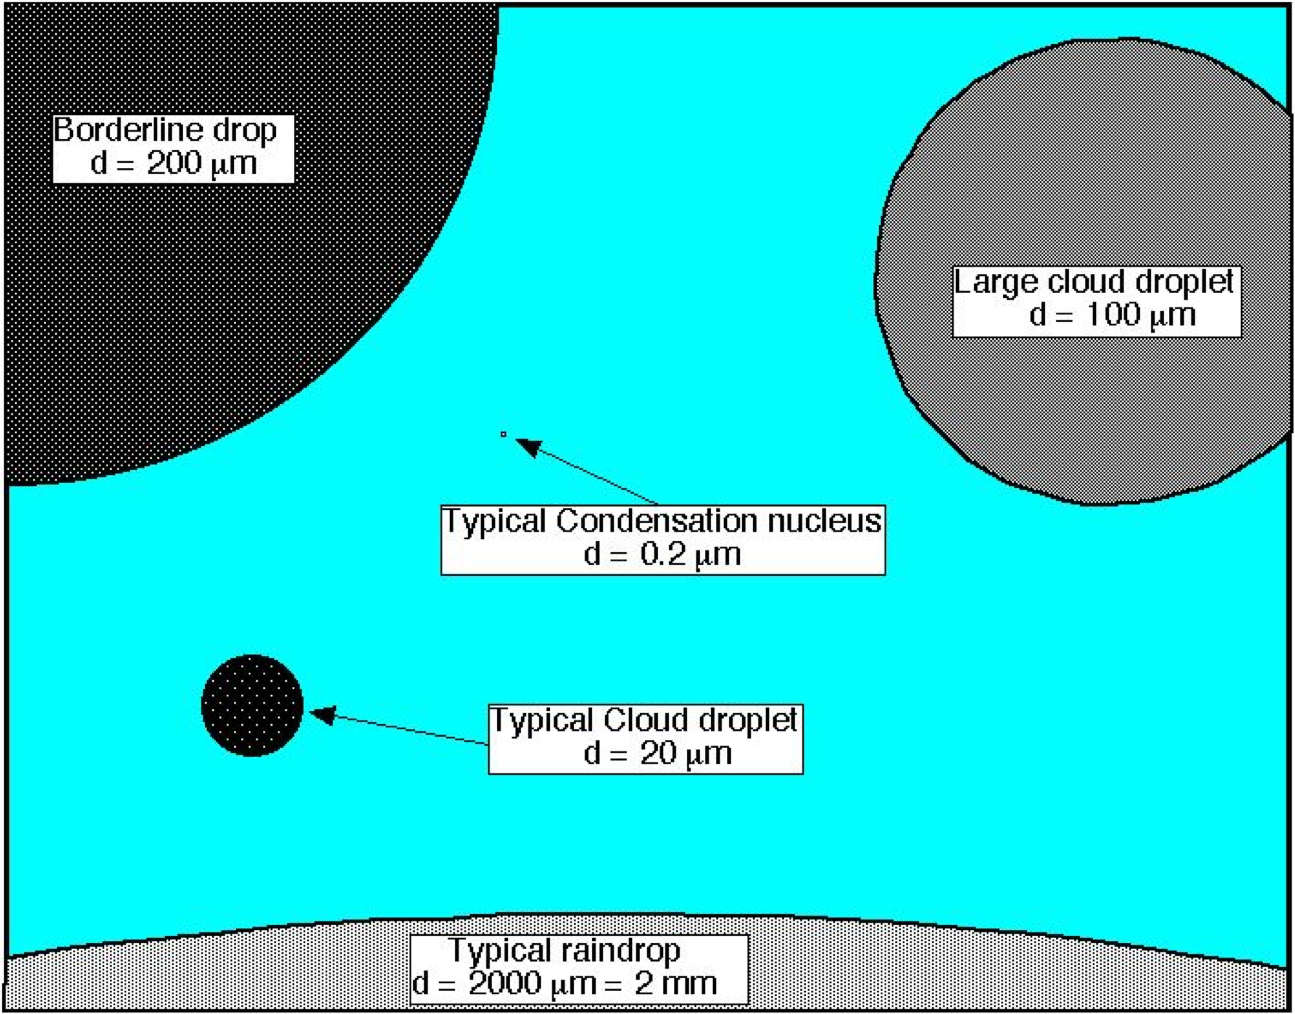
Water droplets condense onto cloud condensation nuclei; normally clay, sea salt, volcanic material (ash), smoke (aerosols) of which water droplets condense onto.
Droplet collide and grow until their size exceeds the rate of uplift (~500-4000uM in diameter).
A supply of water vapor rises to replace moisture that falls out of the cloud.
Interception: Retainment of water on the surface of leaves.
The amount of water intercepted depends strongly on: vegetation type, time of year and stage of plant development as well as the intensity, duration, frequency and form of precipitation
The proportion of annual precipitation intercepted can range between 10 to 40%.
Measuring Precipitation
Rain Gauges: Non-Recording and Recording.
Freshly Fallen snow has equivalent of 5-20% water (1 Meter of snow ~ 5-20cm of rain).
_____________________________________________________________________________
Runoff
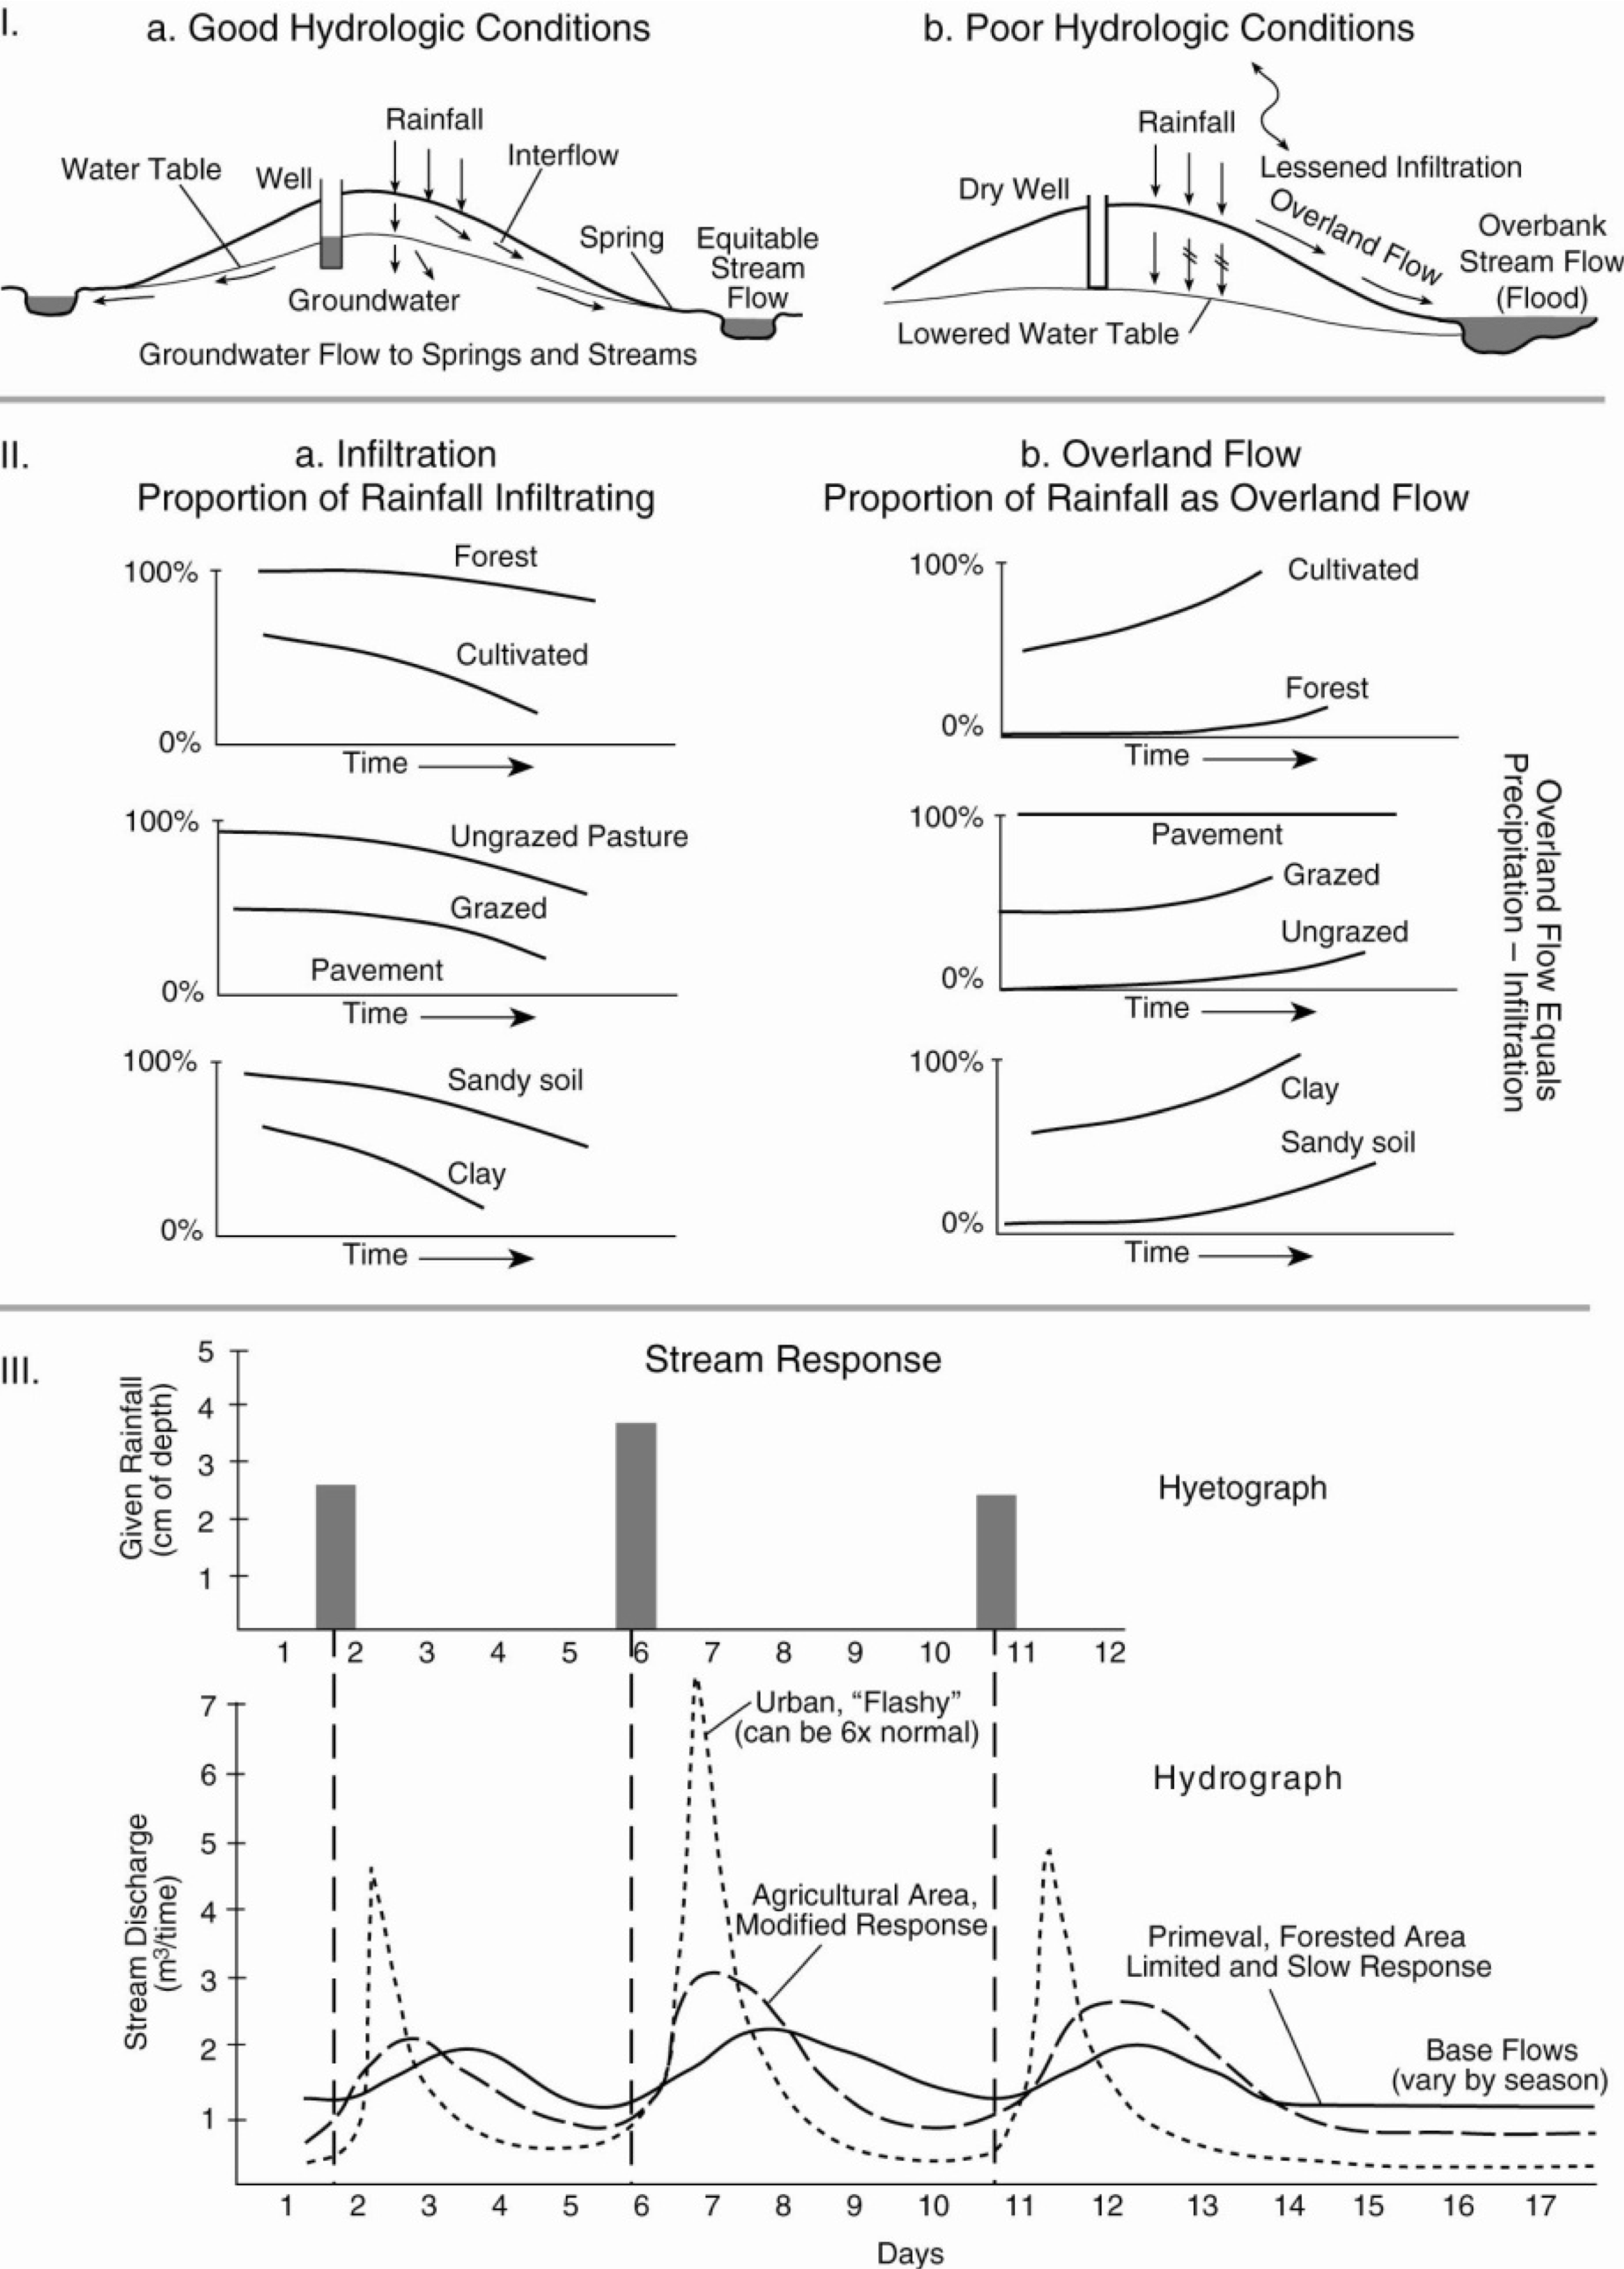
A significant portion of rainfall in forested watersheds is absorbed into soils (infiltration), is stored as gw, and is slowly discharged to streams through seeps and springs. Flooding is less significant in these more natural conditions because some of the runoff during a storm is absorbed into the ground, thus lessening the amount of runoff into a stream during the storm. As watersheds are urbanized, much of the vegetation is replaced by impervious surfaces, thus reducing the area where infiltration to gw can occur. Thus, more stormwater runoff occurs—runoff that must be collected by extensive drainage systems that combine curbs, storm sewers, and ditches to carry stormwater runoff directly to streams. More simply, in a developed watershed, much more water arrives into a stream much more quickly, resulting in an increased likelihood of more frequent and more severe flooding.
Runoff is impacted by precipitation type, rainfall amount/duration/intensity/distribution over the watershed, direction of storm movement, antecedent precipitation and resulting soil moisture, land type, vegetation coverage, soil type, drainage area, basin shape, topography, slope, drainage network patterns, surface water areas.
Runoff into Streams: Stream response to a precipitation is determined by spatial and temporal precipitation input rates, the time required for each drop of water to travel from where it falls to the stream network, and the time required for the water to travel in-channel from the point where it enters the stream to where it is measured. This amount of time is often determined by the length of the channel. In small watersheds that are less than 50 sqkm, it is mostly determined by the hill slope travel time, while in larger watersheds, the travel time throughout the stream network becomes increasingly important.
Mechanisms Producing Runoff
Channel Precipitation: Rain that falls directly on a stream and is incorporated in channel flow. This volume can be calculated as: Wcp = W·Acn.
W: The total amount of rain.
Acn: The surface area of the stream above the channel measurement point. For smaller watersheds, this has been found to contribute up to 40% of total event flow.
Overland Flow: Consists of Hortonian and Saturation overland flow.
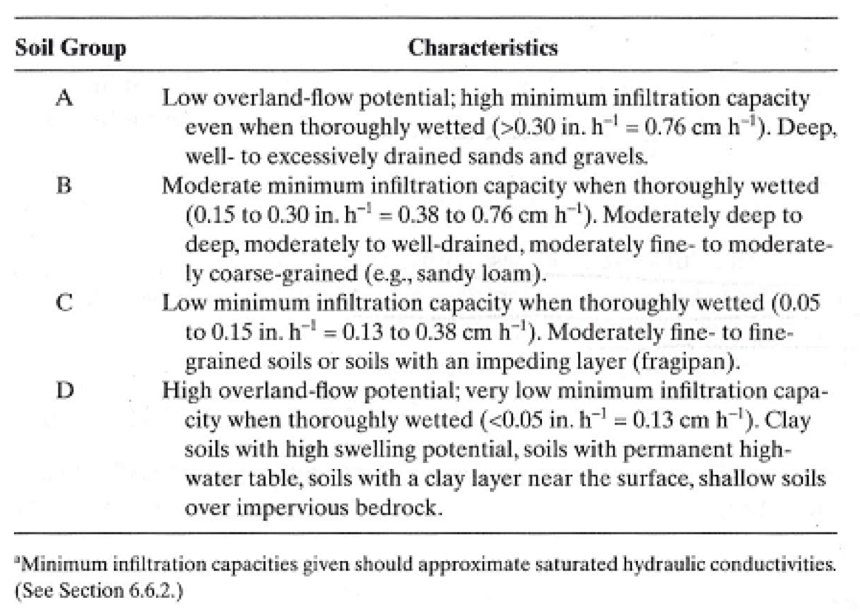
Hortonian Overland Flow: Where the soil is saturated from above. This occurs when the water input rate is greater than the saturated hydraulic conductivity for a duration of time that exceeds the time of ponding. Important in semi-arid to arid regions where rainfall intensities tend to be intense and/or natural surface conductivities low, and areas where soil frost or human activity has decreased the infiltration rate.
Saturation Overland Flow: Where the soil is saturated from below. Once the soil saturates from below, additional water cannot infiltrate into the soil and this water travels as saturation overland flow. The major mechanism producing event runoff in humid regions and forested areas.
Modeling Rainfall Runoff
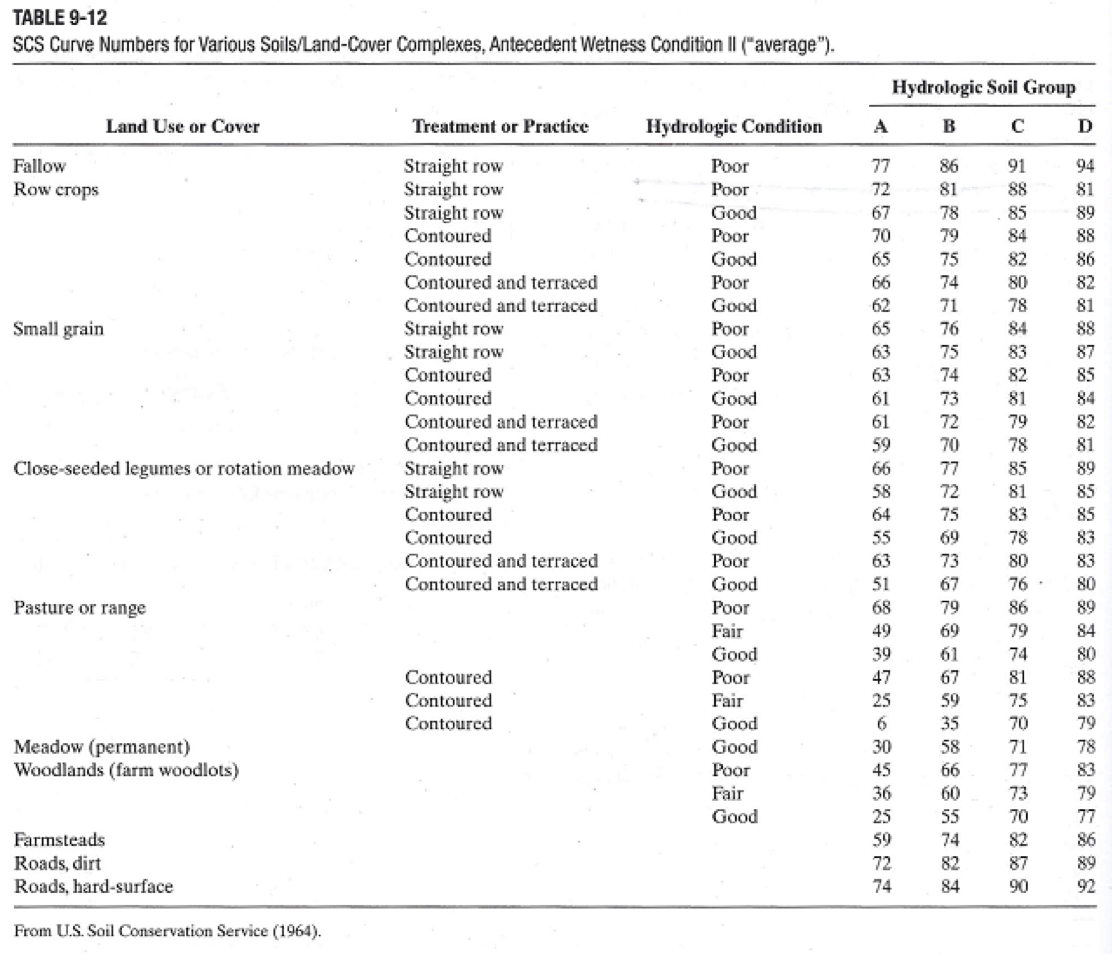
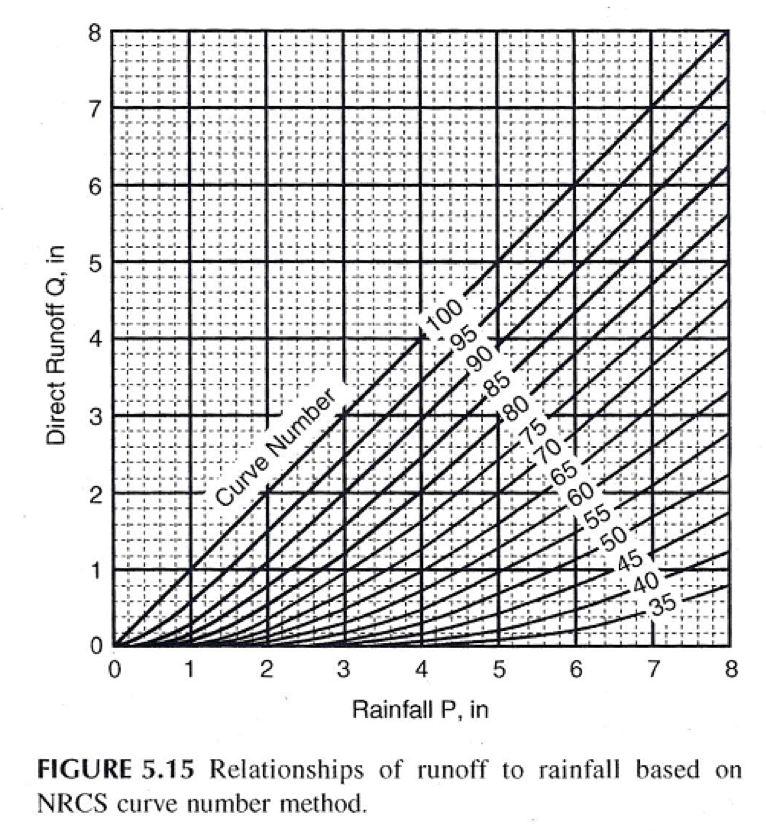
SCS Method: Rainfall runoff modeling for suburban and rural areas.
NRCS Method: Rainfall runoff modeling for smaller watersheds and/or culverts.
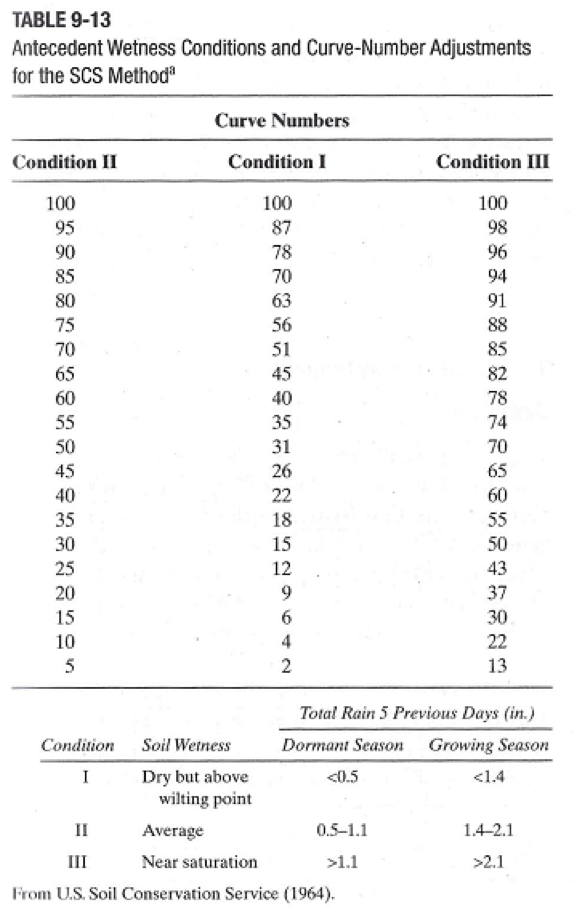
Estimates Q (effective rainfall or accumulated runoff) using, Q = ((P-Ia )^2)/((P-Ia+S)) where P is precipitation, and S is estimated as S = (1000/CN)-10.
CN: Curve number, can be adjusted to reflect the antecedent wetness of the watershed; usually .2S
When a watershed consists of more than one soil/land, a weighted average curve number is typically used.
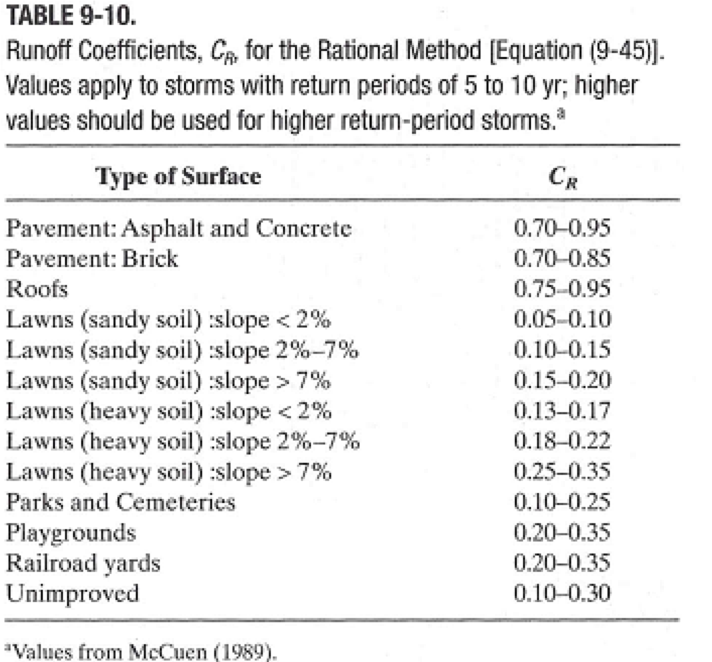
The rational method: Generally used for urban areas; qsub(pk) = uR*C*i*A
uR: Conversion factor (1.008).
C: The runoff coefficient.
A: Drainage area.
I: Average rainfall intensity, duration is equal to the time of concentration of the watershed.
Time of Concentration: The time it takes for water to flow from the most remote point on a watershed to the outlet of the watershed; determined using the Kirpich equation; tc = 0.00778L^0.77*S^-0.385
S: Mean slope and is expressed as a fraction and the longest flow path is the hydraulic length (L).
The Kirpich equation has been shown to estimate time of concentrations that are too rapid.
Hyetograph: Water input vs. time; a graph of the amount of water that is input as a function of time.
Hydrograph: Water output v. time; a graph of stream discharge at a given stream cross-section as a function of time.
Rising Limb: The hydrograph portion characterized by increasing streamflow up to the peak flow rate.
Falling Limb: The hydrograph portion characterized by decreasing discharge following the peak flow rate.
Hydrograph Separation Line: Separates event flow from baseflow.
Time of Rise: Duration of time starting from when water is input to the system and ending when the hydrograph peaks.
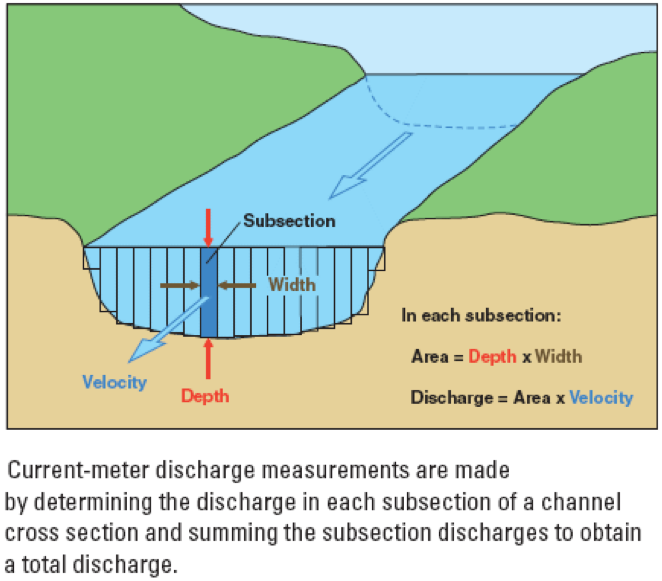
Discharge = Area of stream cross-section*Velocity of water through the cross-section; generally, in cfs.
Gage Height: Stream Depth.
Time of Concentration: Time it takes water to travel from the most distant part of the contributing area in the watershed to the outlet.
Bank storage: The lateral exchange of water between the channel and banks.
_____________________________________________________________________________
Open Channel Flow
Open Channel Flow: Flow of water in streams, ditches, channels and large rivers where the surface of the flow is open to the atmosphere; a function of vegetation cover, precipitation patterns, gw, topography, cross-sectional area, channel slope, channel roughness, sediment load, and channel stability.
Uniform Flow: Fluid is assumed to have the same velocity and direction at every point.
Non-Uniform Flow: At any given instant, the velocity is not the same at every point.
Steady Flow: The conditions of velocity, pressure, and cross-section may differ from point to point but do not change with time.
Non-Steady Flow: If at any point in the fluid, the conditions change with time, the flow is described as unsteady.
Flow Categorization
Steady Uniform Flow: Conditions do not change with position in the stream or with time.
Steady Non-uniform Flow: Conditions change from point to point in the stream but do not change with time.
Unsteady Uniform Flow: At a given instant in time the conditions at every point are the same, but change with time.
Unsteady Non-uniform Flow: Every condition of the flow may change from point to point and with time at every point.
Low Streamflow: Annual minimum flows averaged over 7 consecutive days.
Event Flow (‘Storm Flow’): Portion of flow that is attributable to both precipitation and water (such as pre-event soil water) that has moved through the system as a result of the increase in water flow through the soil profile.
Baseflow: Gw (could also include soil water draining to a stream).
Streamwater Depletion: Net effect of both the gw that is intercepted by the well, which would have otherwise gone to the stream and extraction from the stream due to locally induced head gradients.
Flow Systems
Perennial Stream: Stream that flows all year.
Intermittent Stream: Stream that flow only during wet seasons.
Ephemeral Stream: Flows only in response to a water-input event and are generally losing.
Local flow System: Water moves locally from a recharge area to the next adjacent discharge area. The more pronounced the relief, the deeper the local systems tend to extend.
Flow Velocity
Manning’s Equation for Uniform Flow: Most commonly used method to determine flow velocity; best suited for uniform, steady open channel flow; Q = a x 1.486/n x R2/3 x S1/2
Q: Flow.
a: Input Area.
n: Coefficient of roughness (http://www.sd-w.com/civil/mannings_formula.html)
If the flow is deep relative to the size of the bed material, n can be estimated using the following equation: n=0.04(d50)^(1/6) where d50 is the mean bed material size (meters).
R: Hydraulic radius (a/P) where P is the wetted perimeter (ft) and a is the cross sectional area (ft2)
S: Slope of channel bed or pipe.
1.4486 is a unit conversion factor (Use 1 for metric).
Darcy- Weisbach Equation: Measures flow velocity taking into account particle size of the channel bed by pebble count; v^2 = (8gRS)/f
Pebble Count: Done by setting up a cross section across a stream and using a gravelometer to determine the diameter of particles that are greater than 2 mm. To conduct a ‘pebble count’, you randomly pick up a pebble at each consecutive point going across the cross section and write down the diameter of this pebble. You can then use this information to plot a cumulative frequency distribution curve.
R: Hydraulic Radius
S: Channel Bed Slope
g: acceleration due to gravity (9.81m/s2)
f: friction factor: f^(-0.5)=2.03 log〖(xR/(3.5d84 ))〗
x = 11[R/y]^(-0.314); y is the max flow depth for width to depth ratios greater than 2.
d84: Particle diameter, which you can take off the cumulative frequency chart that 84% of the particle sizes are finer then.
General Flow Equation (‘Continuity Equation for Steady Flow of an Incompressible Fluid’): Determines Discharge of a flow. Once you have obtained velocity (possibly from either Manning’s Equation or the Darcy-Weisbach Equation), you can use the general flow to determine discharge; q = va
q: flow rate in cfs or m3/s.
v: average velocity of flow at cross section (ft/s) or (m/s).
a: area of the cross section (ft2 or m2).
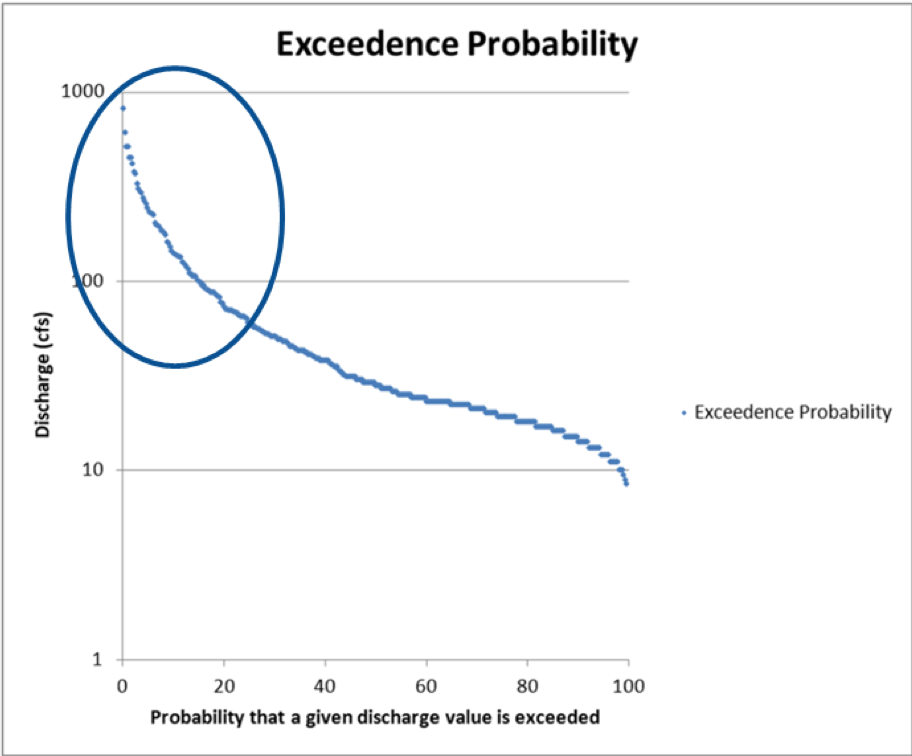
Flow Duration Curve (FDC): A cumulative frequency curve that shows the fraction of time that streamflow exceeds a given value over a period of interest (generally average daily discharge is used). Daily streamflow data for period of interest: http://waterdata.usgs.gov/dc/nwis/rt
Flow Energy
There are three flow regimes that can occur in an open channel and are classified based on the relationship between actual water depth, normal water depth, and the critical depth.
Normal Depth: The depth of flow that would occur if the flow was uniform and steady.
Critical Depth: The depth of flow where energy is at a minimum energy for a particular discharge.
Froude = 1.
Subcritical: For deeper depths, flow will be stable and the velocities relatively slower; includes uniform flow.
Froude < 1.
Occurs when actual water depth > critical depth.
Flow that possesses the minimum possible energy
Supercritical: For the shallower depth, the flow will be unstable and the velocities relatively higher.
Froude > 1.
Dominated by inertial forces and behaves as rapid or unstable flow
Actual depth < critical depth.
Hydraulic Jump: Where supercritical flow transitions to subcritical flow; when rapidly flowing liquid is abruptly slowed, it increases in height, converting some of the flow's initial kinetic energy into an increase in potential energy, with some energy irreversibly lost through turbulence to heat. In an open channel flow, this manifests as the fast flow rapidly slowing and piling up on top of itself. A high energy loss with erosive potential.
Calculating the Specific Energy of a flow, the energy head relative to the channel bottom; E = (v^2/2g)+d
E: Specific Energy (ft) or (m).
v: Mean Flow velocity (ft/s) or (m/s).
g: gravitational constant (9.81m/s2).
d: depth (m) or (ft).
E = ((q/w)^2)/(2gd)^2) +d
w: width of the stream cross section.


_____________________________________________________________________________
Subsurface Flow
Groundwater Flow Characteristics: Elevation gradient, recharge/discharge areas, heterogeneity of the geologic materials, thickness of materials, and the configuration of the water table.
Lithology: The mineral composition, grain size distribution and grain shape characteristics of rocks and unconsolidated geologic materials; controls the hydraulic conductivity.
Stratigraphy: The geometrical and age relations among the various formations (typically layered, with the exception of intrusive igneous rocks).
Structure: The general disposition, arrangement or positions of formation (regionally extensive mappable geologic unit with reasonably constant lithology). An aquifer may comprise one or more formations.
Water Flow Systems
Regional Flow System: Gw flows from the recharge area farthest from the main valley (i.e., the divide) to the discharge area in the main valley.
Gaining Stream: A stream found in a discharge area to gw flow. The stream’s discharge increases in the downstream direction.
Losing Stream: Discharge decreases in the downstream and is a zone of recharge to the gw table.
Interflow: Downslope flow occurring between the ground surface and water table.
Macropore Flow: Rapid subsurface response to water input can occur through large pores produced by roots and soil fauna. Typically, these pores are on the order of 3 to 100 mm in diameter.
Modeling soil water flow
Darcy’s Law: Describes the flow of water in an unsaturated, porous material (Q); Q= -Kh*A(dh/L)
dh: Hydraulic gradient
Kh: Hydraulic conductivity
A: Area
L: Flow Path Length
Flow rate is proportional to the hydraulic gradient.
Hydraulic Head: A measure of the PE available for gw flow; measured by lowering an electronic tape (or a steel tape with chalk on it) into a well. These measurements can be used to create a potentiometric map.
Hydraulic Head = Pressure Head + Elevation Head + Velocity Head (VH is often neglected when considering gw flow).
Equipotential Lines: Lines of equal energy; water will flow in the direction from higher equipotential lines to lower equipotential lines.
Hydraulic head (Depth) = Elevation of Measuring Point – Value obtained from electronic tape.
Specific yield (Sy): The volume of gw that will drain under gravity relative to the total volume of the aquifer.
Specific Retention (Sr): The difference between Sy and φ; the amount of water that will not drain under the influence of gravity.
Horton: f = fc + (f0-fc)*e - βt
f: The infiltration rate at time t
fc: The final infiltration capacity
f0: The infiltration rate at time zero
β: A best fit parameter
Green & Ampt Model.
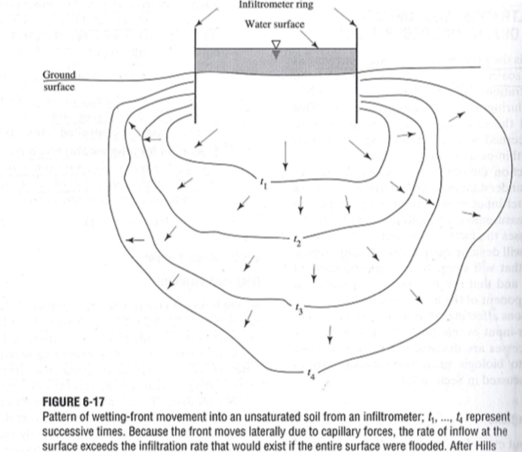
Ring Infiltrometer.
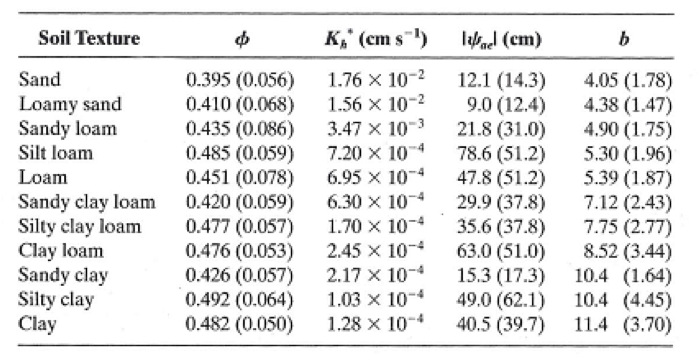
Hydraulic Conductivity (Permeability, Kh): The rate at which water moves through a porous medium; Kh(θ)=Kh*·(θ/φ)c; a function of soil suction and soil water content.
Under saturated conditions, it is largely determined by the soil-grain size. However, under unsaturated conditions, the hydraulic conductivity is determined by grain size and the degree of saturation.
The parameter c can be thought of as the pore-disconnectedness index (ratio of the length of the path followed by water in the soil to a straight-line path): c= 2b +3
The degree of saturation significantly influences the hydraulic conductivity (Kh). This is the case because water flow avoids air pockets and thus, Kh is reduced as air pockets fill void spaces.
Fine grained soils tend to have lower hydraulic conductivity than coarse grained soils.
Isotropic: An aquifer in which hydraulic conductivity is the same for all directions
Anisotropic: An aquifer in which hydraulic conductivity differs for different flow directions
Homogenous: An aquifer in which the conductivity in all directions is the same at all points
Heterogenous: An aquifer in which the conductivity in any direction is different.
Calculating flow of gw (Qgw):
If the hydraulic conductivity and average water table elevations are known, flow nets can be used to determine the total flow into the stream reach.
The discharge per unit length of stream into a stream for each streamtube can be calculated as: Δqgw = Kh·Δh
Δh is the head difference between the stream and the next up-gradient equipotential line.
The total discharge per unit stream length for a reach, qgw is: qgw = n·Δqgw
n: number of streamtubes discharging to the stream.
The total flow into the stream for the reach, Qgw is: Qgw = L·qgw
ΔqGW and qGW have units of D2 t-1 (where D is length and t is time), n is dimensionless, L has units of D and QGw has units of D3 t-1 (i.e., flow units).
Darcy’s Law: Describes the flow of water in an unsaturated, porous material; Q = KA (dh/L).
Flow Gradient: Measured by comparing the water level in the stream with the head measured in a piezometer from a subjacent bed; or the levels in two piezometers inserted to different distances below the bed.
_____________________________________________________________________________
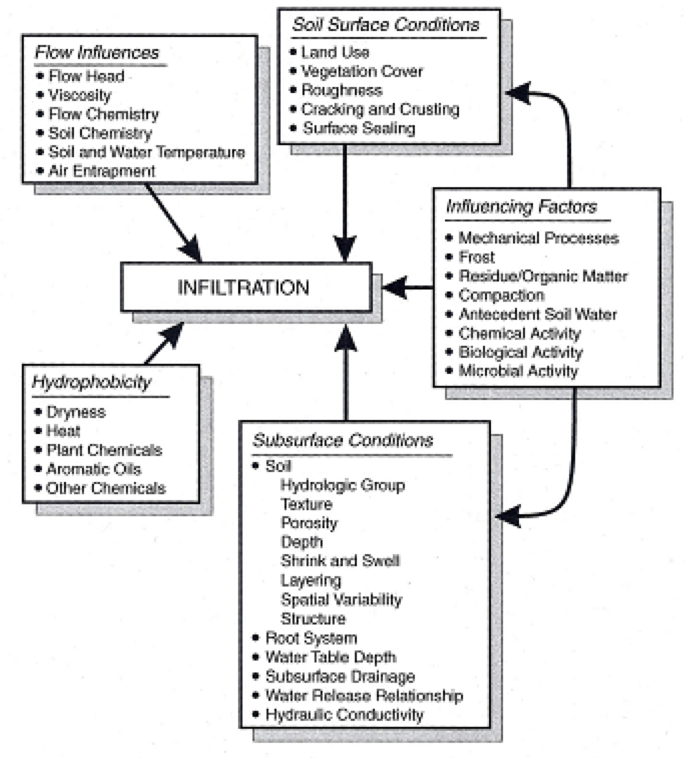
Infiltration
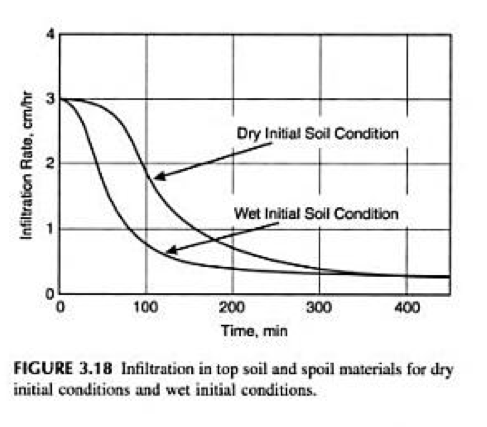
Infiltration rates decrease as soil water content increases.
Modeling Infiltration
Ponding the surface from above and measuring the rate at which the level of ponded water decreases. Measuring the rate at which the water has to be added to maintain a constant level of ponding.
Using a water balance approach where the infiltration rate is calculated as: f(t) = (W-Q-∆H∙A)/∆t
W: The volume of water added.
Q: The volume of ponded water.
ΔH: The change in ponded-water level.
A: The area covered by the infiltrometer.
_____________________________________________________________________________
Groundwater (gw)
Groundwater (gw): Constitutes 30% of the world’s total fresh water (percentage is higher in arid regions).
In the US, GW accounts for ~25% of the water used for domestic, irrigation and industrial uses.
Infiltrated water can carry contaminants from agriculture, industries and waste-disposal sites to the gw reservoir.
Aquifer: A geologic unit that can store and transmit water at a rate fast enough to be hydrologically useful.
There are two major types of aquifers that are distinguished by the nature of their upper boundary:
Unconfined: The upper boundary of the gw flow is the water table. Aquifers recharge from water percolating vertically to the water table and traveling through the overlying substrate.
In an unconfined aquifer, Sy is the water released from pumping an aquifer down by a unit of head.
Confined: The aquifer is saturated throughout and bounded above and below by confining layers. Recharge typically occurs from the upstream end where flow is not confined.
A unit decrease (increase) in head is reflected by a lowering (raising) of the potentiometric surface (aka the water table). The decrease (increase) in storage accompanying the head decrease (increase) is due to: 1) compression (expansion) of the aquifer as the weight of the overlying material is transferred from (to) the liquid to (from) the solid grains, resulting in a slight decrease (increase) in porosity; and, 2) a slight expansion (compression) of the water due to the lowered (increased) pressure.
A triangle with line beneath it symbolizes Groundwater surface.
Residence Time (Tr): For an unconfined aquifer of saturated thickness (H); Tr = (SyH)/R
R: Recharge rate per unit area and is equal to R = Ri + Rsw – CR
Modeling gw: The long-term average water balance for the gw reservoir in the basin; Ri + Rsw +Gin = CR + Qgw +Gout
Ri: Recharge from infiltration.
Rsw: Recharge from surface water bodies.
CR: Capillary rise. Assume that CR is negligible, except where there is a shallow water table and high evaporation rate.
Qgw: The groundwater contribution to streamflow.
The net recharge rate per unit area (R); R = Ri + Rsw – CR
Drawdown: Pumping of gw from a balanced system; proportional to the pumping rate and decreases with distance at any time and increases with time at any distance. The rates of change are controlled by aquifer properties:
Safe Yield: The rate at which gw can be withdrawn without producing undesirable effects such as streamflow, lake, wetlands reduction, land subsidence, and increased economic costs of pumping.
Lower Kh: Larger drawdown spread over a smaller area.
Higher Kh: Smaller drawdown spread over a larger area.
Lower Sy: Larger drawdown spread over a greater area.
Higher Sy: Smaller drawdown spread over a smaller area.
_____________________________________________________________________________
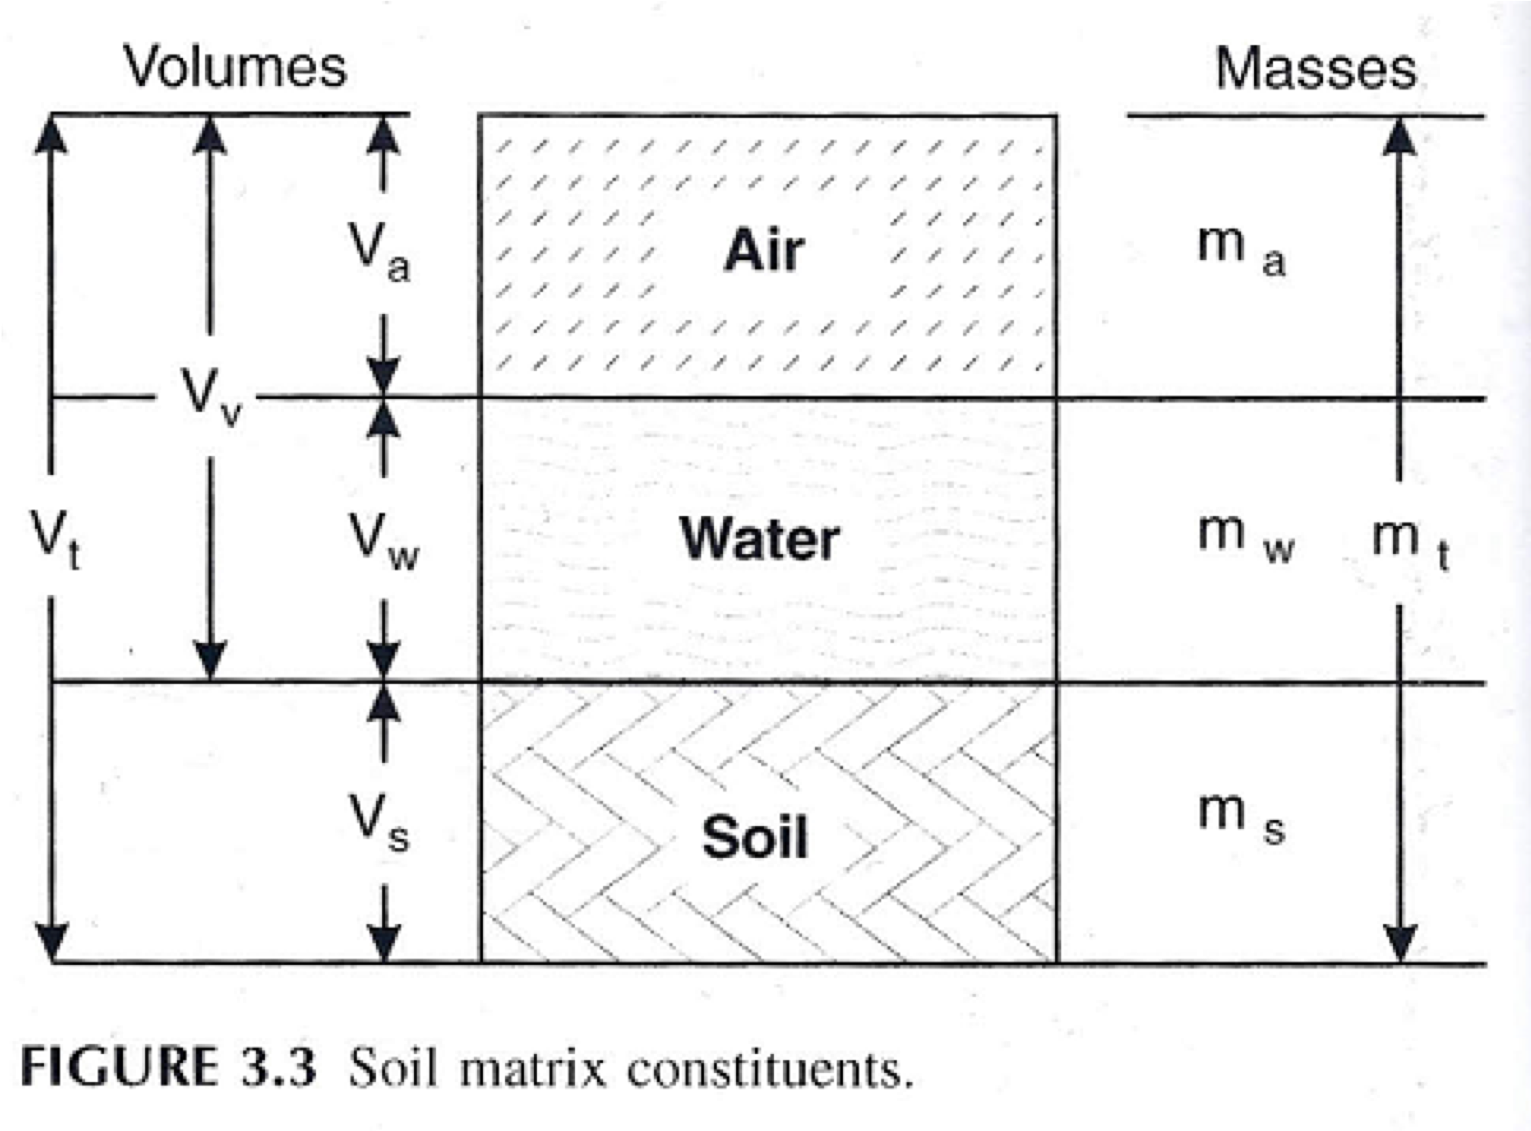
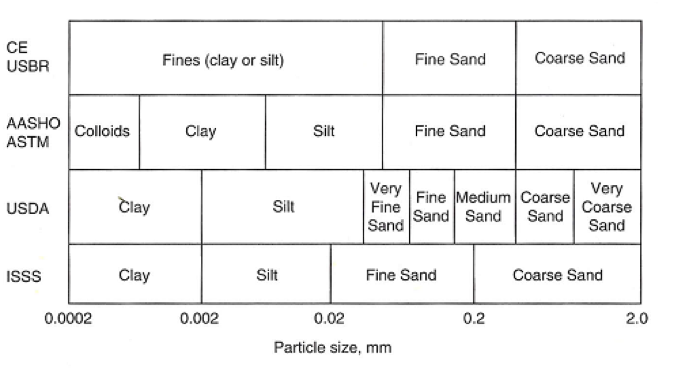
Soil
Soil: A matrix of solid grains between which are pore spaces containing water and air (Grains, Water, Air).
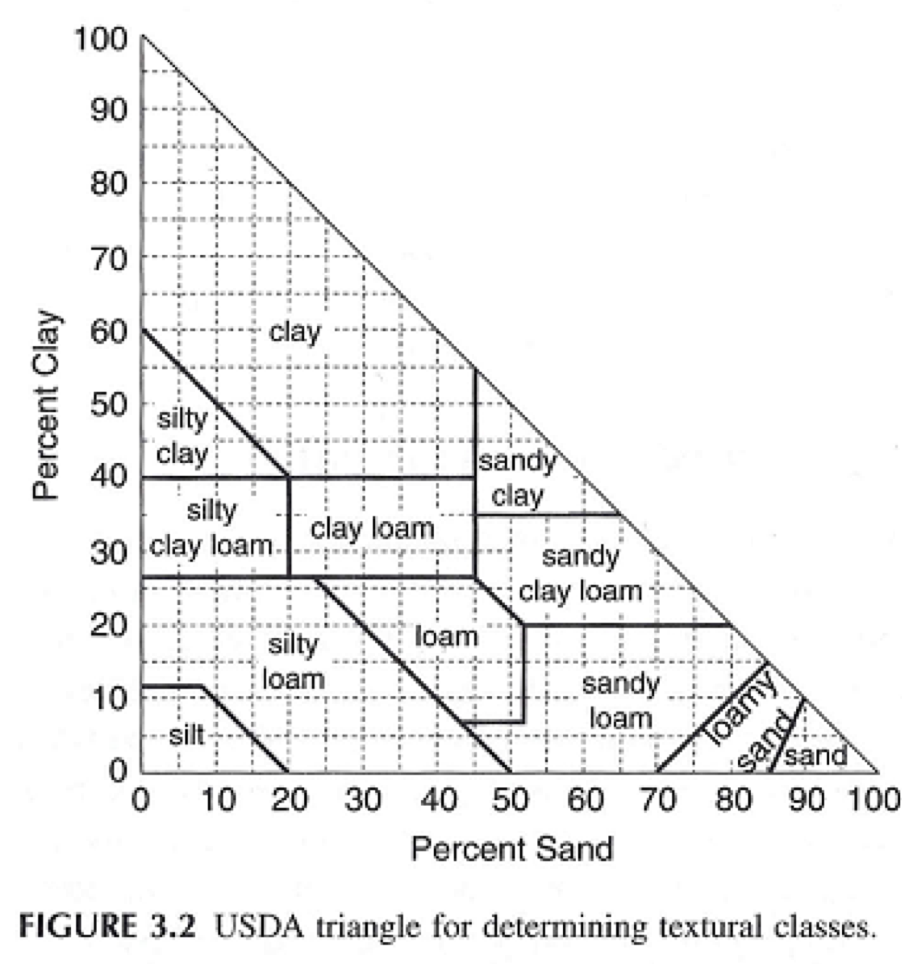
Sand: .05-2mm
Silt: .002-.05mm
Clay: <.002mm
Soil Texture: Determined by the proportions of sand, silt, and clay after particles larger than sand are removed.
Various Soil Terms
Soil Particle Density: (Ps) = Ms/Vs;
Generally assumed to be a constant value at 2650km/m3 (2.65g/cm3)- which is the density of quartz.
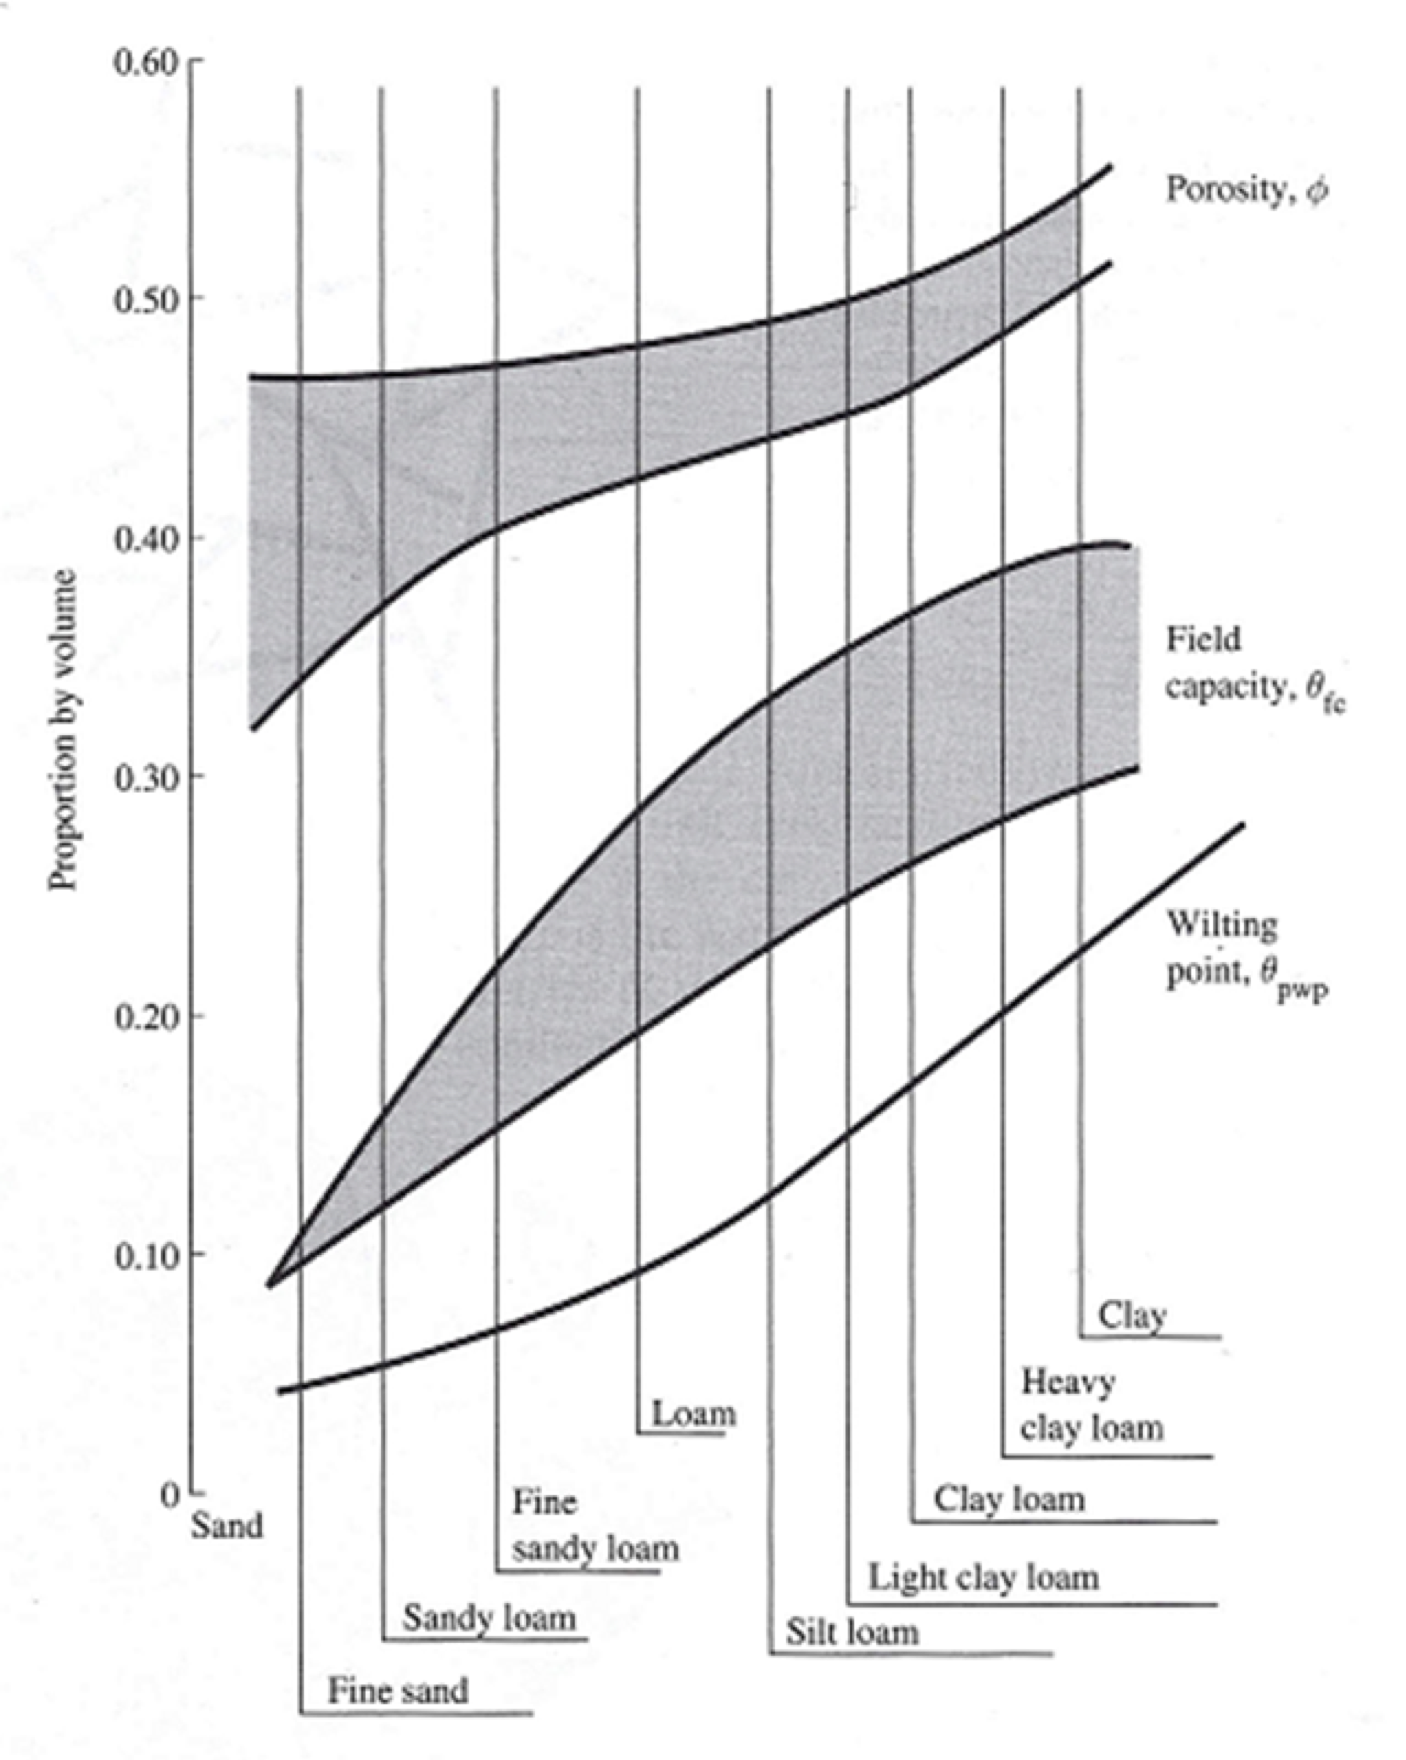
Porosity (φ): Proportion of pore spaces in a soil; φ = (Va + Vw)/Vt
Decreases with depth due to compaction.
In general, finer grained soils tend to have higher porosities than coarse grained soils.
Soil Water Content (θ) & Degree of Saturation or Wetness (S)
Volumetric Soil Water Content (θ): θ=Vw/Vt
Proportion of Pores filled with Water (S): S=Vw/(Va+Vw)=θ/φ
Total amount of water in a soil layer (expressed as a depth)= θ ∗Thickness of soil layer.
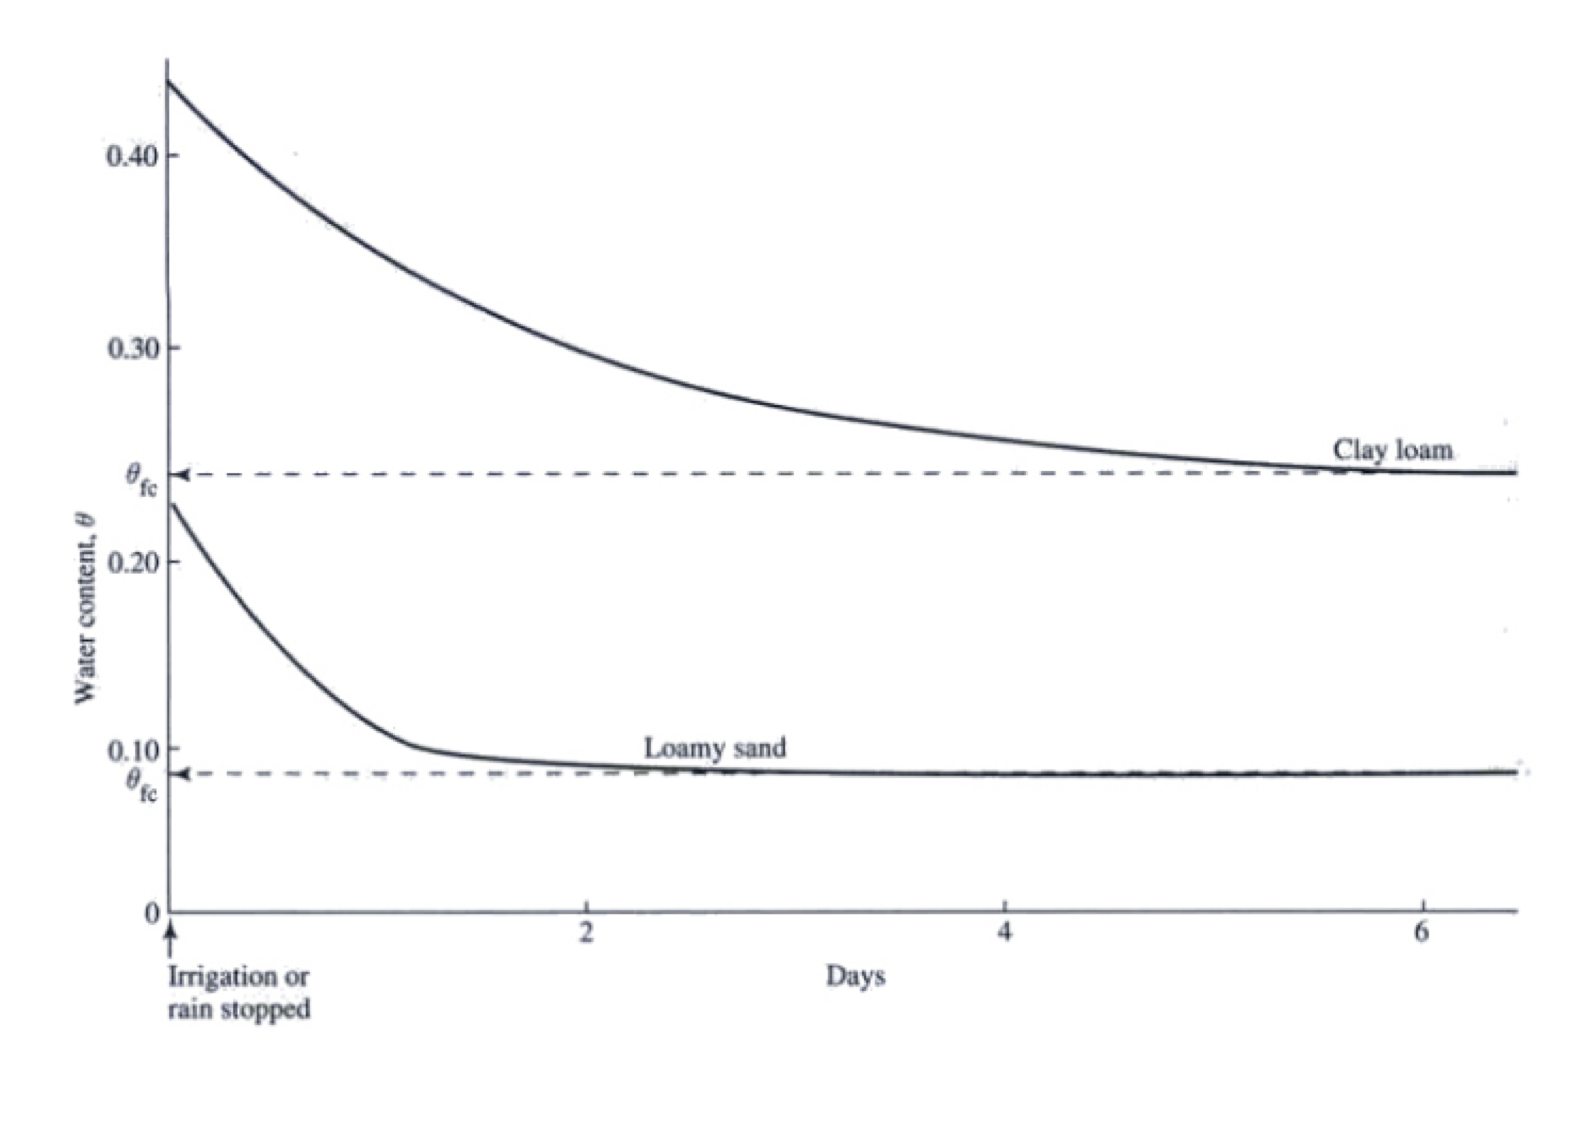
Measuring Soil Water Content: A soil’s field capacity is the water content once a soil is fully saturated and has been allowed to drain (θfc). This is an index of the water content that can be held against the force of gravity.
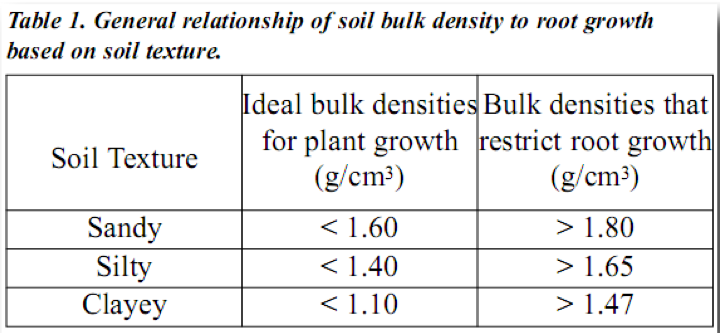
Bulk Density (ρb): The mass of the solid relative to the volume of the soil; increases with depth due to compaction; ρb = Ms/V t= Ms/(Va+Vw+Vs)
1) Taking a sample of soil with a ‘corer’ of known volume.
2) Dry the sample at ~105C overnight
3) Weigh the sample
4) Divide this mass by the volume
5) Methods for measuring bulk density
Excavation Method: A hole is dug and all of the removed soil is retained and weighed. The volume of the hole is determined by placing a plastic bag/balloon in the hole and filling it with water/air until it is flush with the surface.
Clod Method: A soil sample is taken and coated with a substance such as paraffin that prevents water from entering the clod. This clod is then weighed and the amount of water displaced by the clod is equal to its volume.
Radiation Method: Gamma radiation is emitted at a known rate and the rate at which this radiation is transmitted through or reflected is related to the density of the surrounding soil.
Neutron Moisture Meter: A probe that emits high-energy neutrons that collide with the nuclei of atoms in the soil and a detector that measures the percentage of neutrons that have had their energy changed. The energy emitted by the neutron moisture meter is only changed by collisions with hydrogen nuclei
Advantages: Measurements can be taken at several depths and they are very accurate.
Disadvantages: Working with radioactive material, expensive, requires extensive calibration, measurements are not continuous in time.
Time Domain Reflectometer: Based on the principle that water, air and soil have different dielectric constants. For this probe, a pulse of electromagnetic radiation is emitted along dual probes which have been inserted into the soil. This pulse is reflected and returned at a velocity characteristic of a specific dielectric constant.
Advantages: Accurate and continuous in time.
Disadvantages: Probes measurements are affected when scratched.
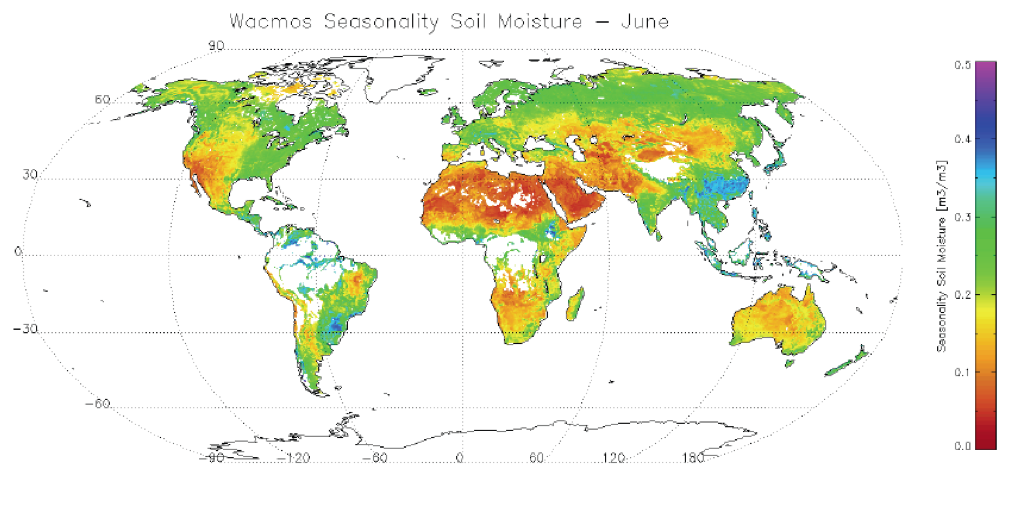
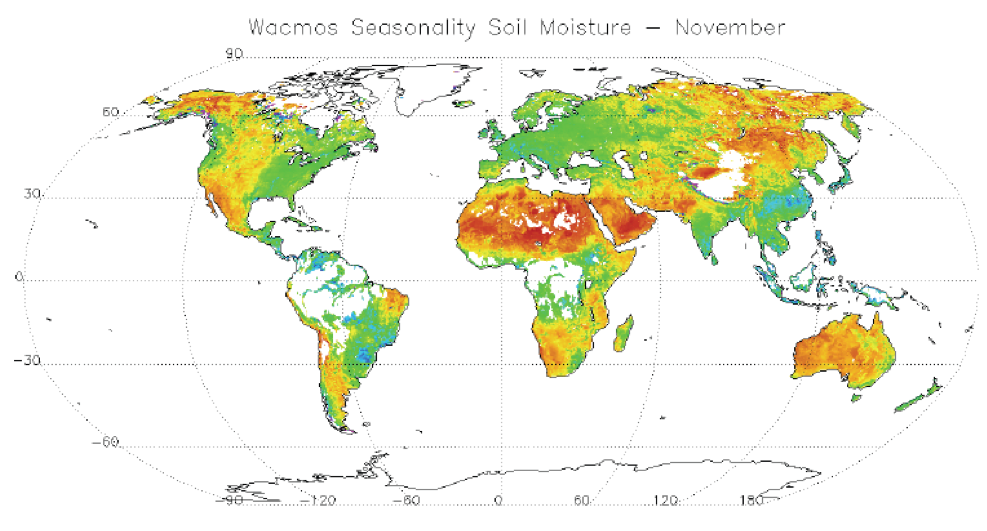
Microwave Remote Sensing: Provides information on a continual basis about the soil-water content over a large area.
Active (RADAR) has high resolution (1km2) but measurements are made difficult by surface roughness and vegetation.
Passive (satellite) are less affected by surface conditions but have a lower resolution (100-1000km2).
Soil Moisture Climate Change (ESA): https://www.esa-soilmoisture-cci.org/
_____________________________________________________________________________
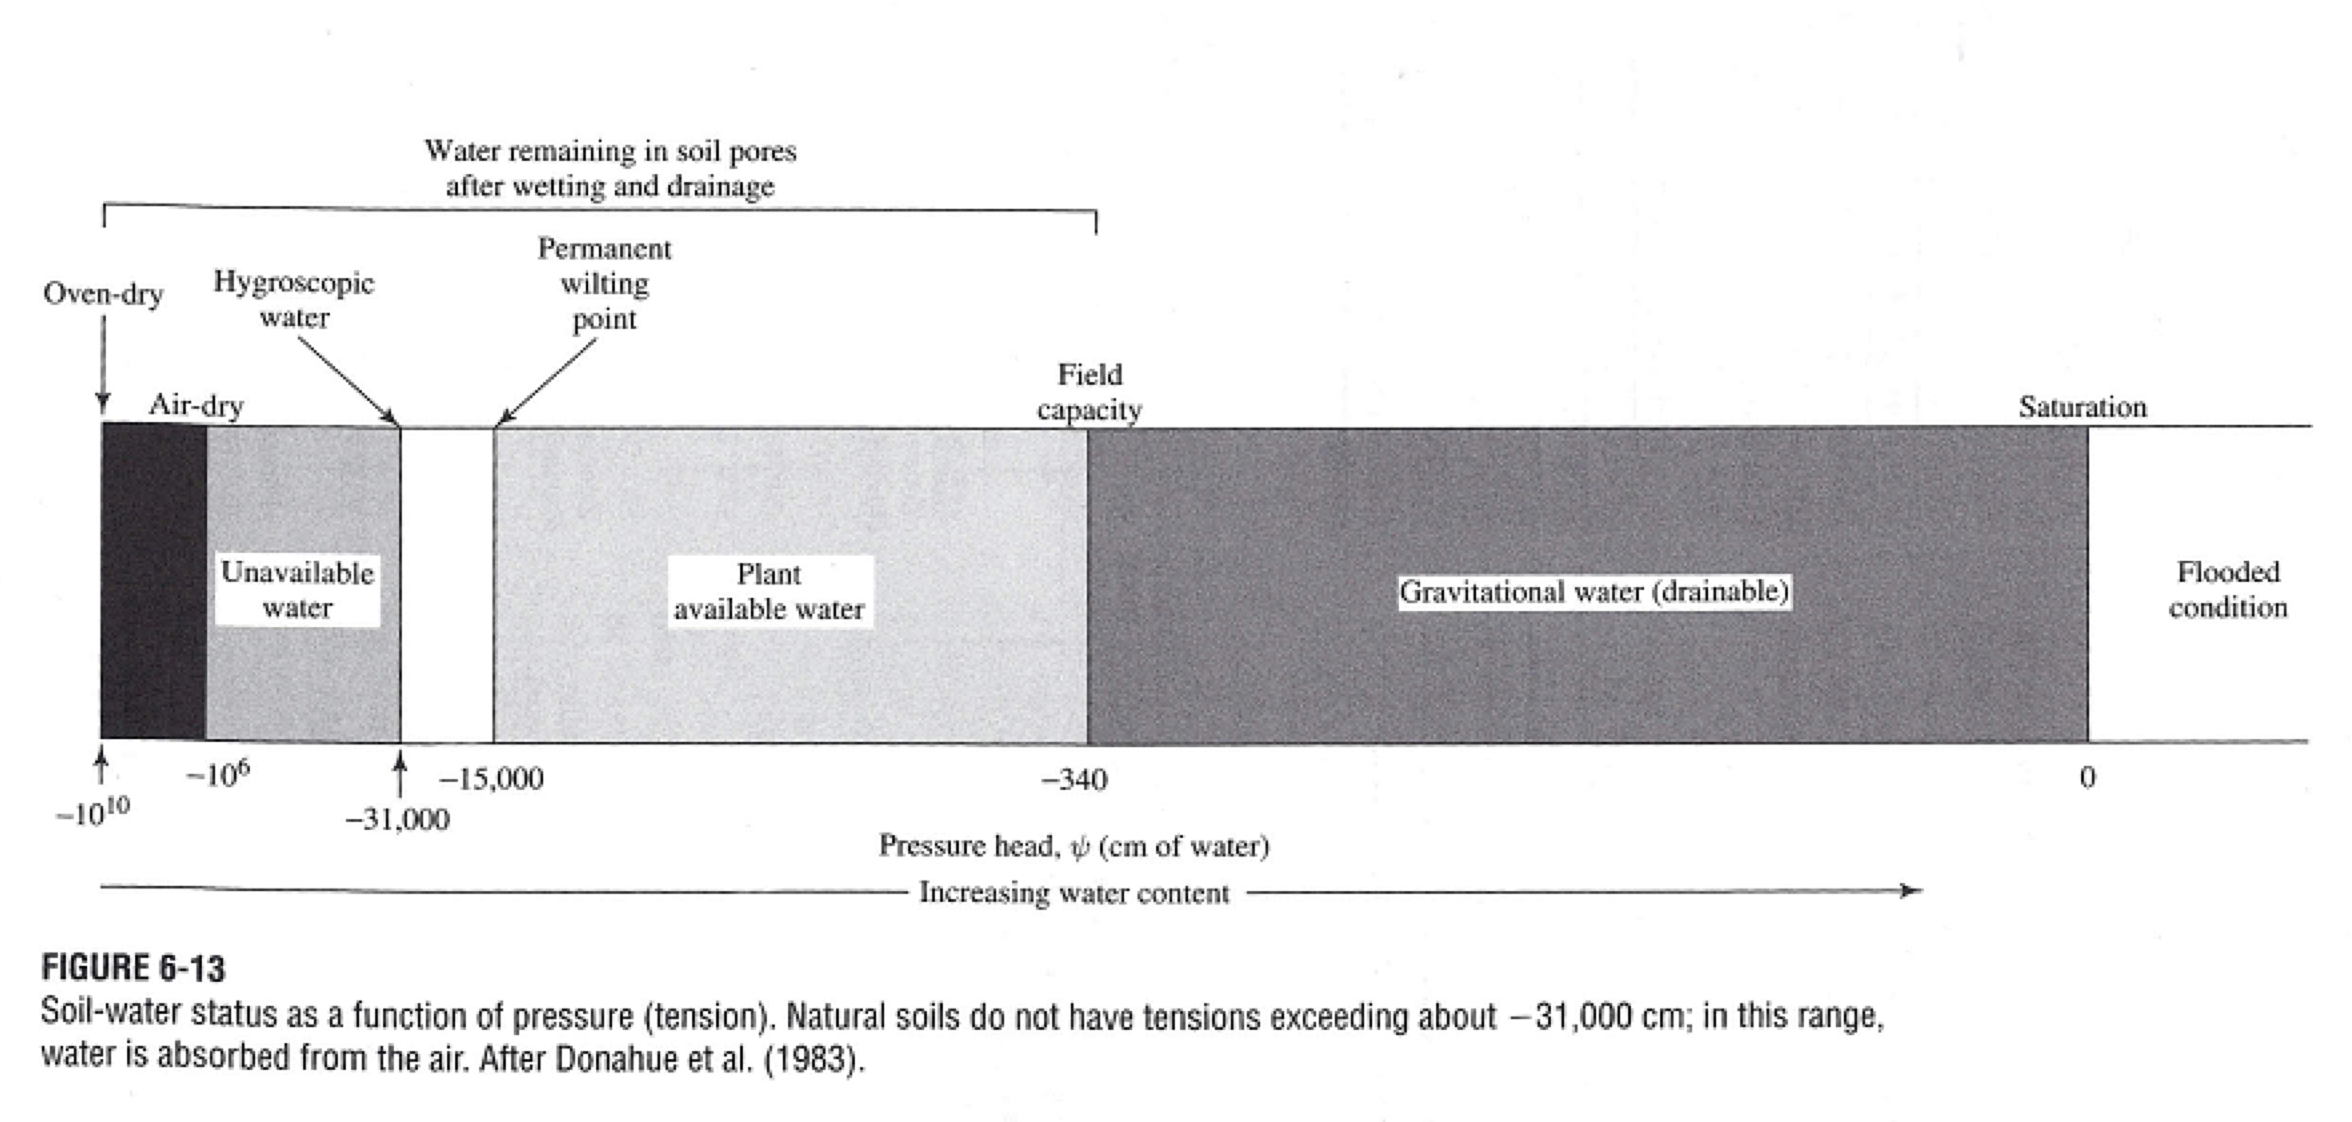
Surface Tension
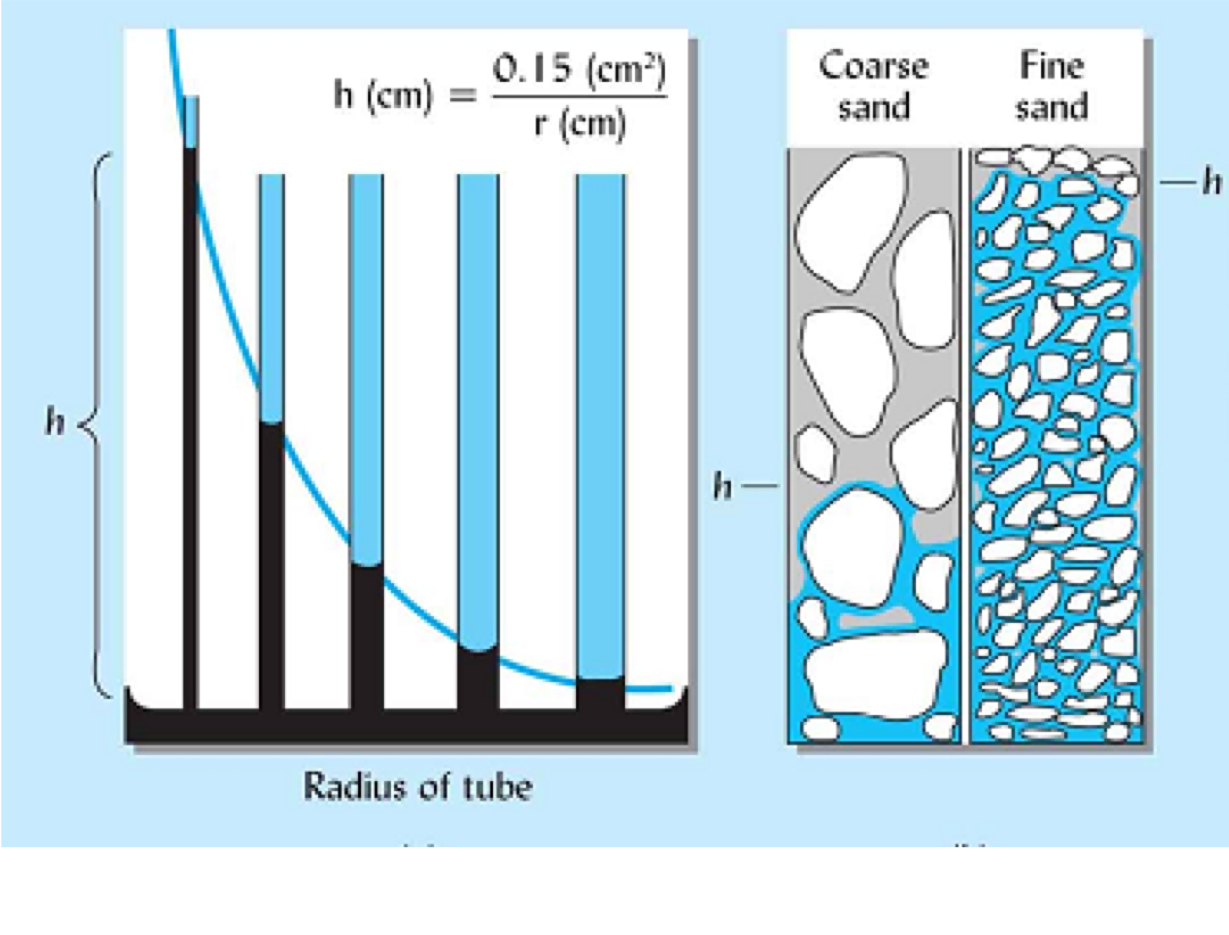
In unsaturated soils, water is held to mineral grains by surface tension forces, also known as capillary forces.
Movement of water through a soil is caused by tension and gravitational forces.
When water moves into a pore, gravity and tension forces work together. Gravity pushes the water into the pore and tension pulls water into the pore. However, the opposite is true when a pore drains (i.e., gravitational and tension forces work against each other).
Cohesion: Attraction between molecules caused by a difference in charge.
In water, the O Side carries a negative charge while the H side carries a positive charge.
Adhesion: The ability of a liquids particles to attract to different particles.
Finer grained soils tend to have higher porosities than coarse grained soils.
Water is retained more tightly in a clay soil than a sandy soil. So, the height (capillary pressure head) that the water rises in the pore is inversely proportional to the radius of the pore.
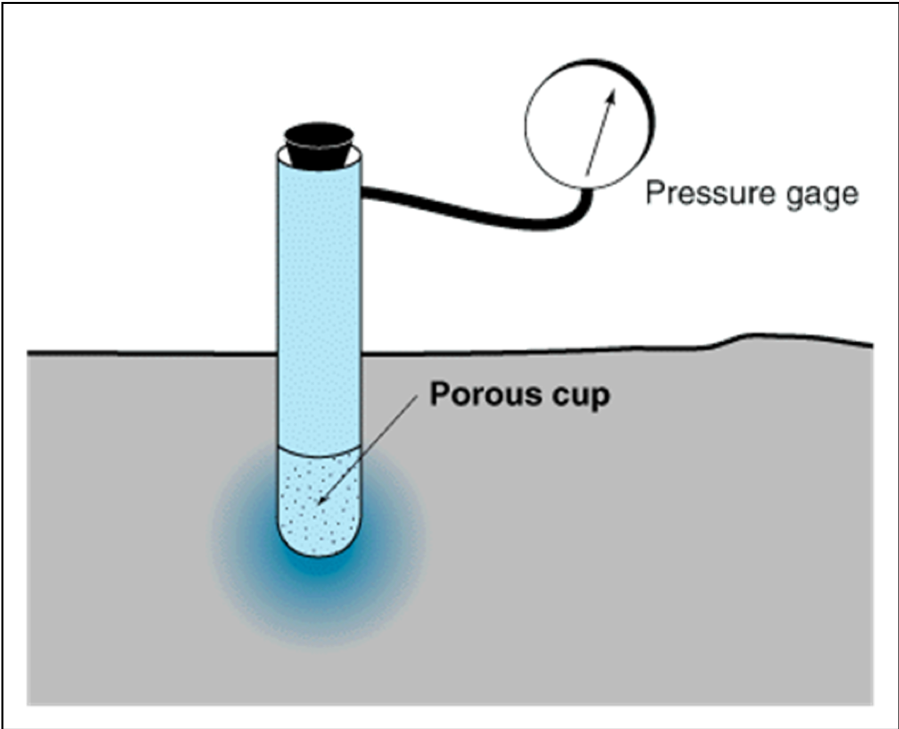
Tensionometer: Used to measure Soil Water Pressure.
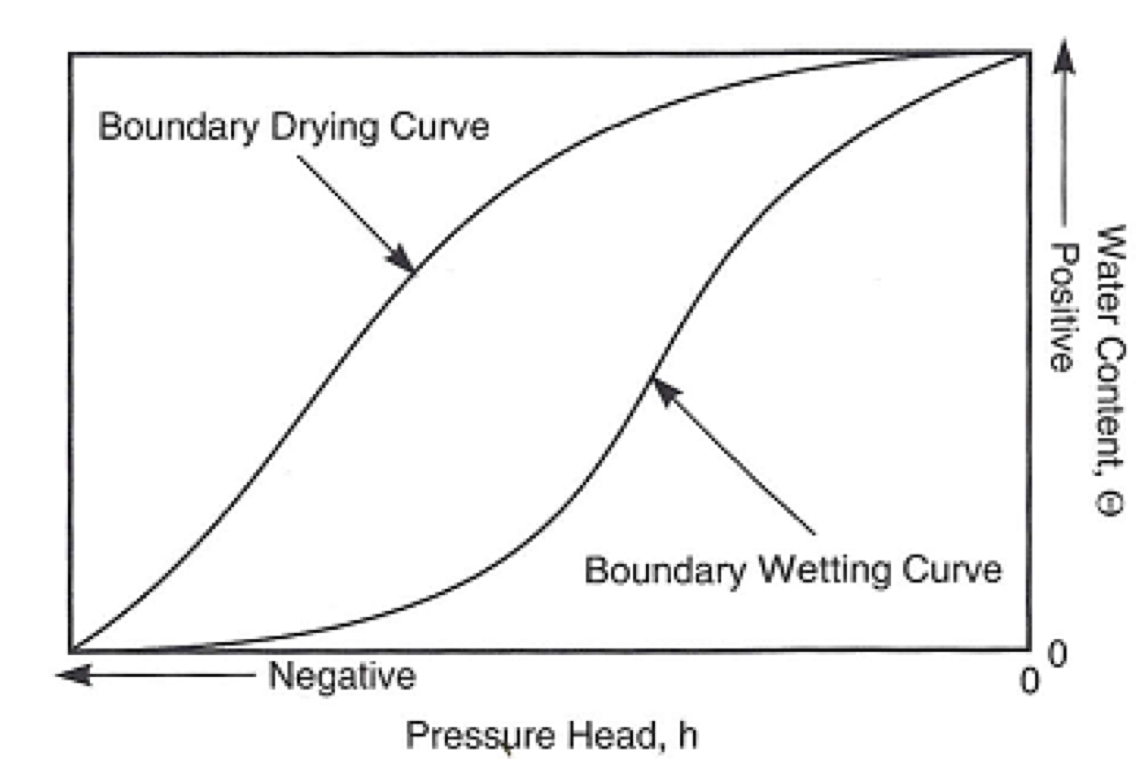
Highly non-linear relationship between pressure head (ψ) and water content (θ): |ψ(θ)|=|ψae|· (φ/θ)b
b: The pore-size distribution index. This is largely controlled by soil type.
Ψae: the point where significant volumes of air begin to appear in the soil pores.
Understanding the relationship between soil water pressure and soil water content is important for understanding the water that is available for plant uptake. In order to overcome surface tension forces that hold water in between the mineral grains, plants have to exert a suction. This is why tension is oftentimes the more relevant term to understanding the amount of water available to a plant. In general, plants cannot exert a suction stronger than 15,000 cm to extract water.
Moisture Characteristic Curve: The relationship between the pressure head and water content.
_____________________________________________________________________________
Evapotranspiration
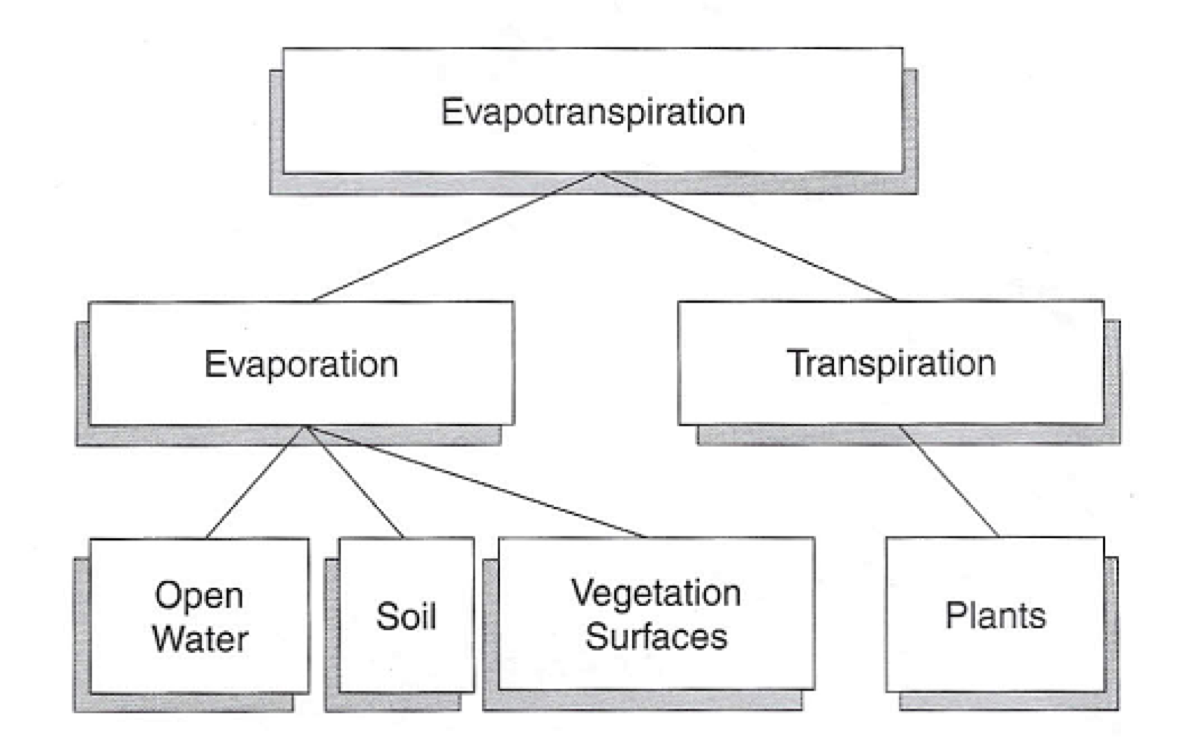
Evapotranspiration (ET): The process by which water in the liquid phase becomes a gas.
~3.4% of all water available annually was withdrawn for irrigation in the US with 60% of this amount being evapotranspired.
~62% of precipitation that falls over land is evapotranspired.
97% of ET takes place over land while the remaining 3% evaporates from open water.
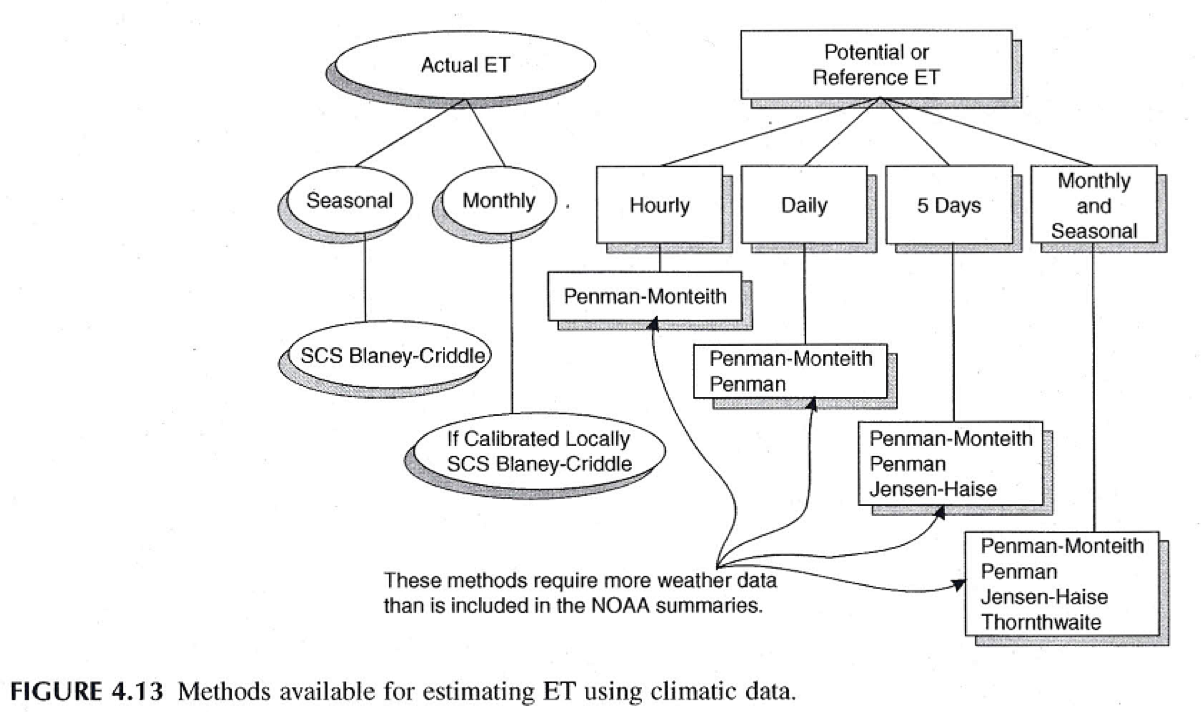
Potential Evaporation (PET): The amount of ET that would occur if water were unlimited.
Actual Evapotranspiration (AET): The actual amount of ET that occurs because water is limited.
AET and PET are most similar in areas that have a high relative humidity, and differ the most when there is low relative humidity and high temperature.
Reducing ET: Crop choice, drip irrigation, covering Soil with plastic sheeting, applying water at optimal times, applying only the required amount of water.
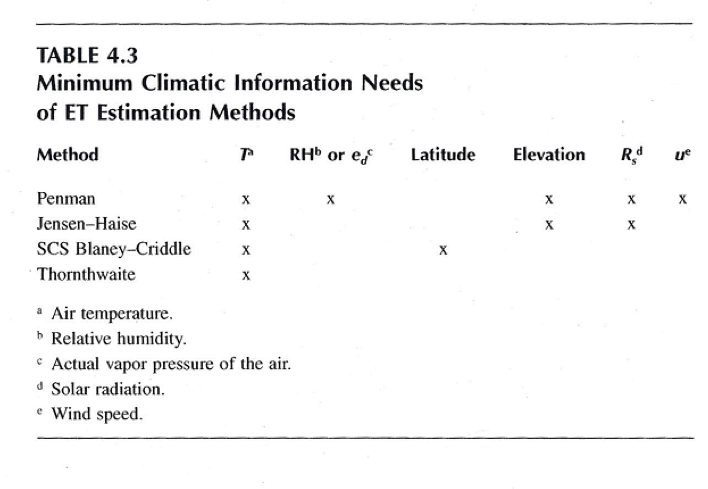
Evaporation (E): Thermal Agitation within a water molecule provides energy for it to “escape” the internal bonds of the liquid and be absorbed into the air. Evaporation requires energy to supply the latent heat of vaporization and a concentration gradient, typically provided by wind; E = Ke·va·(es-ea).
es: Vapor pressure of the evaporating surface.
ea: Vapor pressure of the evaporating air.
Va: Wind speed
Ke: A coefficient that describes the efficiency of eddies in the lower atmosphere of being able to transport water vapor.
Latent Heat of Vaporization: The energy that a molecule of water needs to penetrate the water surface.
Diffusion: Molecules move from an area of high concentration to an area of low concentration (‘Fick’s First Law’).
As the concentration of water molecules in an air space increases, the rate of diffusion decreases.
Evaporation ceases when the air has reached its saturation vapor pressure (es*) because there is no longer a concentration gradient driving diffusion.
Vapor Pressure
Water vapor is transferred between the surface and the air whenever there is a difference in the vapor pressure between the surface and the overlying air.
Saturation Vapor Pressure (es*): A function of temperature; the maximum amount of water that can be held by air.
es^∗ = 0.611∙exp((17.3∙Ts)/(Ts+237.3)); es^* is in kPa & Ts is in C.
Vapor Pressure Deficit: the difference between the saturation vapor pressure and the actual vapor pressure of the air.
Vapor pressure in the air (ea) depends on the relative humidity (Wa) & the air temp (Ta).
ea = Wa·ea*, where ea* is the saturation vapor pressure at the current air temperature.
Bare Soil Evaporation: Evaporation of water from soil; occurs in an atmosphere-controlled stage and a soil-controlled stage.
Atmosphere-Controlled Stage: Occurs at a relatively constant rate when soil water content is at or near saturation. The rate of evaporation is controlled by surface energy conditions such as wind and heat input.
Soil-Controlled Stage: Occurs once the soil surface has begun to dry. The evaporation rate during this stage is primarily controlled by soil properties such as soil texture and hydraulic conductivity. As the soil dry’s, there is a corresponding change in albedo that occurs with a decrease in soil water content.
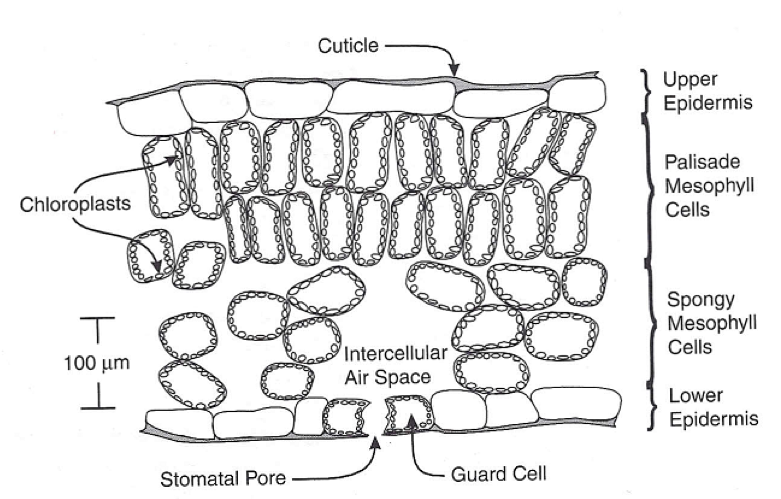
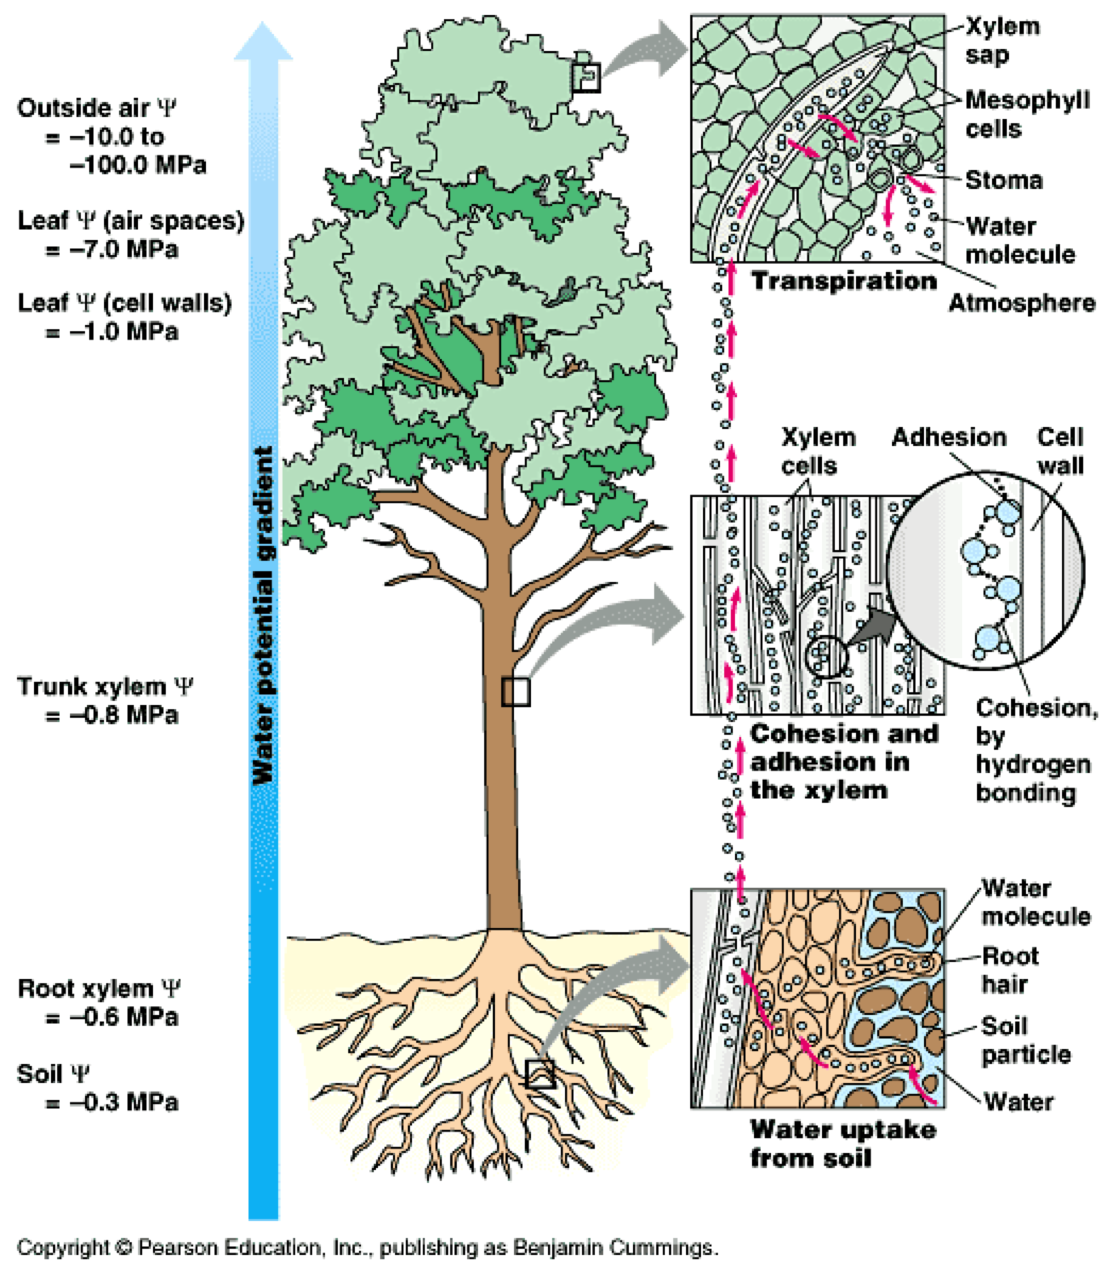
Transpiration: The process by which soil water is absorbed through the roots, transported through the vascular system of the plant to the leaves and through stomatal cavities into the atmosphere.
The air in the intercellular spaces is typically close to saturated. This gradient causes vapor to diffuse out of the stomates and into the atmosphere. The larger the vapor pressure gradient between the air in the stomatal cavities and the air at the surface of the leaf, the higher the rate of diffusion and the faster evaporation will occur.
Once water has been removed from the intercellular air space, this effectively pulls water into the plant through the roots, up the xylem and into the leaves.
In order to assimilate CO2, the plant must open its stomata; however, at the same time, the plant loses water to the atmosphere. There are many mechanisms by which plants can reduce transpiration rates including reducing the leaf area or changing leaf orientation to reduce the amount of solar energy reaching the plant.
Stomata (aka Stoma): The pore that connects the intercellular spaces with the atmosphere. Each stoma can open or close by changing the size of the guard cells at the edge of the pore. This is one way that the plant can control how much water they are transpiring. The major factors affecting the opening and closing of guard cells are light (most plants open stomata during the day and close them at night), humidity, and leaf water content (if too low, stoma close).
Open Stomata: Release of H2O to atmosphere during transpiration as CO2 is processed from the atmosphere, resulting in a loss of water but able to conduct photosynthesis.
Closed Stomata: Preserves H2O and does not process CO2 from the atmosphere, resulting in a preservation of water but unable to conduct photosynthesis.
The dehydrated tree roots send chemical signals to the stomata in the leaves via Abscisic Acid (ABA) acting as a hormone inducing the stomata to close.
Factors affecting transpiration including the plant type, root depth (can increase water access), wind (provides a concentration gradient to increase ET), and plant available water (PAW).
Plant available water (PAW): plants transpire at maximum rates when the soil is at field capacity and stop transpiring at the wilting point. However, for soil water content values greater than field capacity, roots are deprived of oxygen and transpiration can be curtailed. In general, rates of transpiration remain at levels close to field capacity down to about 50% PAW at which point transpiration begins to slow. While several different models are shown in the image above, the Pierce curve is the most commonly accepted.
Measuring ET
Evaporation Pan: Used to measure PET.
The standard in the U.S. is a class A pan, which is made out of galvanized steel, is 10 inches deep and 48 inches in diameter.
Lysimeter: Device that allow the changes in water for a given area to be measured. Considered the best measurement of ET; two basic types:
Weighing: Measure ET by weighing the entire unit with a mechanical spring while accounting for the weight of added water inputs and losses.
Non-weighing: Measure changes in ET from measurements of rainfall and water drainage out of the bottom of the lysimeter.
Eddy Covariance: If you know vertical wind speed, and water concentration at Time 1, and at Time 2, the vertical flux of water at this point in time can be calculated
The latent heat flux can be estimated as a covariance of the vertical wind velocity and the concentration of the entity of interest (i.e., water in this case). If we are interested in converting from the latent heat flux to evapotranspiration, we just need to divide the latent heat flux by the latent heat of vaporization, which is usually taken as a constant value.
Water Balance Estimation: ET = P-Q (when the system is in steady state, ie. gw and changes in soil water storage are negligible).
Energy Balance Estimation; ΔQ/Δt=Rn ± LvE ± H ± G
Rn: Net radiation; Rn = Rswdown*(1-α)+Rlwdown – Rlwup
α: Albedo; the ratio of the shortwave reflected radiation to the incident radiation.
E: Rate of evaporation (kg m-2 s-1)
Lv: Latent heat of vaporization (2.45 *106 J kg-1)
H: Sensible heat flux (W m-2)
G: Ground heat flux (W m-2)
Given the above, we can estimate ET using the energy balance approach; LE = Rn-G-H– ΔQ/Δt
Latent heat flux is equal to the latent heat of vaporization times the evaporation rate.
Thornthwaite Estimation; PET = 16*[(10∗T)/I]a
T: Mean monthly temp in C
a: Location dependent coefficient
I: Heat index, I=∑ (sub: j=1, up: 12)[Tj/5]1.514
Not applicable to semiarid to arid areas and in general, is only applicable to areas that have a climate similar to the Eastern US.
_____________________________________________________________________________
Water Contamination
As it flows over the land surface, stormwater picks up potential pollutants that may include sediment, nutrients (from lawn fertilizers), bacteria (from animal and human waste), pesticides (from lawn and garden chemicals), metals (from rooftops and roadways), and petroleum by-products (from leaking vehicles). Pollution originating over a large land area without a single point of origin and generally carried by stormwater is considered non-point pollution. In contrast, point sources of pollution originate from a single point, such as a municipal or industrial discharge pipe. Polluted stormwater runoff can be harmful to plants, animals, and people.
Water Quality: Refers to the concentration of dissolved solids and gases, suspended solids, hydrogen ions, pathogenic organisms and/or heat in a given quantity of water.
The concentration of dissolved and suspended solids can be expressed as a mass per unit volume.
In the US, water quality management efforts emphasize the Total Maximum Daily Load (TMDL) of constituents such as nutrients and dissolved oxygen.
GW Contamination
The most common mechanism by which pollutants enter gw is the downward percolation of pollutants from surface or near-surface sources, leakage from sources above the water table and via salt water intrusion.
Point Sources: Sources of contamination < a few acres (i.e., landfills, spills and injection wells).
Nonpoint Sources: Sources of contamination ranging in size from several acres to hundreds of square miles (i.e., pesticides, fertilizers, organic wastes from nutrients and septic tanks).
Surface Water Contamination
Point sources tend to be discrete pipes or canals
Nonpoint sources would include groundwater discharges to streams and diffuse flows from the land surface.
One type of surface water pollution is acidification, which arises because sulfur and nitrogen compounds produced by burning of fossil fuels in power plants, factories and automobiles are incorporated in precipitable water and deposited as dry particles.
Eutrophication: The process by which a lake accumulates high levels of essential plant nutrients, mostly P & N.
1) In highly developed areas, streams and groundwater can transport high levels of nutrients originating from various sources including fertilizers and treated/untreated sewage effluent.
2) This increase in the amount of nutrients induces accelerated growth of algae, which die seasonally and, in the process, consume dissolved O in the process of decaying.
3) In turn, the reduction in O makes a lake or estuary uninhabitable for fish and other aquatic habitats.
_____________________________________________________________________________
Flood
Flood: Occurs when a drainage basin experiences an unusually intense or prolonged water-input event and the resulting streamflow rate exceeds the channel capacity.
Floodplain Management: Any action intended to reduce future flood damages. The economic benefits attributable to a proposed floodplain management plan are equal to the difference between flood damages with the plan and those without the plan
Flood-Control Dams: Reduce peak flood discharge associated with a given exceedance probability at locations downstream from the dam.
Dikes and Levees: Maintain a zero level of flooding in the area behind them until they are overtopped.
Channelization: Stream channel can accommodate larger discharges.
Flood Proofing: Construction of buildings that can accommodate flooding with minimal damage.
Removal of structures from floodplain
Flood Warning: Can give people time to remove or find temporary protection for property.
Floodplain Zoning: Limits future developments on floodplains.
Unit Hydrograph: Generally used for large watersheds (A > 100 sqkm) to estimate flood peaks that are within 25% of their true value. This method assumes a uniform distribution of excess rainfall over the watershed, a uniform rainfall excess rate, that the runoff rate is proportional to the runoff volume for a rainfall excess of a given duration. Hydrograph Characteristics:
Top Right Quadrant: A relationship between flood magnitude and exceedance probability that is based on existing data, similar to the FDC.
Upper Left Quadrant: Relates flood depth to flood discharge; the magnitude of flood damages depends largely on the depth of flooding.
Lower Left Quadrant: Relates flooding depth to damages for that particular floodplain. This relationship is often based on field or aerial photographic surveys of the types and locations of the existing buildings.
Lower Right Quadrant: Relates damages to exceedance frequency and is developed based on the relationships established in the three other quadrants. Average annual damages can be calculated by determining the area under the curve of the lower right quadrant.
Most commonly, the time series that you would use for the analysis is constructed from annual series by selecting the highest instantaneous peak flow in each year of record.
_____________________________________________________________________________
Drought
Drought: A dry period with a duration of at least a few months that is a significant departure from the norm.
Drought Analysis
What type of drought is of interest?
Meteorological- precipitation.
Agricultural- PDSI or soil moisture.
Hydrological- streamflow, groundwater levels.
What averaging period will be used?
Generally greater than 1 month, could be 3 months, 1 year.
How will drought be quantitatively defined?
What is the cutoff value for a variable (e.g., precipitation, PDSI, streamflow, groundwater level) measured over a certain period that constitutes a drought?
Could use mean, median or mean minus one standard deviation
Once the cutoff is defined, you can further define drought by its duration, severity (deviation from cutoff value) or intensity (severity/duration).
What are the magnitude-frequency relations of drought characteristics
How are regional aspects of drought addressed?
Measuring Drought
Palmer drought severity index (PDSI): Commonly used measure of agricultural drought. Uses precipitation and temperature data to compute the water balance for a climactic region on a monthly basis. The values range from -6 (extreme drought) to +6 (extreme wetness).
_____________________________________________________________________________
Water Resource Management
Water-Resource Management: The process by which governments, businesses, and/or individuals reach and implement decisions intended to affect the future availability and/or quality of water
Water Supply: The maximum sustainable rate at which water can be withdrawn from existing sources without causing undesirable ecological, human health, economic, legal or other consequences.
Safe yield: The rate at which gw can be withdrawn without producing undesirable effects, some of which include: reductions in streamflow, reductions in levels of lakes/wetlands, land subsidence and increased costs of pumping.
A more realistic expression of available water is the flow rate exceeded ‘most of the time’, which is the flow rate exceeded 95% of the time (i.e., q.95). You can use this as the safe yield.
The definition of water supply is identical to the definition of safe yield, which is often used to specify a rate of water utilization that can be maintained more or less indefinitely and relied upon as a measure of the available water resources of a region or a specific water source.
Water Supply Shortages
Demand: The rate at which water would be used at a given place for a given price.
Use: The rate at which water is applied to one or more purposes.
Shortage: Water use < water demand.
Resource Shortage: Demand > Safe yield; remediated by increasing supply or reducing demand through price increases.
Drought Shortage: The current availability of water is less than the safe yield due to drought.
Infrastructure Shortage: Sustainable supply is greater than or equal to demand, but the infrastructure capacity is less than the demand.
Current & Projected Water Usage: Wd(t) = ud(t)*N(t)
Wd: Water-use projection.
N(t): The projected population
ud (t): The projected per capita use.
In the US, uD (1995) =247 m3 person-1 y-1
_____________________________________________________________________________
Resources
Hydrology, Hydraulics Calculators: http://www.sd-w.com/civil/mannings_formula.html
Pollution Sources (N, P): https://fwrinformationcentre.co.uk/html/sources-of-pollution---diffuse-pollution.html
_____________________________________________________________________________
Chronology
1909: Philadelphia opens the Torresdale Water Treatment Plant (now the Baxter Plant) on the DE River (JHU Hydrology, 2019).
1904: Philadelphia constructs the Belmont Water Plant on the Schuylkill River which uses slow sand filtration and sedimentation to remove solids from the river water, resulting in a 75% reduction in typhoid deaths (JHU Hydrology, 2019).
1902: The USG passes the Federal Reclamation Act and begins building big dams in the US West (ILH, unk).
1864: George Perkins Marsh publishes “Man and Nature”, arguing that cutting forests could lead to diminished water flows: "The operation of causes set in action by man has brought the face of the earth to a desolation almost as complete as that of the moon (JHU Hydrology, 2019).
1815: Philadelphia builds the Fairmount Water Works, its first drinking-water treatment plant, which moves untreated water from the Schuylkill River to the city reservoirs (JHU Hydrology, 2019).
Jun, 1793: fleeing a revolution on the island of Santo Domingo, they brought with them some tropical mosquitoes, and soon the city was in the grips of a devastating yellow fever epidemic that killed 10 percent of the population (JHU Hydrology, 2019).
1572: Machhu Picchu is abandoned (Wright, unk).
1450-1540: Machhu Picchu is used as a mountain top royal retreat of Incan ruler Pachakuti (Wright, unk).
1450: Decline of the Hohokam culture, possibly due to a combination of factors including flooding, hydrologic degradation, population (Water Encyclopedia, unk).
1275-1300: A major drought strikes the Anasazi at Mesa Verde, causing them to abandon their cliff houses by 1300 (Wright, unk).
1259: Significant volcanic activity likely chills the atmosphere and shortens growing seasons (Wright, unk).
1135-1180: A major drought strikes the central and SW USA impacting the Anasazi at Mesa Verde and leading to the decline of Chaco Canyon development in modern NM (Wright, unk).
550-1300: The Anasazi live at Mesa Verde (Wright, unk).
714 BCE: Assyrian King Sargon II invades Armenia and discovers the qanat- water tunnels used to bring water from underground sources to the foothills. Sargon destroys the qanat in the area but bring the concept back to Assyria. Qanat irrigation spreads over the Near East and into N. Africa (Water Encyclopedia, unk).
1700 BCE: Wheat is no longer able to grow in the Fertile Crescent as salt soil levels are too high (USGS, unk).
~2500 BCE: An 80/20 split of salt tolerant barley and less tolerant wheat is grow in the fertile crescent as salt accumulates in fertile crescent agricultural fields (USGS, unk).
~3500 BCE: A 50/50 split of Barley and Wheat is grown in the Fertile Crescent (USGS, unk).
> 6 Ka: The Fertile Crescent is first irrigated, providing the foundation upon which civilizations are built. However, canals do not sufficiently drain excess water, thus salts accumulate in water and soils (USGS, unk).

_____________________________________________________________________________
---Articles---
_____________________________________________________________________________
Hydrology and Paleohydrology of Ancient Machhu Picchu by Wright
Ref: Wright (unk). Hydrology and Paleohydrology of Ancient Machu Picchu.
Purpose: Study of the ancient Inca Water supply of Machu Picchu (2438m).
Primary Spring: Water supply of ~25-125 l/min (supporting 1000 pax) created by the Machu Picchu Fault.
A 749m long canal delivered spring flow to the community center to serve 16 water supply fountains.
Urubamba River during dry months to walk it up 450m!
Spring used for drinking, rainfall for irrigation.
_____________________________________________________________________________
Ancient Irrigation Systems by Water Encyclopedia
Ref: Water Encyclopedia (unk). Irrigation Systems.
Mesopotamia: “The land between the rivers (Tigris and Euphrates)” (Greek).
Flooding problems were more serious in Mesopotamia than in Egypt because the Tigris and Euphrates carried several times more silt per unit volume of water than the Nile. This resulted in rivers rising faster and changing their courses more often in Mesopotamia.
Over the centuries, the agriculture of Mesopotamia began to decay because of the salt in the alluvial soil. Then, in 1258, the Mongols conquered Mesopotamia and destroyed the irrigation systems.
Assyrians also developed extensive public works. Sargon II, invading Armenia in 714 B.C.E. , discovered the qanat (Arabic name) or kariz (Persian name), which is a tunnel used to bring water from an underground source in the hills down to the foothills. Sargon destroyed the area in Armenia but brought the concept back to Assyria. This method of irrigation spread over the Near East into North Africa over the centuries and is still used.
Around 1450 C.E., the Hohokam culture declined, possibly because of a combination of factors: flooding in the 1080s, hydrologic degradation in the early 1100s, and the recruitment of labor by the surrounding population. A major flood in 1358 ultimately destroyed the canal networks, resulting in movement of the people.
_____________________________________________________________________________
Where Do the Salts Go? By USGS
Ref: USGS (unk). Where do the Salts Go? From: https://pubs.usgs.gov/fs/fs-170-98/
To prevent the accumulation of salts in the root zone, the quantity of water applied must be sufficient to flush the salts beyond the root zone as well as meet the plant requirements.
The flood plain of the Tigris and Euphrates Rivers, known as the “Fertile Crescent” in ancient Mesopotamia (present-day Iraq) , was first irrigated > 6 Ka. The resulting agricultural surplus provided the foundation upon which the civilization was built; however, canals built in 4000 B.C. did not sufficiently drain excess water from the agricultural areas, and salts accumulated in water and soils. Progressive waterlogging and salinization were evident from the historical succession of crops—a 50/50 split of wheat and barley was grown in about 3500 B.C.; by 2500 B.C., the more salt-tolerant barley represented 80 percent of the crop, and finally by 1700 B.C., wheat could not be grown because of the salts that had accumulated in the ground water and soil. Centuries of irrigating poorly drained soil with highly mineralized water in an arid climate left a thick crust of salt on the land surface and soil hardened by salt deposits.
Water with a dissolved-solids concentration of less than 500 mg/L—about a quarter of a teaspoon of salts per gallon of water- is generally suitable for most uses.
Salts that constitute a major part of the dissolved-solids concentration in waters of south-central Arizona are Ca, Mg, Na, SO3, Cl-, and bicarbonate. Concentrations of nitrate, fluoride, and trace metals such as arsenic or selenium are particularly significant because they affect the suitability of water for certain purposes.
Salt load can be reduced through improved irrigation practices or modifications in cropping practices that reduce deep-percolation losses (Ayars and other, 1997). Improved irrigation practices might include reducing pre-planting irrigation, using different irrigation technologies such as drip systems that deliver water directly to each plant, and using shallow ground-water management techniques such as tile drains to collect the salty water where ground-water levels are high.
_____________________________________________________________________________
Sanitation in Ancient Rome (Wiki)
It is commonly believed the Romans used sea sponges on a stick and dipped in vinegar after defecation (for anal hygiene).
_____________________________________________________________________________
Ancient Water Technologies in North America by Iwmays
Ref: Iwmays (18 Apr, 2015). Ancient Water Technologies in North America. From: https://ancientwatertechnologies.com/2015/04/18/ancient-water-technologies-in-north-america/
Around 900 C.E., the Anasazi of northwestern New Mexico developed a cultural phenomenon that now has more than 2,400 archaeological sites with nine towns each with hundreds of rooms along a 5.6-kilometer (9-mile) stretch.
_____________________________________________________________________________
Ancestral Puebloan Water Handling by Wright
Ref: Kenneth Wright (unk). Ancestral Puebloan Water Handling. Southwestern Lakes.
Anasazi, reconciled their lifestyle to the semi-arid and changeable climate. These dryland farmers who lived at Mesa Verde from about AD 550 to about AD 1300.
One of the worst drought periods at Mesa Verde within the dendroclimatic record started in AD 1135 and ran to AD 1180. Then, in AD 1275, another major drought struck that lasted until AD 1300.
Southwestern United States experienced its own “Little Ice Age” beginning around AD 1200 until about 1850 (Peterson 1988). Average temperatures of 2–4° F cooler are thought to have caused shorter growing seasons and less successful crops at Mesa Verde.
_____________________________________________________________________________
Using Water: Irrigation by ILH
Ref: I love History (unk). Using Water: Irrigation. From: http://ilovehistory.utah.gov/topics/water/irrigation.html
Jul, 1847: Mormon settlers in Utah dam city Creek, so the overflowing waters would soften the soil for potato planting.
_____________________________________________________________________________
The Vision of John Wesley Powell by NPR
Ref: NPR (unk). The Vision of John Wesley Powell. From: https://legacy.npr.org/programs/atc/features/2003/aug/water/part1.html
1878: John Wesley Powell publishes his Report on the Lands of the Arid Region, which lays out a concrete strategy for settling the West without fighting over scarce water. Powell wanted to stall the waves of homesteaders moving across the plains and mountains and organize settlements around water and watersheds, which would force water users to conserve the scarce resource, because overuse or pollution would hurt everyone in the watershed.
"For Powell, the water would not be taken out of the watershed or out of the basin and transferred across mountains … hundreds of miles away to allow urban growth to take place. So L.A., if it existed at all, would have been a much, much smaller entity. Salt Lake City would be smaller. Phoenix would probably not even exist."
1880s: Powell is named 2nd Director of the USGS. He organizes programs to gather information and begins the systematic topographic mapping of the USA.
_____________________________________________________________________________