Sustainability Science by de Vries
Ref: Bert de Vries (2012). Sustainability Science. Cambridge University Press.
____________________________________________________________________
Summary
‘A new field of sustainability science is emerging that seeks to understand the fundamental character of interactions between nature and society…. [it] needs to move forward along three pathways. First, there should be wide discussion within the scientific community regarding key questions, appropriate methodologies, and institutional needs…Second, science must be connected to the political agenda for sustainable development…. [and] third (and most important), research itself must be focused on the character of nature-society interactions, on our ability to guide those interactions along sustainable trajectories, and on ways of promoting the social learning that will be necessary to navigate the transition to sustainability’
Sustainability Sciences: The flux of ideas, concepts and observations, from various fields of science that seek to understand the dynamics of evolving, coupled social-ecological systems (SES).
‘The concept of the earth as a “spaceship” has provided many people with an awareness of the finite resources and the complex natural relationships on which man depends for his survival (SCEP, 1970).
____________________________________________________________________
Ch 1: Introduction
Sustainable: An act, process or situation, which is capable of being upheld, continued, maintained or defended.
A measure or indicator of sustainability is the difference between the actual and the desired situation and the timepath towards it.
Economists argue that the quest for sustainable development can and should be founded on welfare economics and societal cost-benefit analyses.
Sustainable Development: Development that meets the needs of the present generation without compromising the ability of future generations to meet their own needs (WCED, 1987).
Three rules of Sustainability: 1) ‘Its rate of use of renewable resources do not exceed their rates of regeneration; 2) its rates of use of nonrenewable resources do not exceed the rate at which sustainable renewable substitutes are developed; and 3) its rates of pollution emission do not exceed the assimilative capacity of the environment’ (Meadows et al. (1991) 209).
____________________________________________________________________
Ch 2: The System Dynamics Perspective
System: An interconnected set of elements that is coherently organized around some purpose. Systems have three key attributes: elements, (inter)connections, and purpose. Key notions in system dynamics are stocks, flows, feedbacks, delays, inertia and causal loop diagrams (CLDs).
Elementary Modes of System Behavior: Exponential growth (positive feedback) and exponential decline/growth towards an attractor (negative feedback);
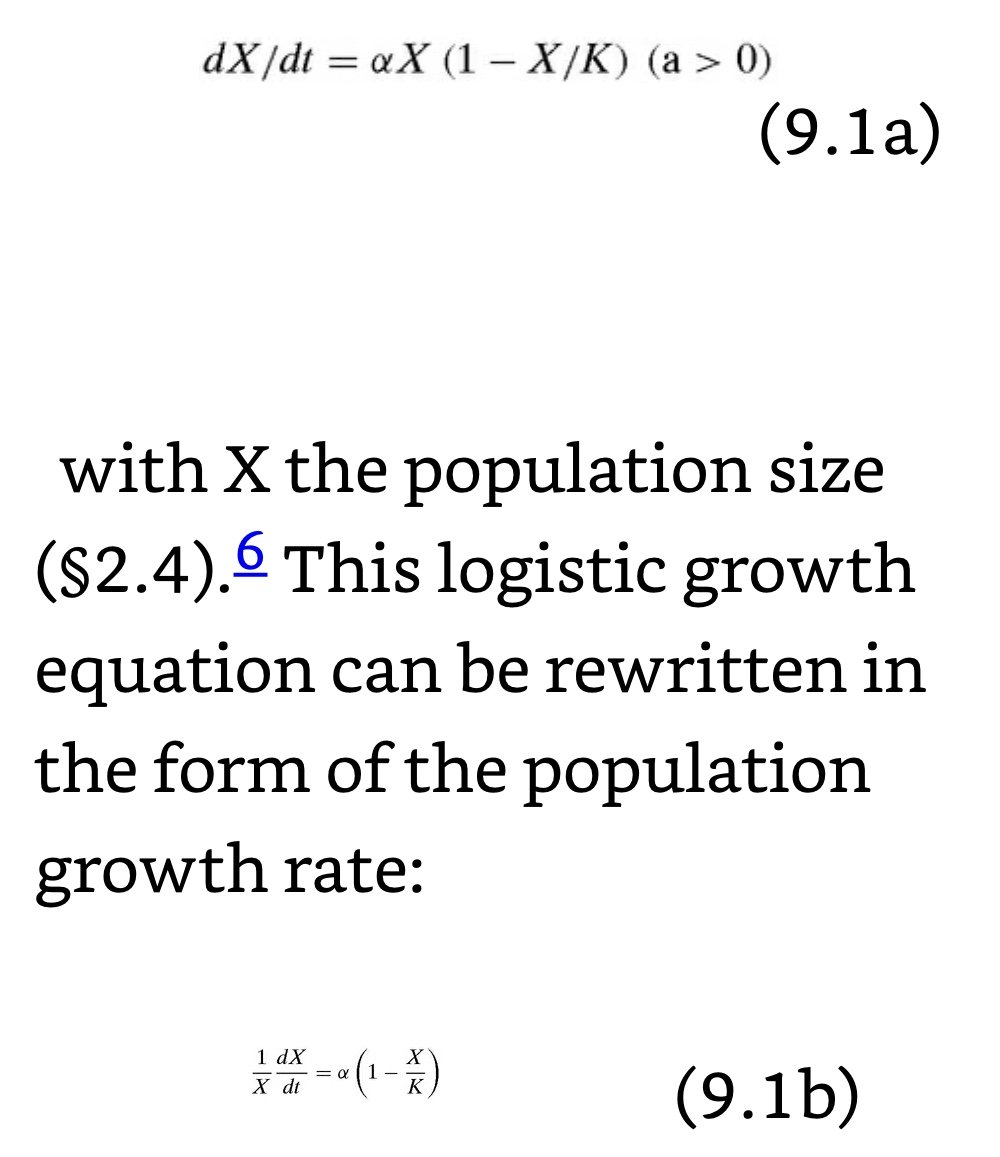
Real-world systems consist of interacting positive and negative feedback loops, with the logistic growth as one simple but frequently used model.
The logistic growth phenomenon represents the essence of this archetype. In a context of business or political competition, the Limits to growth archetype can manifest itself as a brake on successful operation. A way to avoid it is to anticipate the possible consequences of the rapid growth and respond before the limitations start operating – a recipe for sustainable development.
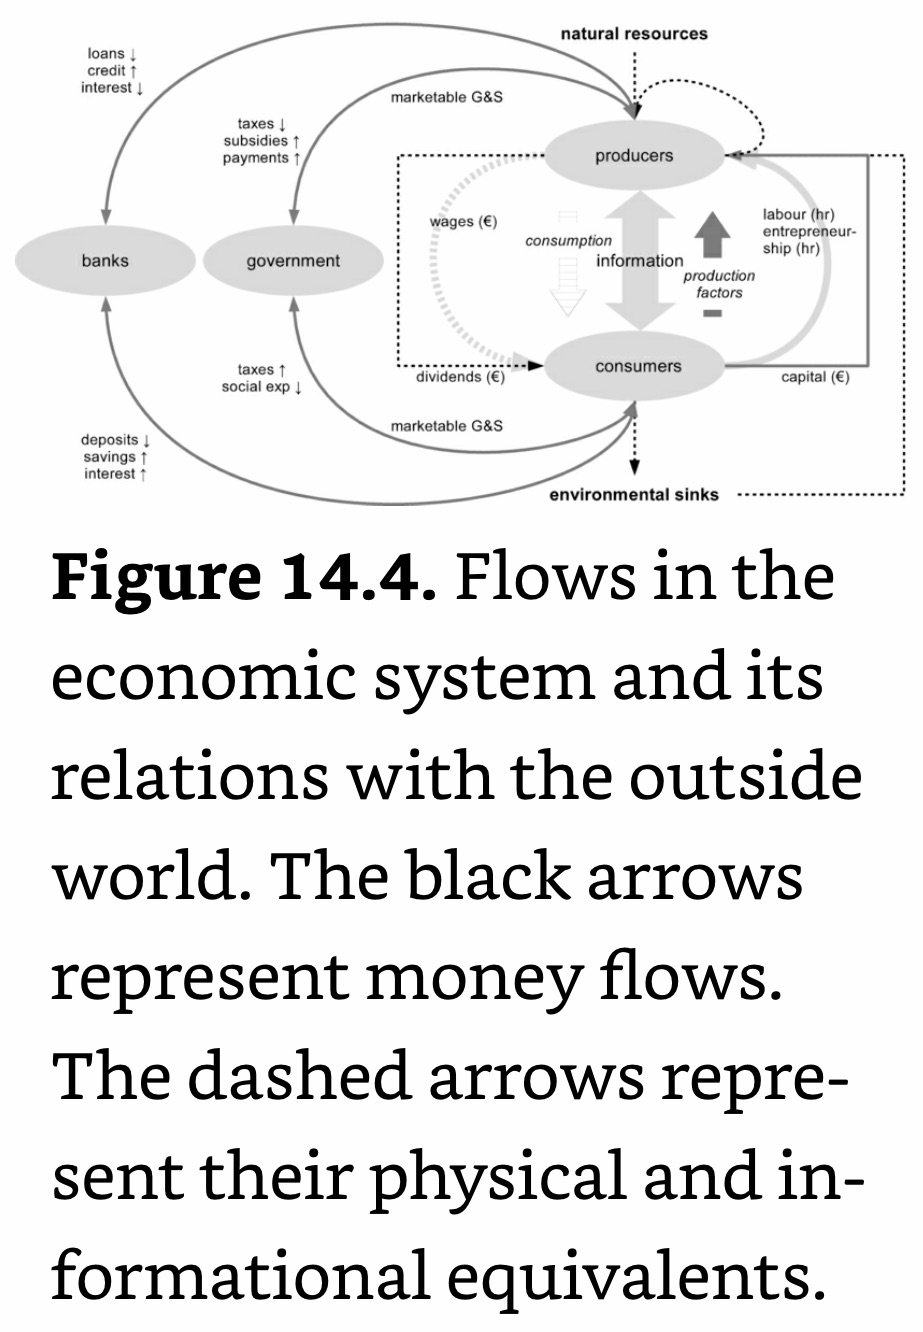
Interconnections (Relationships): The physical, monetary and informational flows, as well as the laws and rules that govern these flows.
Most real-world systems exhibit nonlinearities, delays and feedbacks.
Transition: A dynamic process in which a system changes from one relatively stable equilibrium to another.
Vulnerability: A combination of exposures, sensitivities and adaptive capacities in a social-ecological system.
Stocks and Flows
The spatial and temporal scale have to be consistent across the definition of a stock and its associated flows. If physical interactions in space are considered, stocks are usually defined as densities (individuals per unit area). The stock of cars, for example, has to be linked to the surface area (hA) where they are parked or drive around if the objective is to make sense of the traffic system.
Stocks (Levels): The content of reservoirs or compartments in which something is stored. They are the equivalents of integrals in calculus and usually indicated as state variables in system theory. They represent accumulated ‘stuff’ (things, individuals, matter, etc.) within a given system boundary. I.e., water in an underground aquifer, metal in a mineral deposit, phosphates in a lake, C in the atmosphere, biomass in a forest, and so on.
In ecological and environmental science, the stocks are those parts of natural ecosystems that provide services for human use, such as fertile soils, animal populations, forest biomass or forested area and aquifers (source function). They can also be air, water and soil compartments for disposal (sink function). In agriculture, relevant stocks are grain stores and livestock. In engineering and economic science, the stocks refer to the goods in an inventory or, more broadly, the capital stocks in the form of machinery and other productive facilities. In finance, it refers to a sum of money or a fund, which tends to become the most widely known meaning since the advent of stock markets.
The level of a stock is determined by an inflow and outflow- one cannot change their level directly.
To do model simulations, stocks identified in an influence or causal loop diagram must be quantified and, therefore, be assigned a unit of measurement. Cars are counted in numbers and roads and railways in km length. Elephants in a natural park can, as a stock, be measured in number of individuals or in biomass-weight, depending on the purpose of the study.
Flows (Rates, Fluxes): Changes in a stock; their equivalent in calculus are derivatives.
Feedback Loops
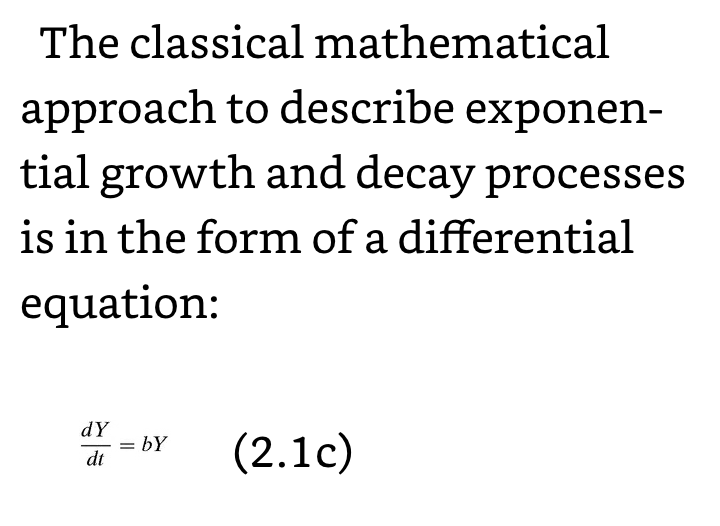
Positive Feedback Loop (PFL): Occurs when a feedback loop enhances or amplifies change; this tends to move a system away from its equilibrium state and make it more unstable (SERC.Calreton.edu). A PFL causes a (stock) variable to grow exponentially, but at some point counteracting forces start to operate and slow down the positive feedback.
Negative (Stabilizing, Balancing) Feedback Loop (NFL): Occurs when a system’s output acts to reduce or dampen the processes that lead to the output of that system, resulting in less output. NFL’s allow systems to self-stabilize (Lumen).
An example of such a decline process is radioactive decay.
A simple but characteristic dynamic process, in which both a PFL and an NFL operate, is the logistic growth process. In system dynamic terms, the outflow rate is a function of Y and approaches the inflow rate for Y approaching K. This process can be formulated as the differential equation for exponential growth with the growth rate b* approaching zero for Y.
Tipping Point: A key feature of nonlinear reinforcing loops.
Studying a System
Develop a clear statement of the problem to be addressed, that is, of the purpose of the model, and choose the time horizon of interest; make qualitative and quantitative descriptions of the system's behavior in the past, and hoped-for or feared behavior in the future.
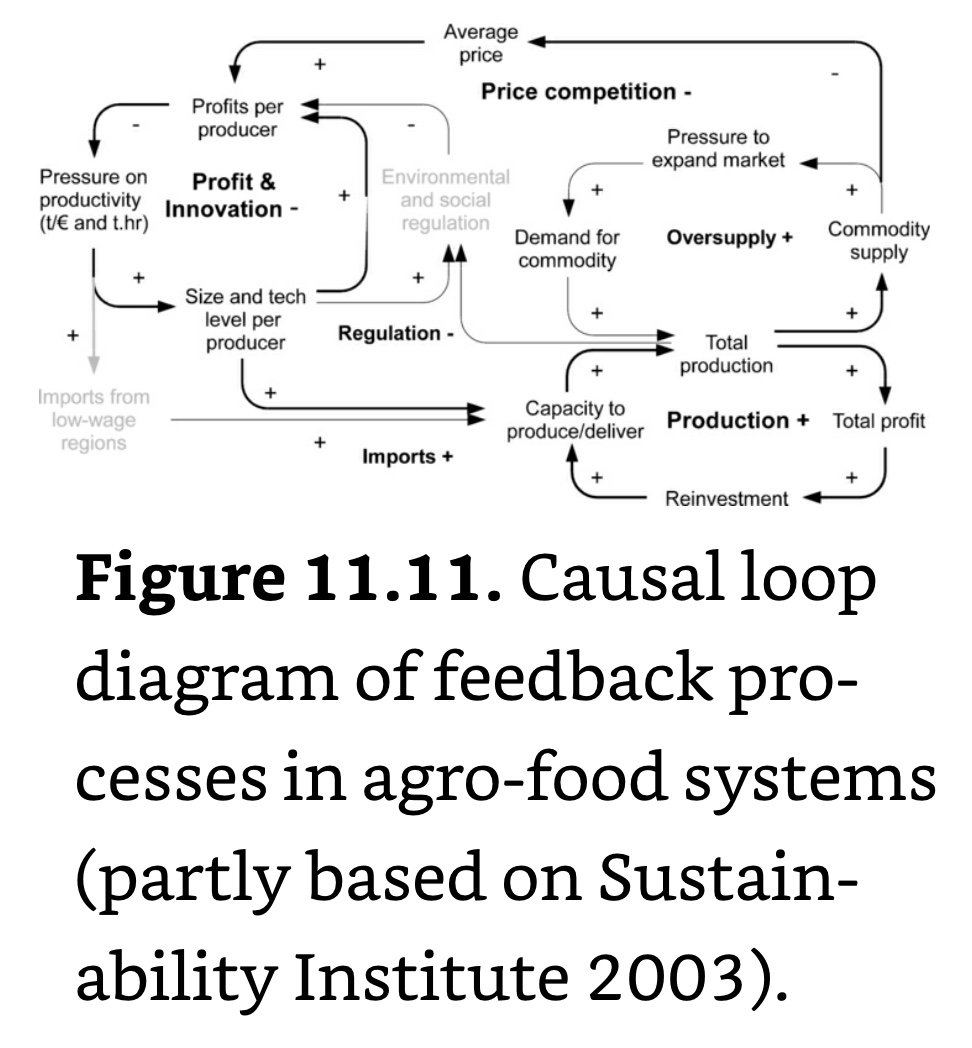
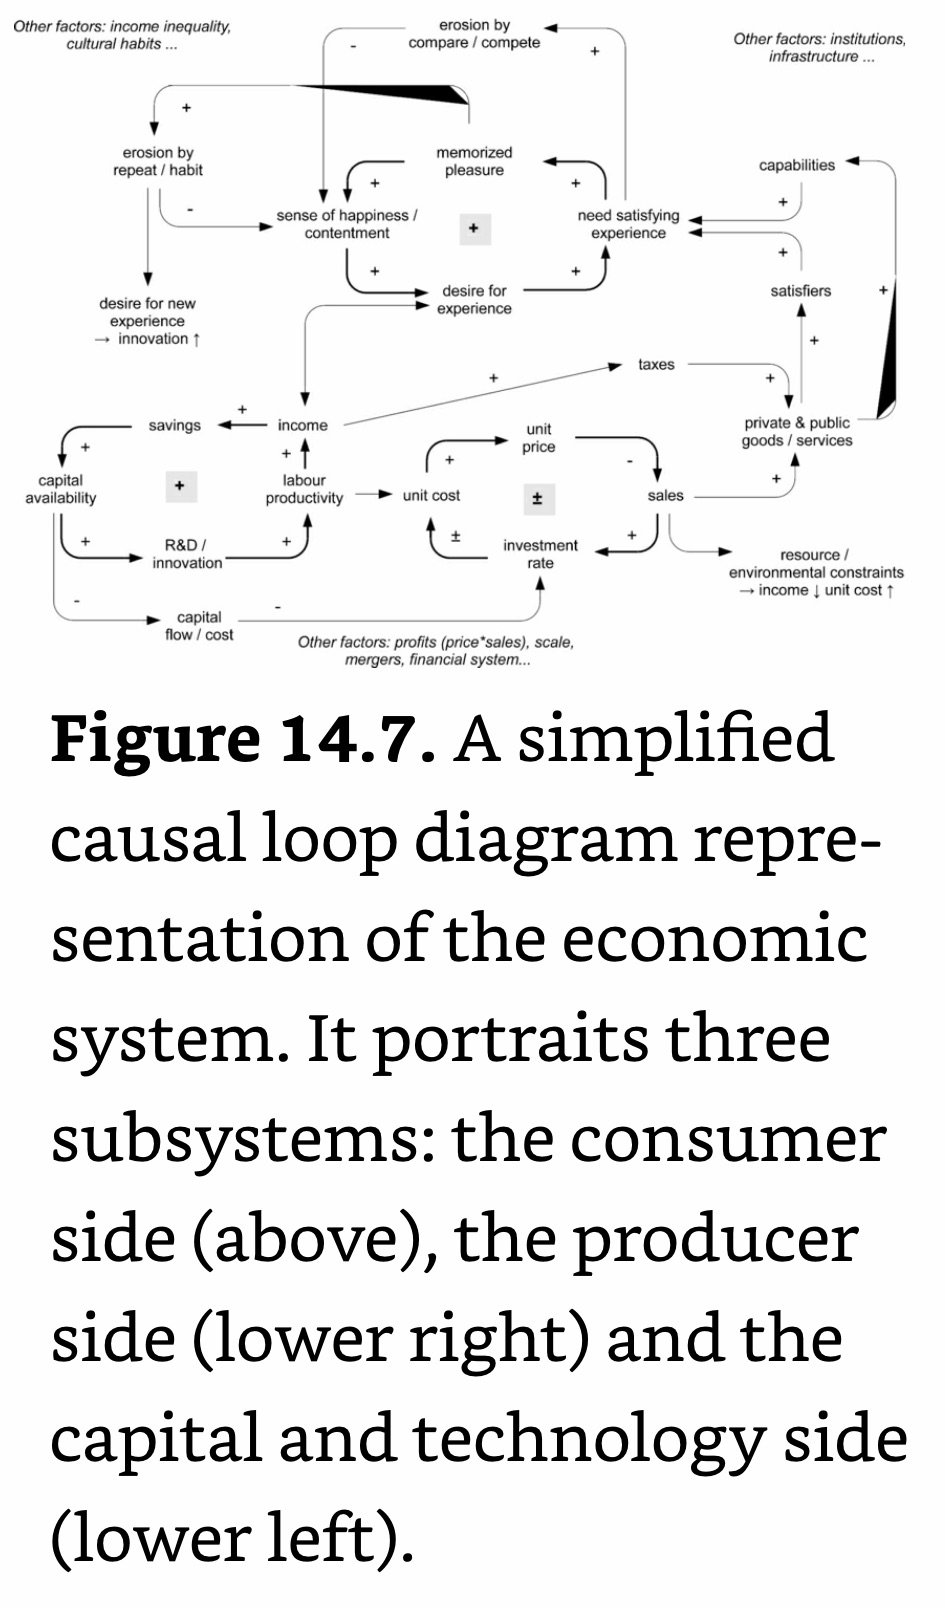
Causal Loop Diagram (CLD): A hypotheses about the dynamics driving a system's behavior and expressed as an influence diagram.
Identify stock variables, that is, the relevant inflows and outflows and those variables that change as a consequence of these flows (or fluxes). The value of a stock variable is referred to as its level and of a flow as its rate of change.
A connection between two variables (stocks, flows) is indicated with a + sign if a positive (negative) change in variable A causes a positive (negative) change in variable B.
If the reverse happens: a positive (negative) change in variable A causes a negative (positive) change in variable B, we use a – sign. If a loop has only + signs, it is always a positive (reinforcing) feedback loop. If there are an uneven number of – signs, it is a negative (stabilizing) feedback loop.
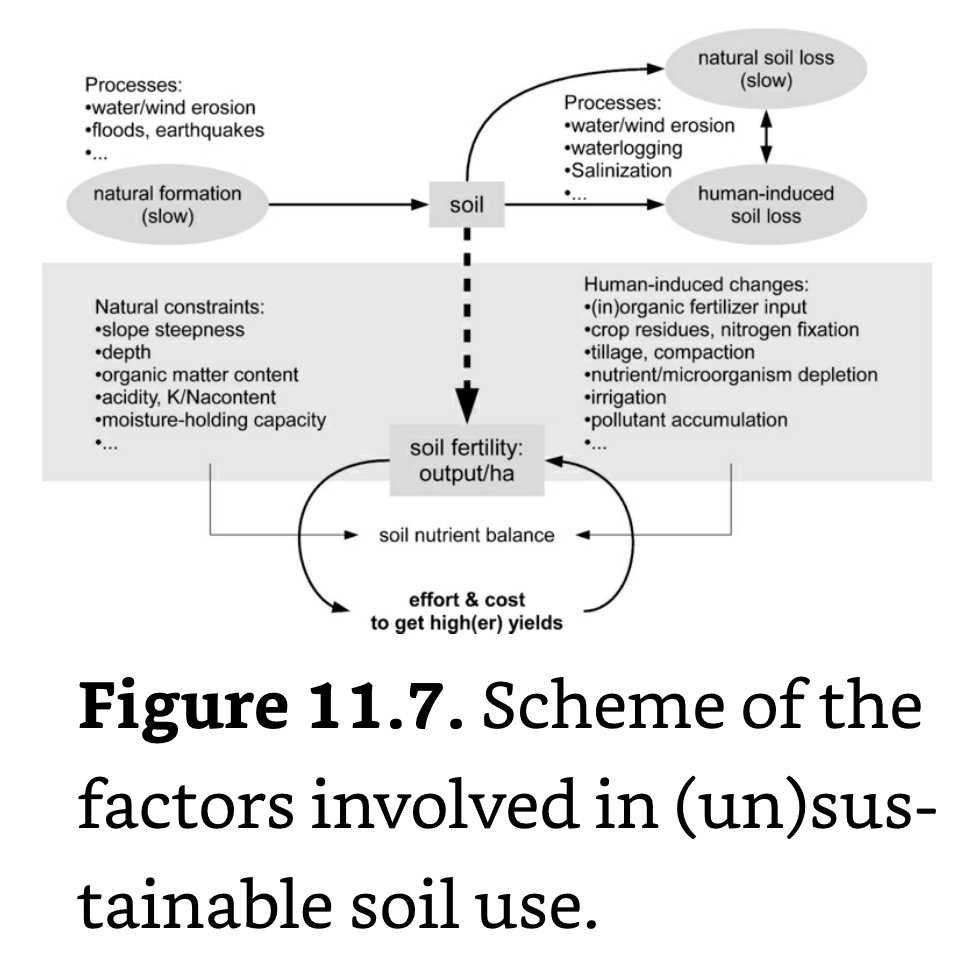
A key question in sustainable resource use is whether resource productivity declines and, if so, how it can be increased or at least maintained and at which effort/cost.
Phenomenological Law: A correlation that connects two observable quantities in ways that are not understood at the level of the underlying system dynamics.
Causal Chain: A way of representing a hypothesized sequence of causally linked events.
Correlation Coefficient: The measure of the strength of the relationship between two variables.
____________________________________________________________________
Ch 3: In Search of Sustainability: Past Civilizations
12 Ka: Agriculture originates in the so-called Levantine Corridor, near the Jordan valley lakes, in the form of the domestication of cereals and pulses.
Hunting and foraging had originally a higher labour productivity (food provision per day) than growing crops, but that it started to decline due to population growth and a subsequent increase in competition for food and depletion of the food resource (game, vegetation) (Weisdorf, 2005).
The positive link between net population growth rate and harvest rate causes a ‘feast and famine’ pattern of population overshoot and endogenous resource degradation and has become a widely used metaphor for unsustainable development.
State: The most complex organizational form by which human groups resolve the perennial tension between the individual and the group, between competition and cooperation.
The lesson (from the fall of empires) is that resilience of social structures is determined by their capacity to innovate in response to the changes in circumstances that they themselves generate.
Sociologist Elias distinguishes in his book The Civilizing Process three dangers threatening human groups: 1) the extra-human world: droughts and floods, wild beasts and pests, earthquakes and volcanic eruptions; 2) inter-human relationships: hostile neighbors, invading warriors; and 3) intra-human nature: mismanagement due to negligence, ignorance, lack of self-restraint or discipline. Initially, the first of these dangers was dominant and the basic options were to adapt or migrate.
Human populations tended to grow towards the maximum number (‘carrying capacity’) that could be sustained by the regional resource base; this occurred at a rate different from the degradation rate of the environment, and could, therefore, usually not be stopped at the moment people became aware of the consequences; when the resource base got overexploited as a result, the struggle for the stagnant or declining (food) surplus intensified;
The resulting tensions could turn outward, in the form of outmigration and conquest, or inward, in the form of oppression and sacrificial rituals or technical and social innovations and changing environmental practices; and the capability, or lack of it, of the elite to understand, anticipate and act for the good of the larger system became a more important or even dominant factor in whether a civilization could sustain itself.
The positive loop was manifested in growing size and density of human populations and in productivity increases as a function of accumulated experience and its manifestation in technical artefacts. A reverse, negative loop set in when certain thresholds in the use of environmental resources were exceeded and the resource base got degraded as a consequence.
Ornithologist Jared Diamond lists human-induced environmental change, climatic change, external enemies, external friends causing dependence, and endogenous cultural dynamics as the main determinants of decline.
A large and stable food surplus, and an adequate means and infrastructure for distributing it, were a precondition for the rise of urban settlements.
The number of people grows exponentially and food availability does not, so people inevitably run against food limits (Malthus, 1798).
The collapse of civilizations can be categorized into three groups: 1) resource- and environment-related changes, fully exogenous or partly endogenous, in the sense of human-induced; 2) interaction-related changes in the form of conquest or other, less dramatic forms of invasion; and 3) internal changes in socio-political, cultural, and religious organization and world-view, diminishing the adequacy of response to external events (Tainer, 1988).
The decline/collapse of several past civilizations can be assigned to overexploitation of the resource base in an environmentally fragile environment with (large) natural variability. With development, the spectrum of environmental risks widened from nearby and short-term to indirect and long-term – another element in the dependency-control spiral.
____________________________________________________________________
Ch 4: The World in the Past 300 Years
Demographic transition. The first stage occurred in the 19c when a spectacular decrease in the mortality rate happened in several European countries. It has led to a phenomenal rise in life expectancy at birth, from less than 40y in 1820 to more than 76y by 1990. It was the consequence of ongoing improvements in food quantity and quality and of better sanitation, hygiene, medicine and medical practice. In the second stage, the birth rate started to decline but the delay with the mortality rate decline caused a period of rapid population growth. In the third stage, where most industrialized nations are now, population sizes stabilize or even decline. The transition can be mathematically described with a logistic growth curve.
Structural Change: The gradual shift in sectoral shares in GDP and employment from agriculture to manufacturing and then to services.
Cultural and political developments are visible in a society's institutions. In the course of evolution, human beings have learned to organize themselves in groups to get the benefits of cooperation (Wright 2000). Past and present institutions, foremost the nation-state but also armies, churches, ministries, corporations, sport clubs and so on, evolved out of the early tribal groups in order to benefit from cooperation and coordination and restrain behavior that is harmful for the group. They are cornerstones of societal as well as their own stability and continuity, in their role of repositories of learning and customs and of conflict mediators. They have proven to be the most durable structures in the human world: flexible yet resilient and able to sustain themselves for centuries.
A hierarchical structure may be a precondition, provided it does not become too rigid.
Before 1700, economic life in Europe was largely traditional and had no incentives to expand. There were all kinds of rigidities impeding the production and use of goods, services, labour and capital: ‘gild regulations, monopolies, an excessive schedule of holy days (ninety-two in France in 1666), sumptuary legislation, monasticism, settlement laws, price controls, and taboos and religious sanctions on economic behavior or even on the study of science and technology’
These were large social and religious barriers to industrialisation, often actively defended by elites and institutions with their preference for privileges and command-and-control (‘conservatives’).
Wealth
The acclaimed benefits of globalisation for the poor are apparently undone by the opportunities for the rich to accumulate more wealth.
Poverty Line: Established by the World Bank and presently set at $1.25 US/cap/day (updated to $2.15 per person/day in Sep, 2022).
Pareto Power-Law Distribution: If assuming that all agents exchange with all others at the same rate, the system ends up in a situation where a small number of agents has a large share of the wealth. This is observed in the real world.
Wealth tends to be very broadly distributed when exchanges are limited and that favoring exchanges and, less surprisingly, increasing taxes seem to be efficient ways to reduce inequalities.
International financial flows have reached unprecedented levels, but only about 10% of the transactions are related to the ‘real economy’ of trade and production, the remainder being essentially speculative dealings.
Industrialism: Generated new forces of resistance, notably socialism in response to the human sufferings of early industrialism and romanticism as opposition against the new rationalism and commercialism.
In the 19c, state interventions broadened as a consequence of scientific and technological developments and of enlightened ideas about societal progress. Sanitation and sewage systems, medical care and schooling, clean air and water, social security and income redistribution all became to some extent state responsibilities.
With this came the need for larger state revenues.
Governments find it more and more difficult to balance expenditures and revenues, with the resulting problems of economic debt and inflation and social unrest.
Values shift from traditional to secular/rational, which correlates with the employment share of industry. A process of secularization and rationalization but also bureaucratization and centralization sets in, during which people become less dependent on the caprices of nature and science, and technology takes the place of religion as a source of authority. Social life gets organised in the uniform way of mechanized mass production, with rigid social classes and uniform standards. It appears this is the price people willingly pay for the enlarged control of technology over nature.
Survival to self-expression values. Survival needs are largely met and people' values move towards self-expression. This change coincides fairly well with the employment share of the service sector. Existential security concerns are replaced by the desire for personal autonomy, self-fulfillment and other forms of self-expression.
The metabolism is completely dependent on incoming solar energy, at an average density of 100 W/m2 and with strong fluctuations. There is always a delicate balance between food requirements for a growing population and food supply in a finite environment.
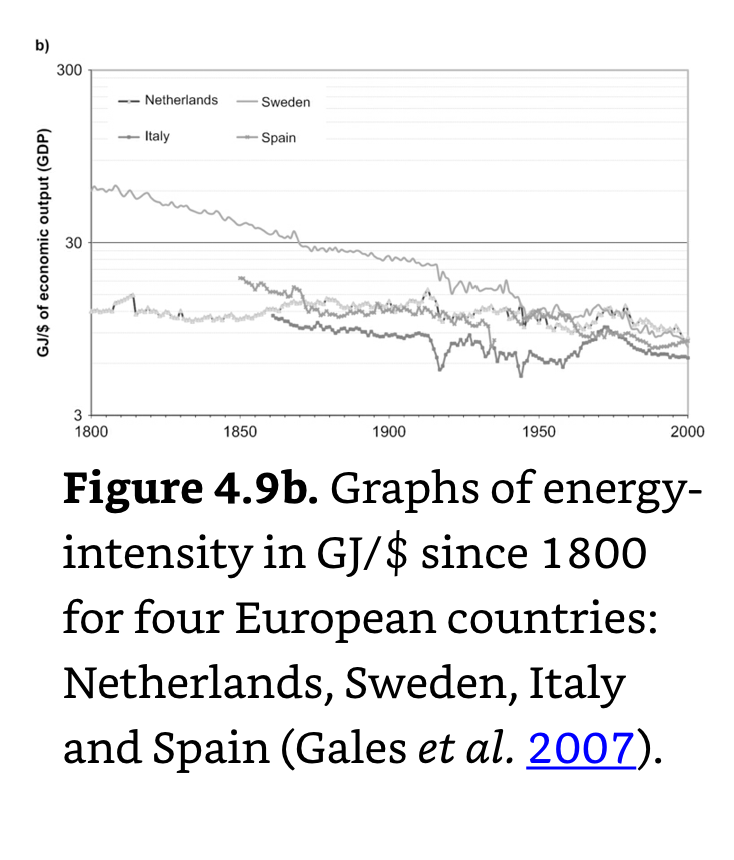
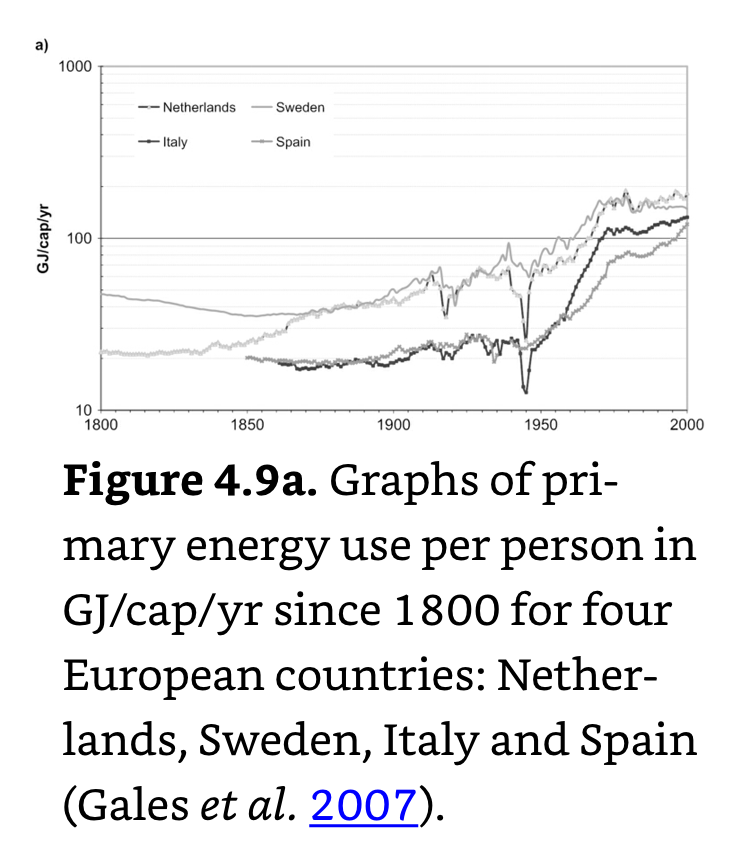
Primary energy use per person, in the range of 20–70 GJ/cap/yr and more than half biomass-based, had been more or less constant for a long period, but in the industrial era, it started to rise rapidly towards a new plateau with values in the range of up to 150 GJ/cap/yr by 1900.
Industrialism and the Environment
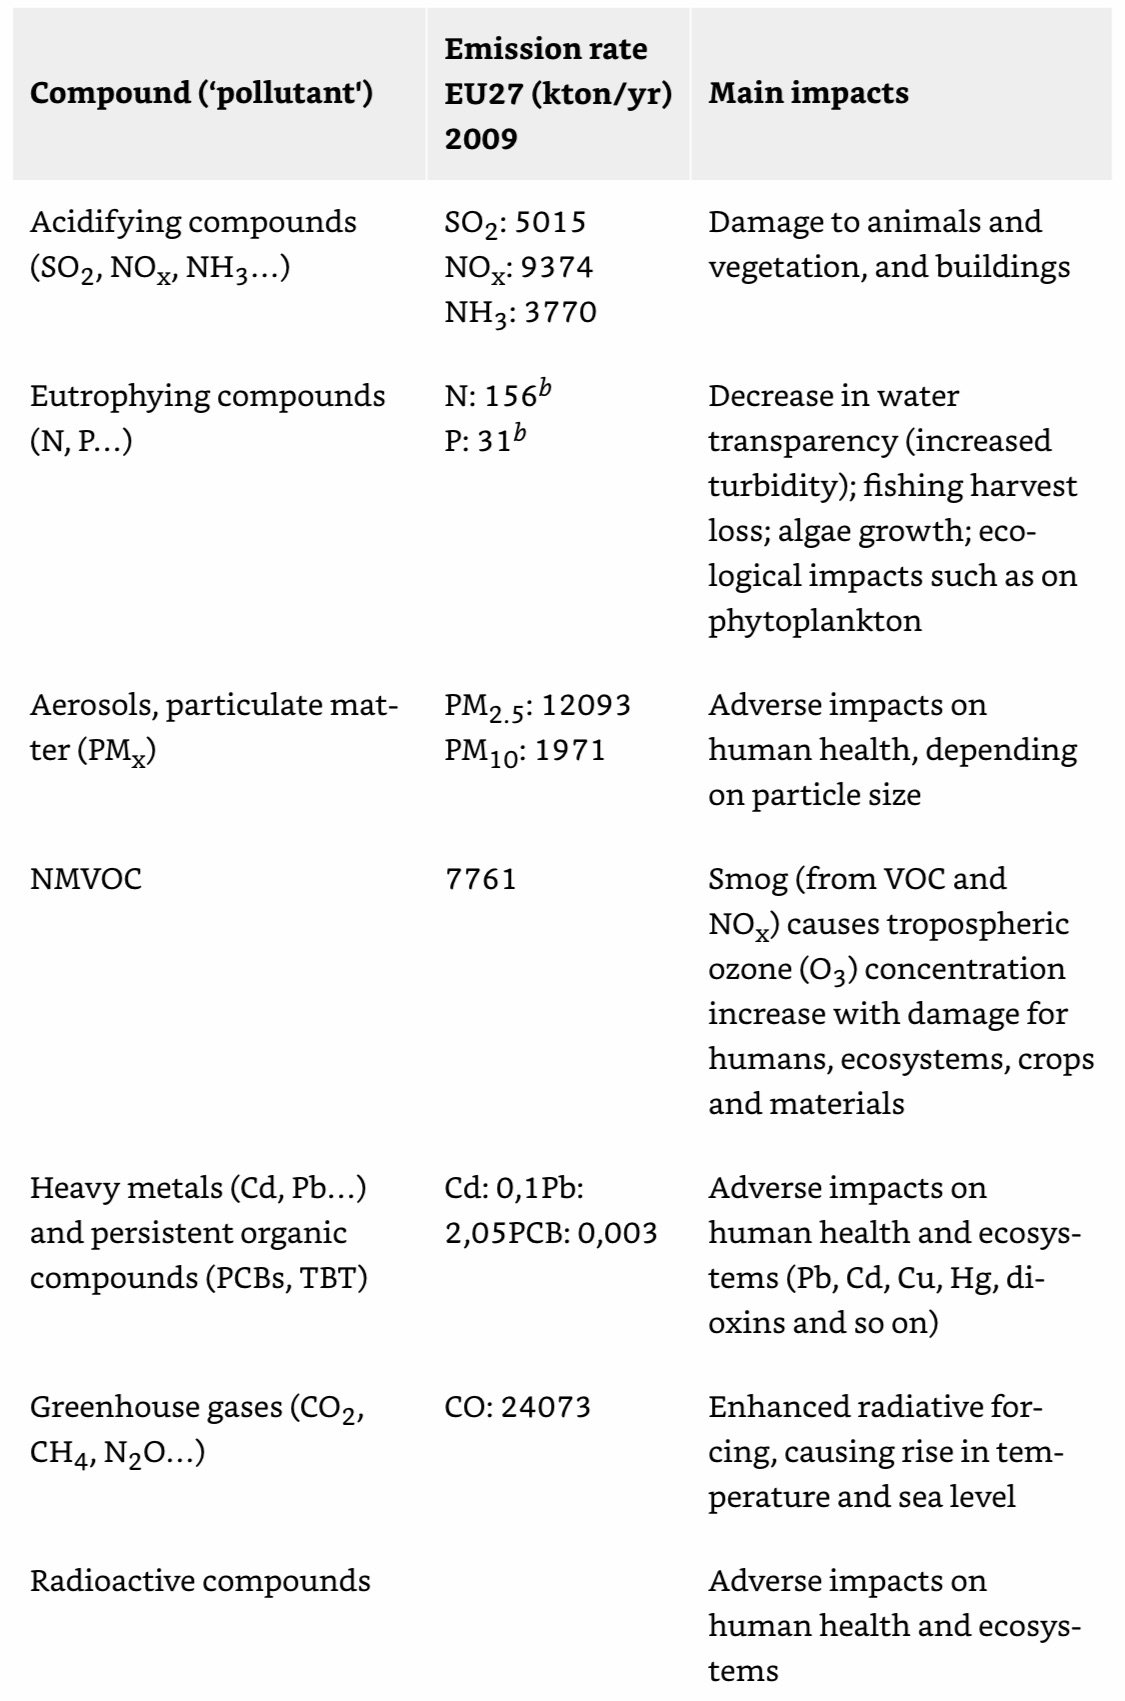
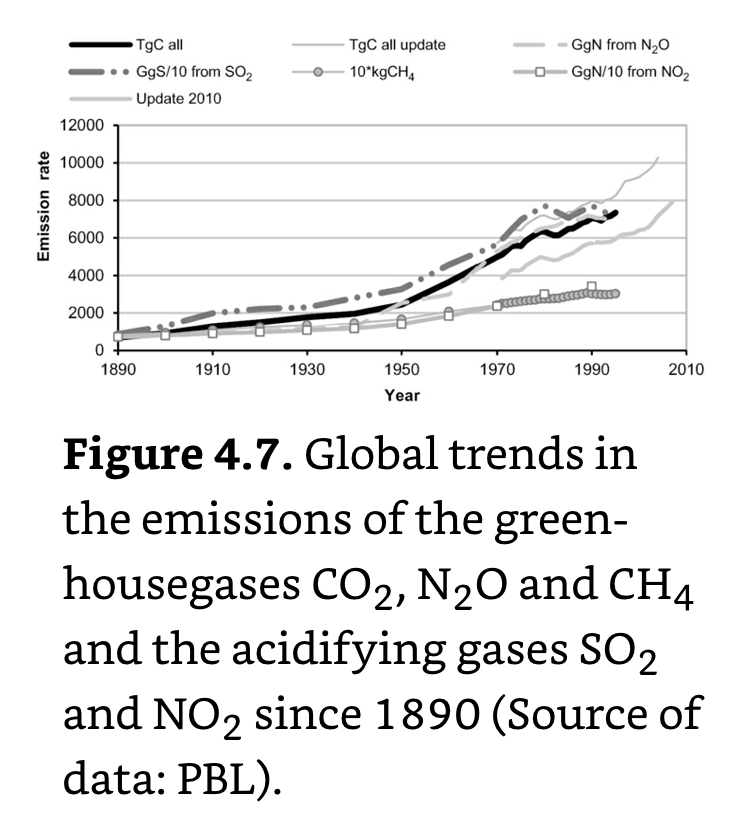
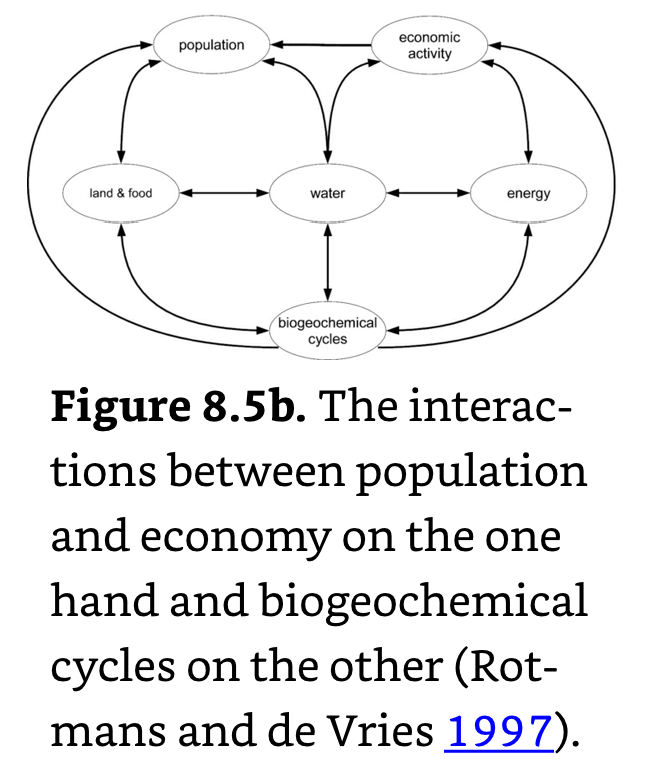
The natural carbon (C), nitrogen (N), sulphur (S) and phosphorus (P) flows are to an even larger extent, and at an ever-higher rate, influenced by human activities.
P: An essential ingredient for plant growth; naturally occurs in the form of phosphates, which are industrially produced, of which more than two-thirds are used in agriculture in fertilisers. Its widespread use is contributing to eutrophication.
N: Large scale production of industrial fertilizer begins impacting natural N cycles with the Haber-Bosch process (1908), in which N reacts with H to form NH3, which is converted into nitrates and nitrites.
Exponential growth in the combustion of fossil fuels and the change in land use and production of cement resulted in an average 9.3B tons of C emitted into the atmosphere annually in the period 2006–2009.
The emission of O3-depleting CFCs, which caused depletion of the stratospheric O3 layer, is another illustration of how effective policy cannot completely eliminate, but can at least significantly mitigate harmful impacts
The assimilative capacity of sinks is exceeded in many places in the sense that pollutant loads are only partly and slowly broken down at rates below the inflow rates.
A farmer in Mediterranean Europe needed in 900 CE about 16 hectares (ha) of which two-third were pasture to feed a five-person family (Mazoyer and Roudart 1997). This could sustain a population of 20–30 persons/km2. In Mid- and Northern Europe, these numbers were 34 ha and 8–15 persons/km2, respectively. This gradually rose to 30–80 persons/km2 around 1250 CE.
Post-Industrialism
Another noteworthy phenomenon is the productivity gap between manufacturing and services sectors, as observed first by Baumol (1967). Those parts of the service sector where the human element is crucial – such as entertainment, educational and personal care services – cannot realize the high rates of productivity increase that happen in manufacturing. This makes economic growth in the postindustrial economy different from growth in the industrial era and is one explanation of the decline in economic growth rates with rising income. It is counteracted by replacing expensive services with do-it-yourself activities, mechanization and robotization. These mutually interacting and reinforcing changes influence the modern world in ways that are hard to interpret and predict.
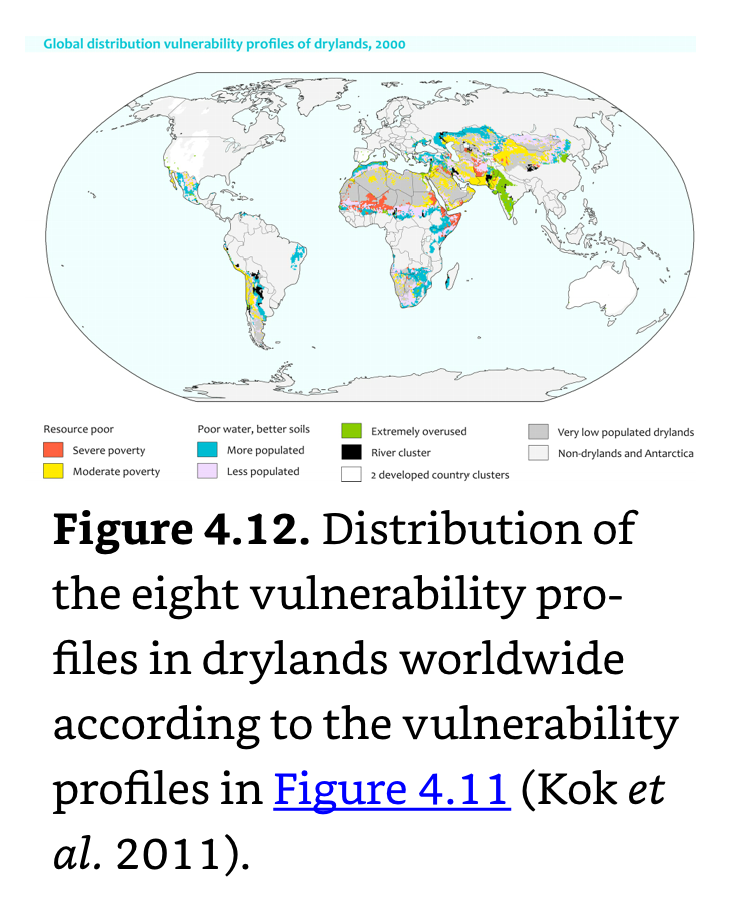
Vulnerability: A combination of exposures, sensitivities and adaptive capacities in a social-ecological system. Five questions of Vulnerability:
What are the main exposures, key vulnerable groups and their sensitivities that together define the pattern of vulnerability?
What are the basic vulnerability creating mechanisms that constitute this pattern of vulnerability?
In what form and where does this pattern manifest itself?
How can future changes within the human-environment system affect the human well-being situation for the vulnerable groups?
What are the opportunities – individual responses or policy responses – to cope with and adapt to future changes?
Global Vulnerability Syndromes
Sahel Syndrome: Overcultivation of marginal lands.
Overexploitation Syndrome: Overexploitation of natural ecosystems.
Rural Exodus Syndrome: Environmental Degradation through abandonment of traditional agricultural practices.
Dust Bowl Syndrome: Non-sustainable agro-industrial use of soils and waters.
Katanga Syndrome: Environmental degradation through depletion of non-renewable resources.
Mass Tourism Syndrome: Development and destruction of nature for recreational ends.
Scorched Earth Syndrome: Environmental destruction through war and military action.
Aral Sea Syndrome: Environmental damage of natural landscapes as a result of large-scale projects.
Green Revolution Syndrome: Environmental degradation through the adoption of inappropriate farming methods.
Asian Tiger Syndrome: Disregard for environmental standards in the context of rapid economic growth.
Favela Syndrome: Environmental degradation through uncontrolled urban growth.
Urban Sprawl Syndrome: Destruction of landscapes through planned expansion of urban infrastructures.
Disaster Syndrome: Singular anthropogenic environmental disasters with long term impacts.
____________________________________________________________________
Ch 5: Sustainability: Concerns, Definitions, Indicators
1654: The Irish prelate Ussher declares that, according to extensive research, creation had taken place on 26 October in 4004 BC at 9 AM.
The seven days of creation were actually seven eras of 74,832 years in total (Frenchman Buffon).
It is now scientific canon that in the past millions of years species have come and gone – the debate is about whether the causes behind the changes were evolutionary (‘survival of the fittest’), revolutionary (natural catastrophes) or both.
Investigations of how species interact with their environment and with each other led to the science of ecology.
Major Environmental Events
1960s: Gaia Hypothesis; organisms not only adapt to their environment, but that life created for itself the physicochemical environment in which it could flourish (Lovelock).
1971: The Club of Rome issues the report “Limits to Growth,” which used a computer simulation model to depict in quantitative detail the possible future trajectories of the human population, its food and industrial output and its resource base. The two main conclusions were: 1) if the present growth trends in world population, industrialisation, pollution, food production, and resource depletion continue unchanged, the limits to growth on this planet will be reached sometime within the next one hundred years. The most probable result will be a rather sudden and uncontrollable decline in both population and industrial capacity. 2) It is possible to alter these growth trends and to establish a condition of ecological and economic stability that is sustainable far into the future
A number of environmental problems are more difficult to tackle. Examples are the depletion of open-access resources such as fisheries and groundwater reservoirs, the degradation of agricultural soils, the cutting down of tropical forests under the pressures of wood demand and the emission of GHGs that cause climate change.
1972: UN Conference on the Human Environment (Stockholm).
1980: The International Union for the Conservation of Nature (IUCN) presents the World Conservation Strategy.
1982: Adoption of the UN Convention of the Law of the Sea (UNCLOS).
1987: The Montreal Protocol on Substances that Deplete the Ozone Layer is signed.
1987: The UN WECD publishes “Our Common Future (the Brundtland Commission)” which launches sustainable development as a new, overarching concept. Its main conclusion was that ‘humanity has the ability to make development sustainable to ensure that it meets the needs of the present without compromising the ability of future generations to meet their own needs’.
A world in which poverty is endemic will always be prone to ecological and other catastrophes.
1988: World Meteorological Organization (WMO) and UNEP set up the Intergovernmental Panel on Climate Change (IPCC).
1992: UN Conference on the Environment and Development (UNCED, ‘Earth Summit’), leads to the Rio Declaration and Agenda 21 in Rio de Janeiro.
1992: Convention on Biological Diversity (CBD) and UN Framework Convention on Climate Change (UNFCCC) is signed.
1994: UN Convention to Combat Desertification (CCD) is signed.
1995: The World Food Summit is organised by the UN FAO in Rome.
1997: First World Water Forum, organised once every three years is held by the World Water Council.
2002: The World Summit on Sustainable Development is organised in Johannesburg by the UN Commission on Sustainable Development (CSD) around five issues with the acronym WEHAB: Water and sanitation, Energy, Health, Agriculture, Biodiversity.
2005: Ratification of the Kyoto Protocol.
Environmental Days
22 Mar: World Water Day.
7 Apr: World Health Day.
5 Jun: World Environment Day.
22 Jun: World Day to Combat Desertification and Drought.
11 Jul: World Population Day.
16 Sep: International Day for the Preservation of the Ozone Layer.
1st Mon of Oct: World Habitat Day.
16 Oct: World Food Day.
24 Oct: United Nations Day.
The “Commons” and the need for Sustainability
First, according to modern science, everything is connected and in change. Nothing happens in isolation, which is why we need a system's view. Second, resource management is inherently a collective affair. We interact with each other through the use of environmental sources and sinks, which are part of the public space – or, more solemnly, of the ‘common heritage of mankind’.
Rival (Rivalrous) Good: A good r service that loses its value upon consumption; i.e. Food.
Non-Rival Good: A good or service that can be used again and again and also simultaneously by many consumers; i.e., a beautiful sunset.
Excludable: A good that someone can prevent people from consuming or enjoying. Most private goods are.
Non-Excludable: A good where one cannot exclude another person from enjoying; the owner cannot enforce a meaningful form of payment from it.
Common Pool Resource: A rivalrous and non-excludable good; i.e., water in an aquifer, fish in the ocean.
For common pool resources, governments negotiate and implement collective arrangements and regulatory frameworks. For private goods and services, the market is the dominant system of provision of goods and services, based on prices.
Many resources are shared by more than one state, and legal arrangements are needed to settle user rights – leaving aside the option of conquest.
Those who benefit from positive externalities cannot be made to pay for it by those who provide it and those who suffer from negative externalities have no user right or claim which permits them to punish the polluter or be compensated. Obviously, in all these situations, the collective, a government of some sort, has to mediate.
Solutions are a redistributive tax – the inclusion of the damage in the prices (‘internalizing’), assigning property rights and negotiating a workable arrangement among stakeholders.
Requirements for a sustainable society: 1) avoidance of risks at the macroscale; 2) use of renewable energy sources as much as possible; 3) limitation of the use of non-renewable resources to a minimal share of the available resources, and 4) consumption of renewable resources that does not exceed the amount that is sustainably produced by nature.
Sustainable Development: ‘Improving the quality of human life while living within the carrying capacity of supporting ecosystems’ (IUCN-WWF 1991).
A sustainable society requires attention for the long term; to keep open as many options for future generations as possible; continuous redistribution of global energy resources; and a “contract” with nature in order to reach a just and responsible use of the harvest (World Council of Churches, 1976).
Characteristics of a sustainable society: 1) a political system that ensures the effective participation of citizens in decision making; 2) an economic system that generates value added in an intrinsic and sustainable way; 3) a social system that is capable to resolve tensions caused by inharmonious developments; 4) a production system that keeps the natural base intact; 5) a technological system that searches continuously for new solutions; 6) an international system that ensures sustainable structures for trade and finance; and 7) a management system that is flexible and can correct itself.
Many poor people have no alternatives other than using their resources in an unsustainable way, a situation that is aggravated by exploitative trade and aid patterns. This view is prevalent among development NGOs and UN organizations like UNDP and implies that the quest for sustainable development should focus on breaking the poverty-overexploitation cycle. This asks for better governance and institutions and internationally coordinated trade and aid regulation.
A focus on efficiency equates sustainable development in essence with environmental protection and argues that economic growth is a precondition, in the sense of affordability, for sustainable development. Measures and policies should not impede economic growth and be done in the economically most efficient way. Prices must be market-based ‘optimal’. It is the prevailing view among the business and government elites.
Sustainable Development Indicators (SDI)
A goal (target, objective or purpose) has to be formulated, and 2) quantitative and qualitative descriptions of the goal and associated indicators should be formulated for operational action and monitoring. A score is given to each of the forty administrative regions along the dimension social (people: societal coherence), economic (profit: income generating capability) and ecological (planet: quality of nature and culture). The scores are based on a dozen properties, each in turn derived from forty-five characteristics. The results are shown in maps, one for each of the three P's and one for the aggregate.
One can make a list of items and conditions for such an SDIS. First, its construction is an interdisciplinary effort, with inputs from physics to philosophy. It must be possible to quantify or find adequate proxies and assign units to the indicators in the SDIS: physical stocks and flows to describe ecosystems and societal metabolism, monetary units to describe economic transactions and, finally, other units to describe the complexities of human society.
The SDIS should be balanced and address essential dimensions of sustainable development of a (sub)system such as social equity and sufficiency, economic efficiency, and environmental and ecological sustainability.
UN Millennium Development Goals (MDGs): Eradicate extreme poverty and hunger; Achieve universal primary education; Promote gender equality; Reduce child mortality; Improve maternal health; Combat major diseases; and Ensure environmental sustainability.
Genuine Progress Indicator (GPI): Later developed into the Index of Sustainable Economic Welfare (ISEW) for countries. Its main assumption is that GDP and income (GDP/cap) is a false measure of well-being because it counts many undesirable or harmful activities as positive. Therefore, those activities – such as pollution abatement but also car accidents and military adventures – are to be subtracted from the official GDP figures.
Ecological Footprint (EF): Expresses environmental impacts in terms of the equivalent space used and is calculated by adding up the cultivated land required for growing crops, pasture for grazing animals, forests for timber production, the space related to fishing grounds, the land use for the built environment (housing, transportation, infrastructure and power stations) and other space requirements.
____________________________________________________________________
Ch 6: Quality of Life: On Values, Knowledge, and Worldviews
The scientific ‘facts’ about the world, important and accurate as they may be, have to be complemented with what people value and believe.
The search for sustainable development involves ‘objective’ science and ‘subjective’ perspectives
For a sustainable development path, the dominant worldview should be a balanced ‘integral’ worldview.
Quality of Life
Throughout history, individuals have struggled to realize their idea of ‘the good life’, by exploiting environmental opportunities and cooperating with and oppressing others.
1954: Maslow argues, partly as a rebuttal of behaviorism, that people behave and use their resources in such a way that their physiological needs (food, shelter and so on.) are met first. When these ‘basic needs’ are sufficiently satisfied, people will orient themselves towards higher needs: safety, belonging and being loved.
Even higher on the needs hierarchy are esteem and self-actualisation.2 Or in Bertold Brecht's famous phrase: ‘Erst kommt das Fressen, dann kommt die Moral…’. Maslow's theory is a holistic approach that offers the prospect of unlimited opportunities for personal growth, provided that basic needs can be fulfilled.
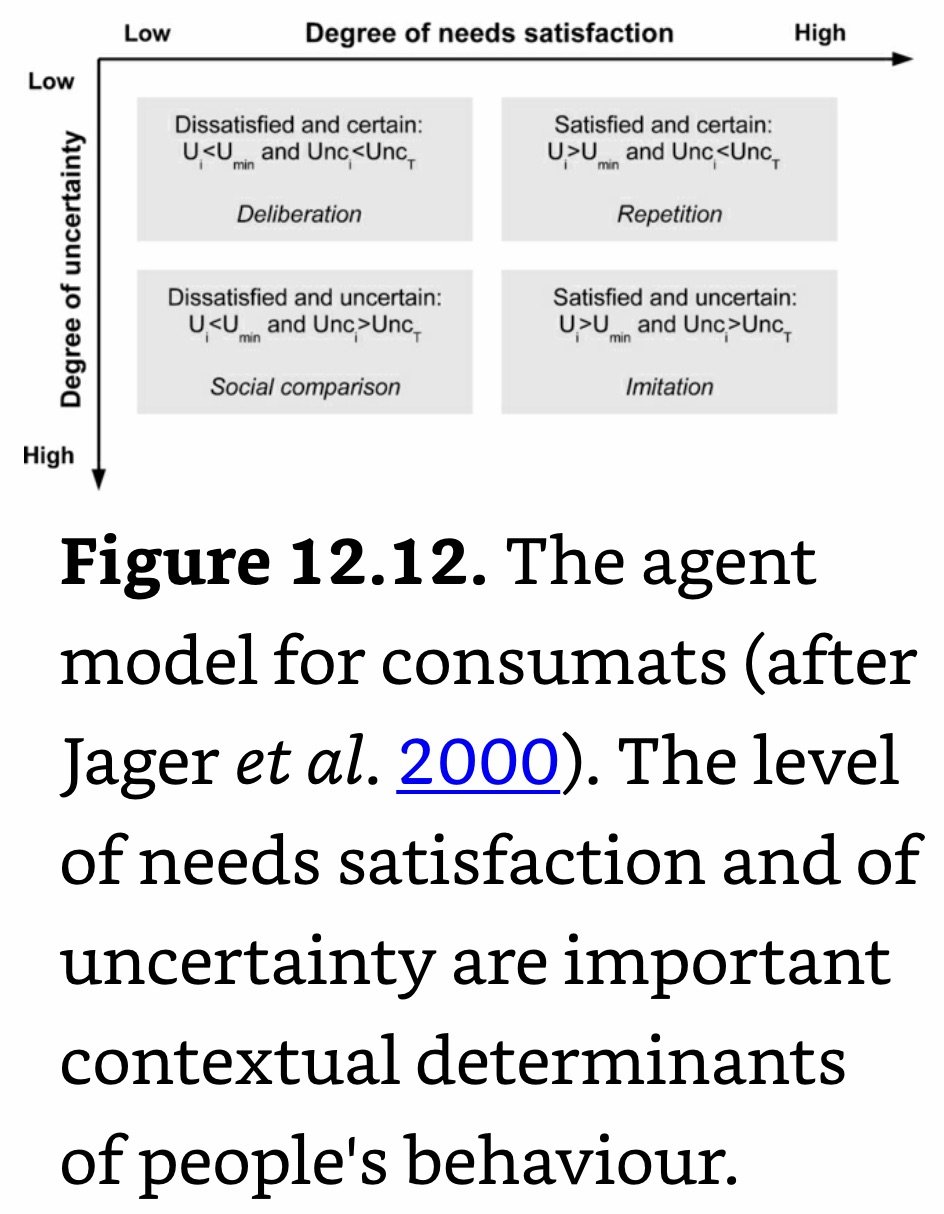
The rational choice is to satisfy those needs that maximize utility/benefit or minimize regret/cost for a given income.
The scientific literature suggests seven factors that really matter for an individual's experience of ‘being happy’: 1) family ties, 2) financial situation, 3) work, 4) social environment, 5) health, 6) personal freedom and 7) philosophy of life, in order of importance.
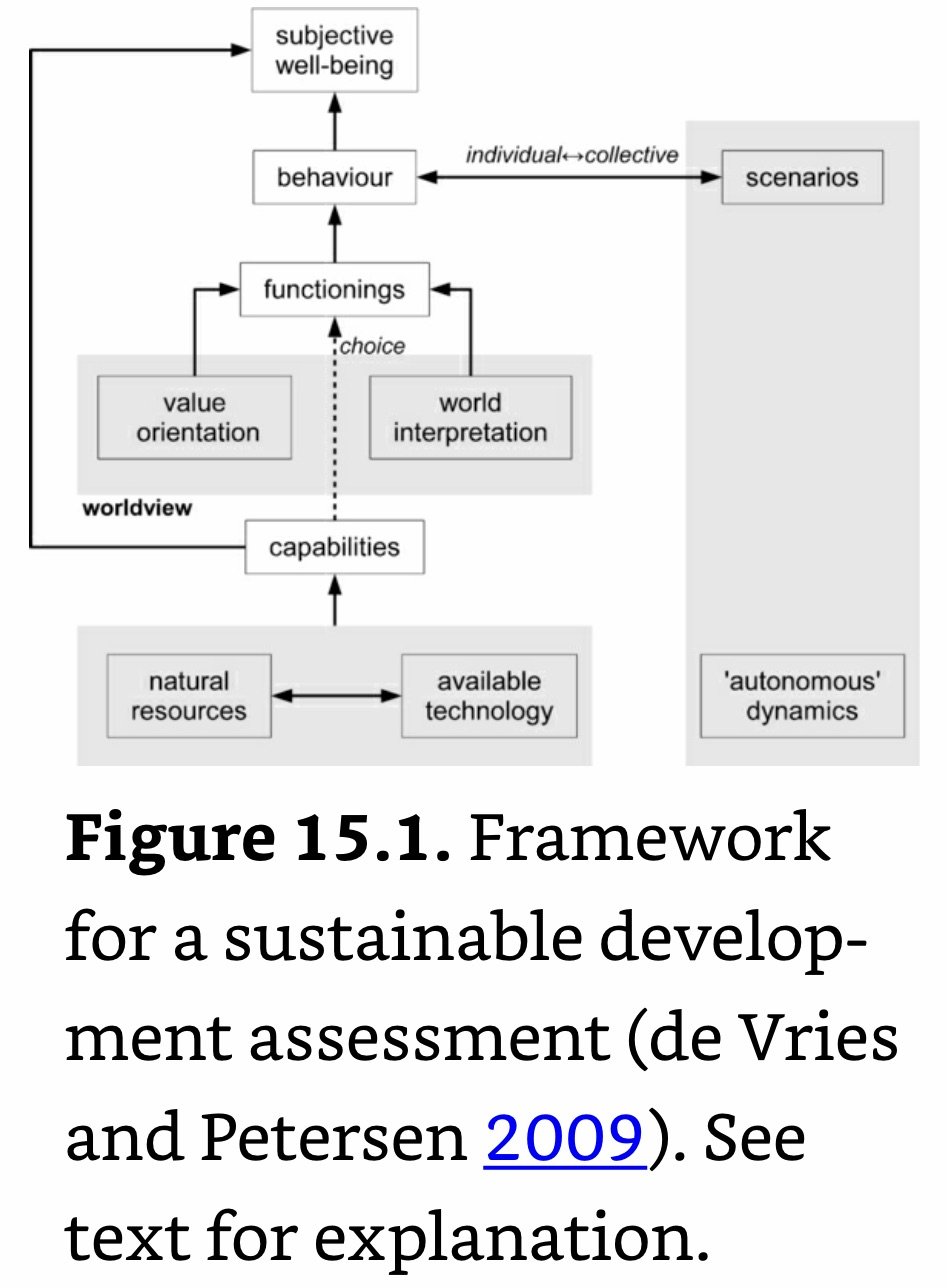
Well-Being: A function of the ‘objective’ social-economic situation (income, family size, education level, health situation and so on) but also of subjective experiences of a person's situation (health, job, marriage, community, religion and so on).
Capability Approach: Connects the subjective experience of a good quality of life – freedom to choose ends – with the objective resource-oriented aspects – means to realize ends.
Human Scale Development (HSD) Theory: Postulates that development is about people and not about objects and that the best development process is one that allows the greatest improvement in people's quality of life.
Satisfier: Anything that contributes to the actualization of human needs; includes space, social norms and practices, and organizational and political structures. They render needs historical and cultural. Economic goods are their material manifestation.
Pseudo-Satisfiers: Items or behaviors that give a false sense of satisfying an axiological need, usually via propaganda, advertisements and other forms of persuasion; includes certain medical treatments (‘placebo’) for subsistence and protection; status symbols and chauvinistic nationalism for identity; and formal democracy for participation.
Inhibiting Satisfiers: Items or behaviors that satisfy a given need excessively and at the expense of other present and future needs satisfaction. They usually originate in customs, habits and rituals; includes economic competitiveness in the name of freedom, which often inhibits the needs for subsistence, protection and affection, or religious fundamentalism providing identity at the expense of understanding and freedom.
Reference Drift: The phenomenon that the needs of an individual influences and is influenced by the needs of others.
Preference Drift (Hedonic Treadmill): Needs and their satisfaction change over time as a consequence of habituation, new experiences and knowledge and novel goods and services. A person needs an increasing income in order to remain satisfied because he is, in retrospect, less happier with the income gain than he had expected. It is a growth-promoting feedback loop.
The U.S. Academy of Sciences identified in its report Our Common Journey: A Transition Toward Sustainability (1999), four grand values in people's collective aspirations: peace, freedom, development and environment.
Value: A prescriptive conviction about desirable behavior and goals, in particular in a longer-term perspective. Values are manifested in the choices people make among different alternatives and are also an expression of their moral principles.
On the basis of interviews and in combination with datasets on socio-economic variables (age, gender, income and so on), the value clusters have been given an ‘identity’ and a name: Caring (14%), Conservatives (15%), Hedonists (10%), Luxury Seekers (10%), Business-like people (8%), Cosmopolitans (9%), Engaged people (13%) and the middle group of Balanced people (21%). Within this framework, Caring people value immaterial aspects of life and Luxury Seekers value the material ones. Conservatives share an immaterial oriented lifestyle with the Caring people, but tend to focus more on the local ‘own’ situation. On the opposite side, one finds Cosmopolitans and Business-minded people, for whom the money, travel and opportunities of the Big World are important ingredients of quality of life. Hedonists are small-scale and self-oriented, in combination with a materialistic attitude. Engaged people are their opposites, with a political and idealist perspective and a focus on global-scale issues.
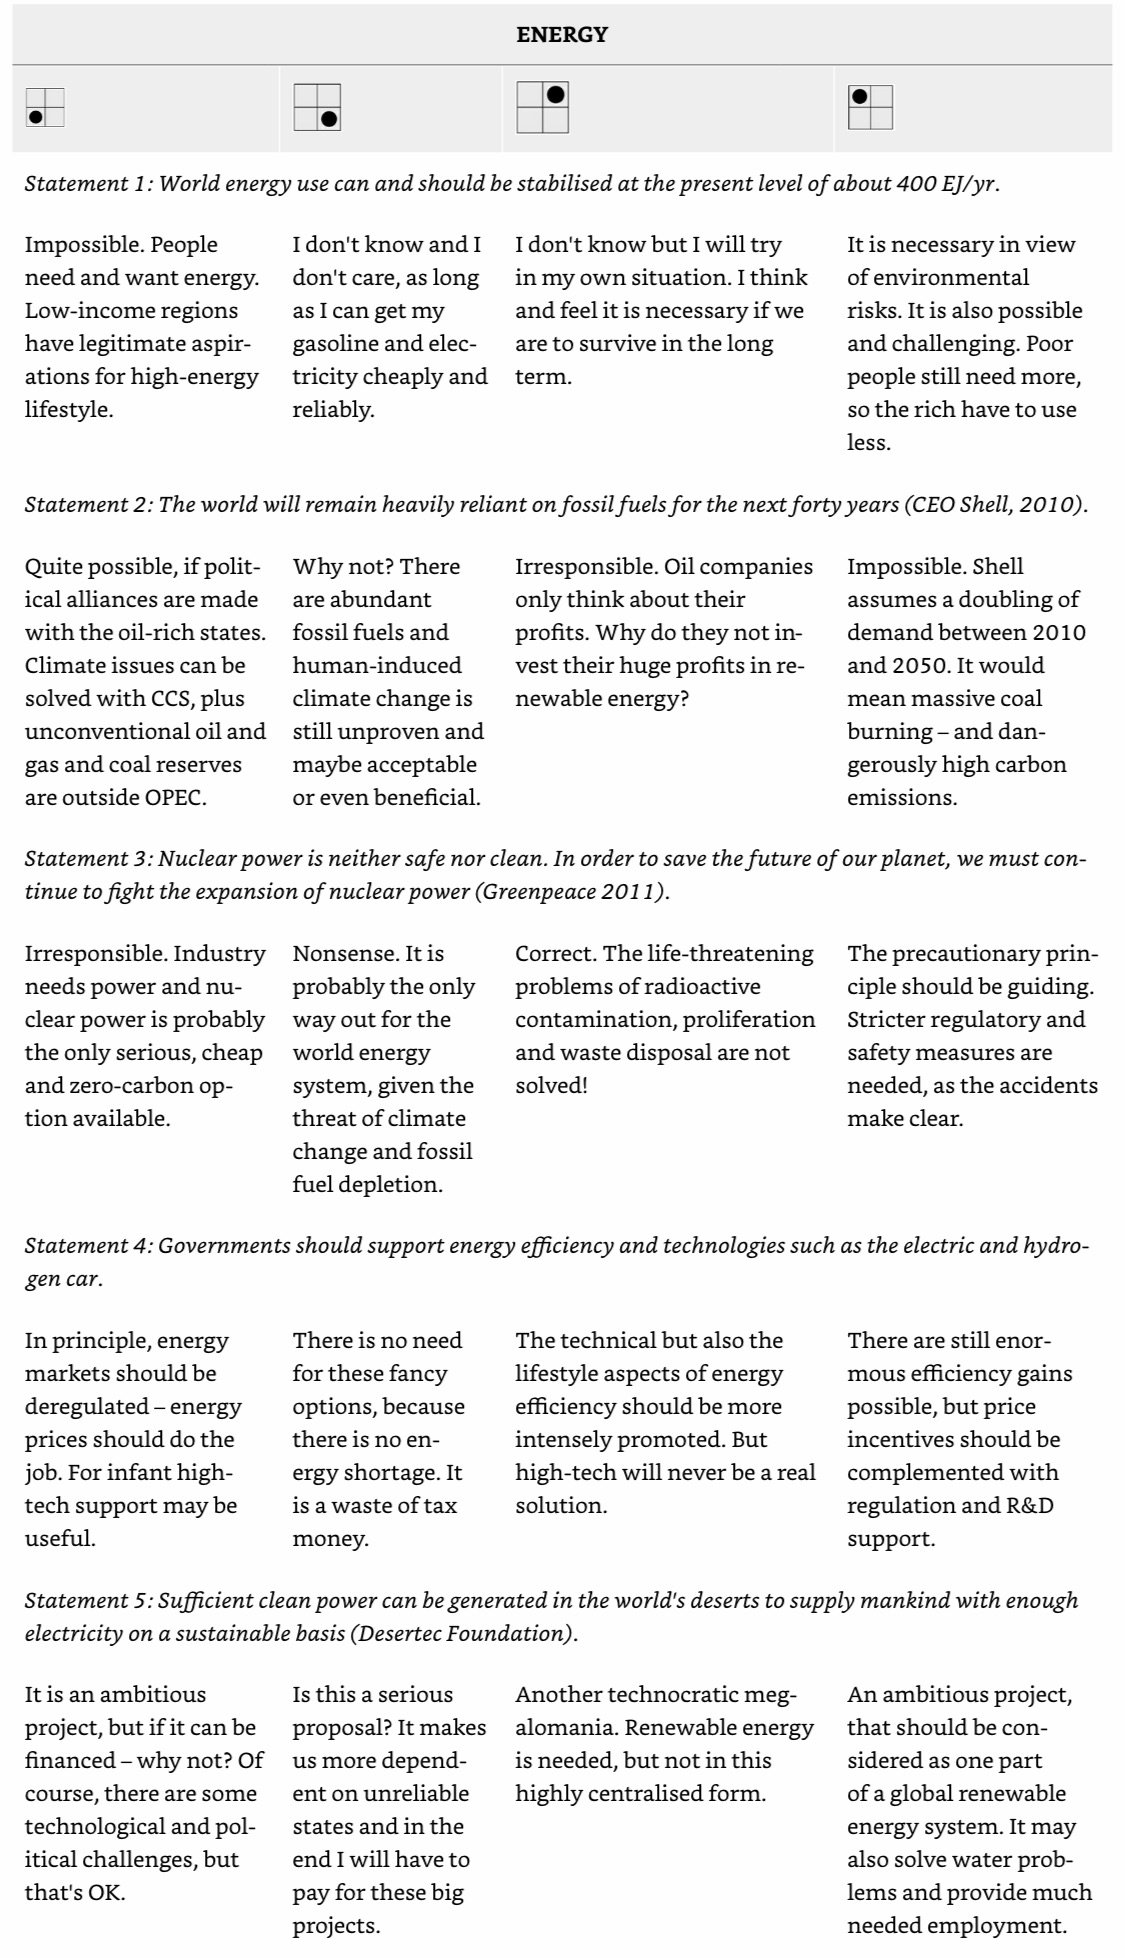
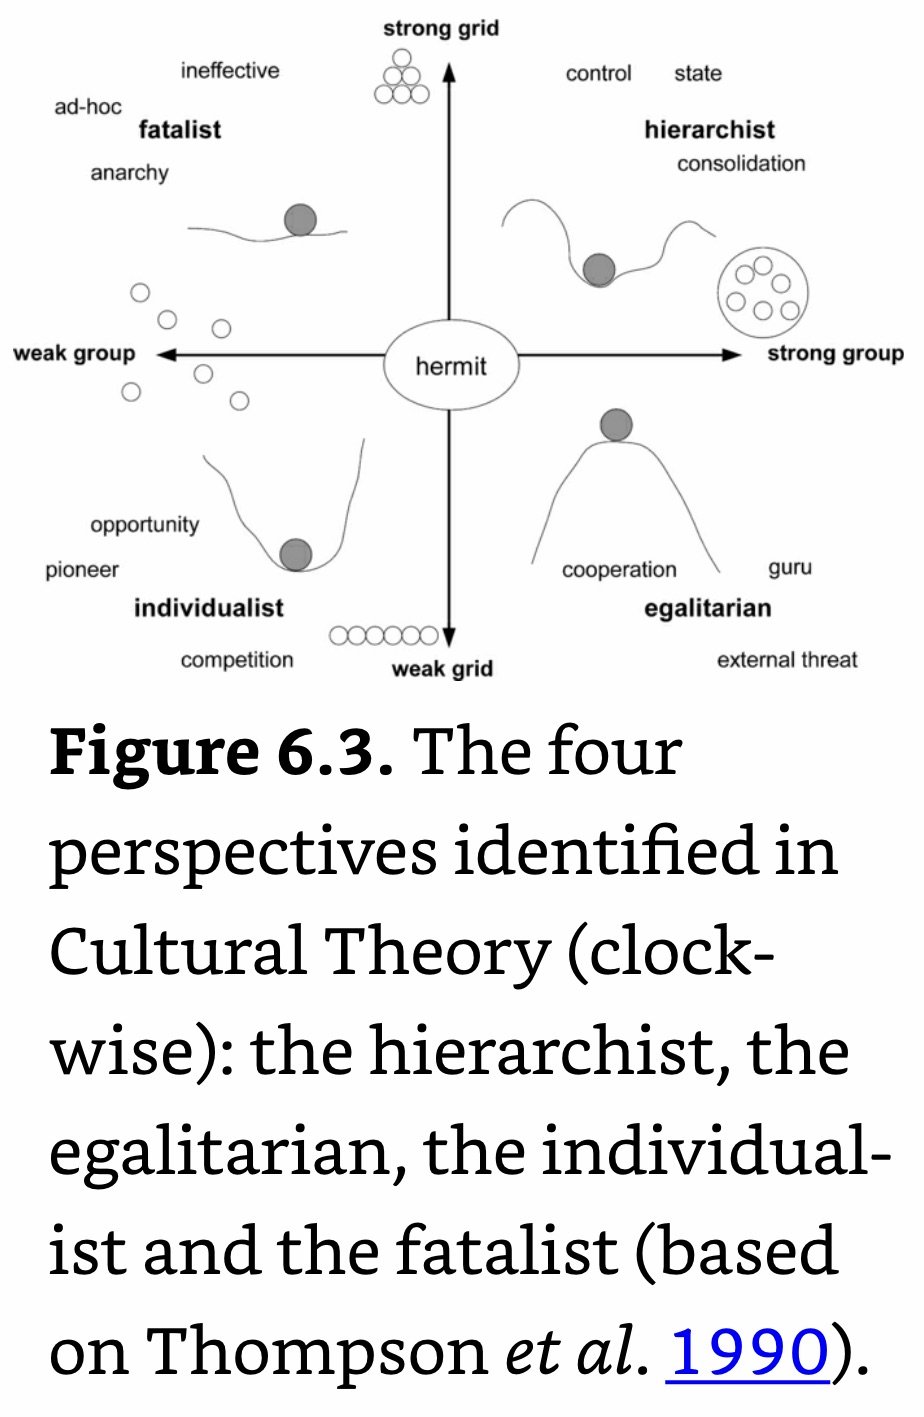
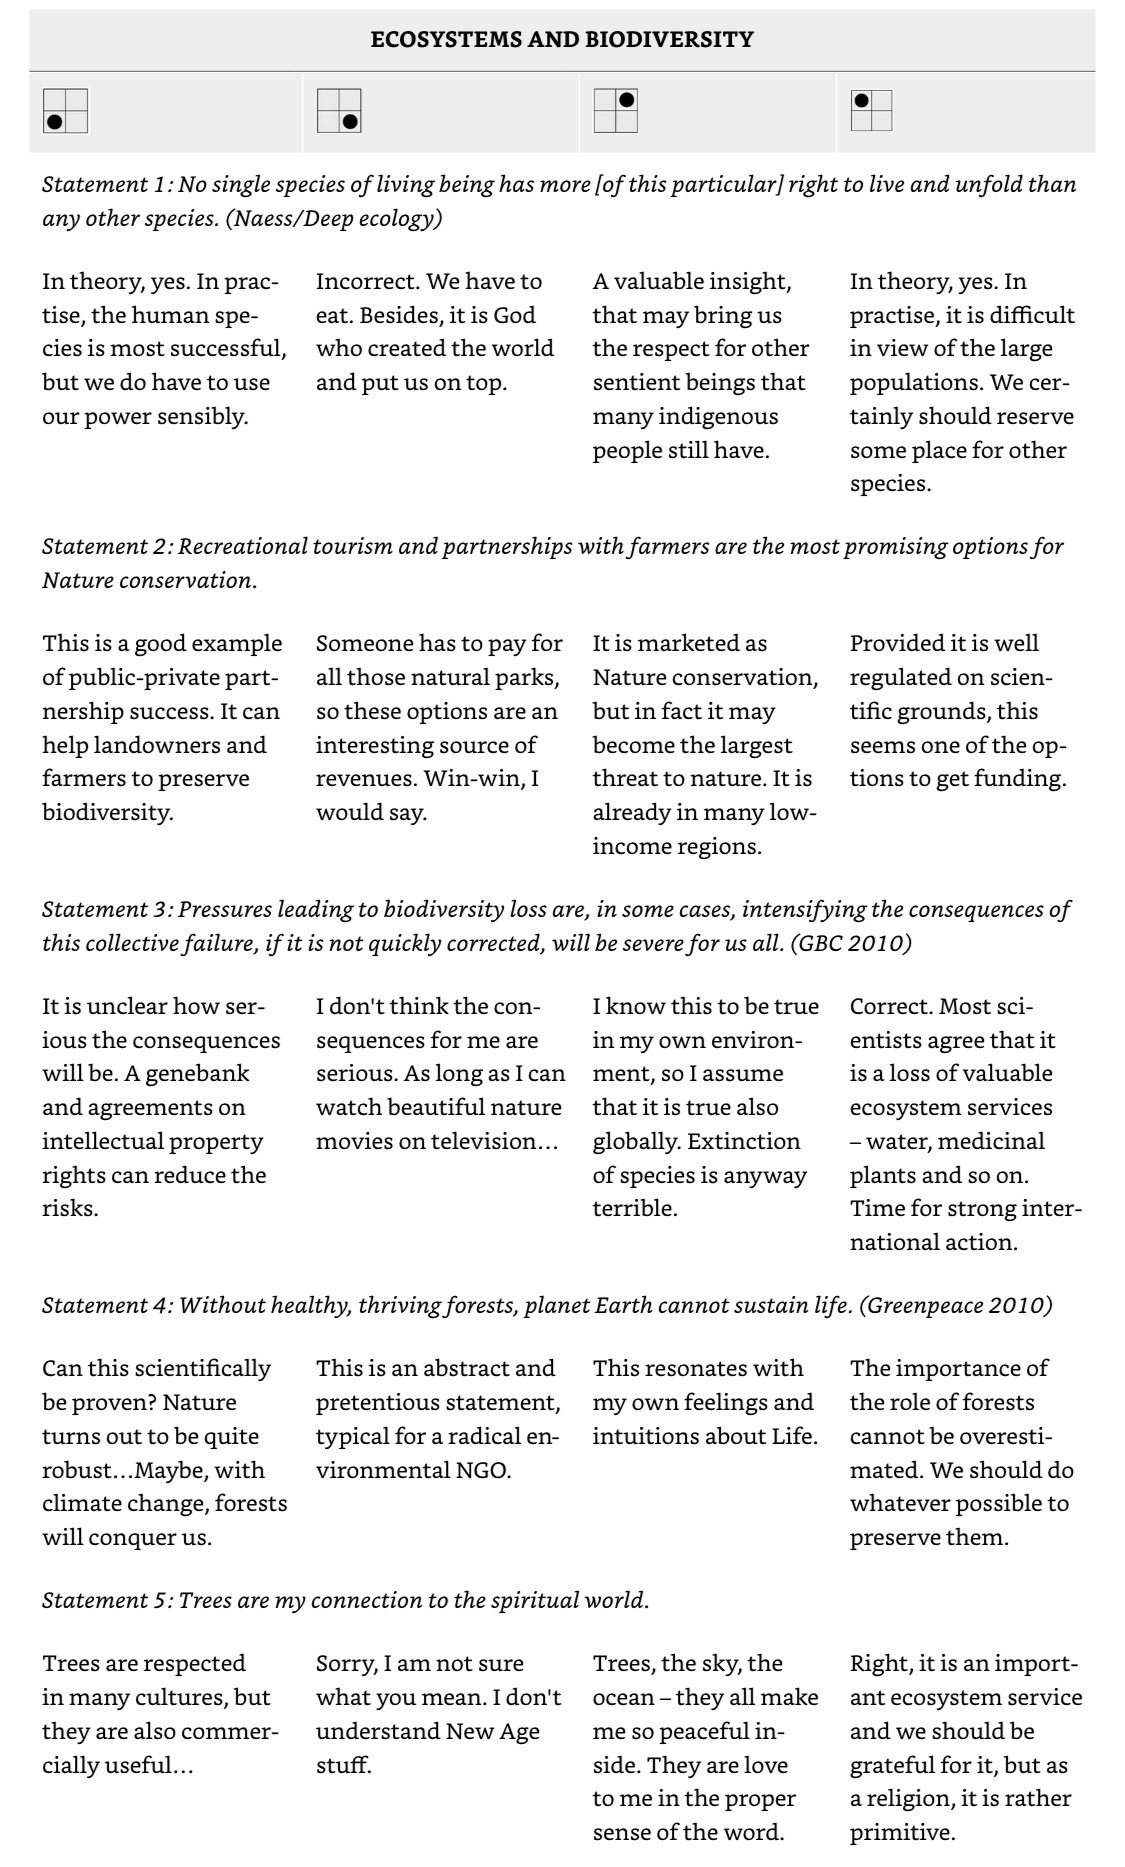
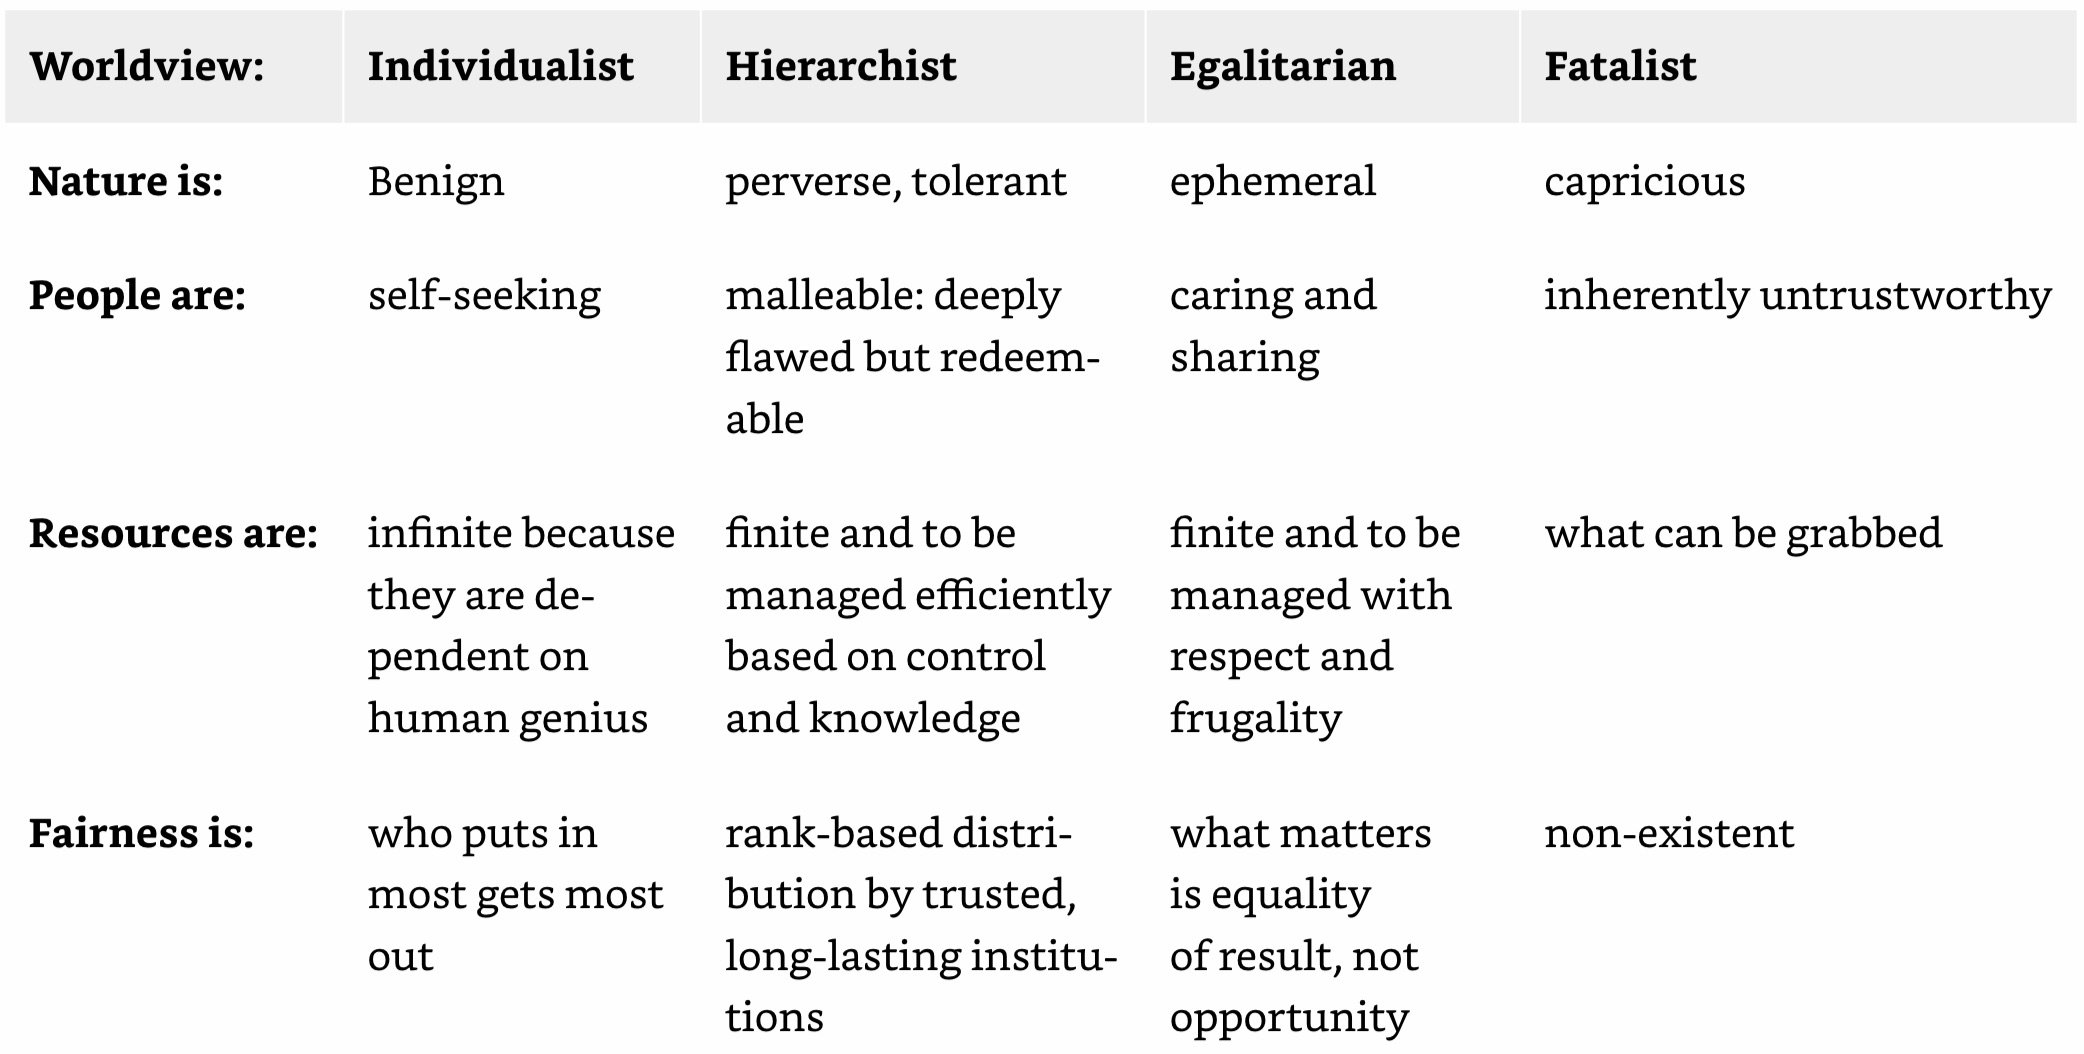
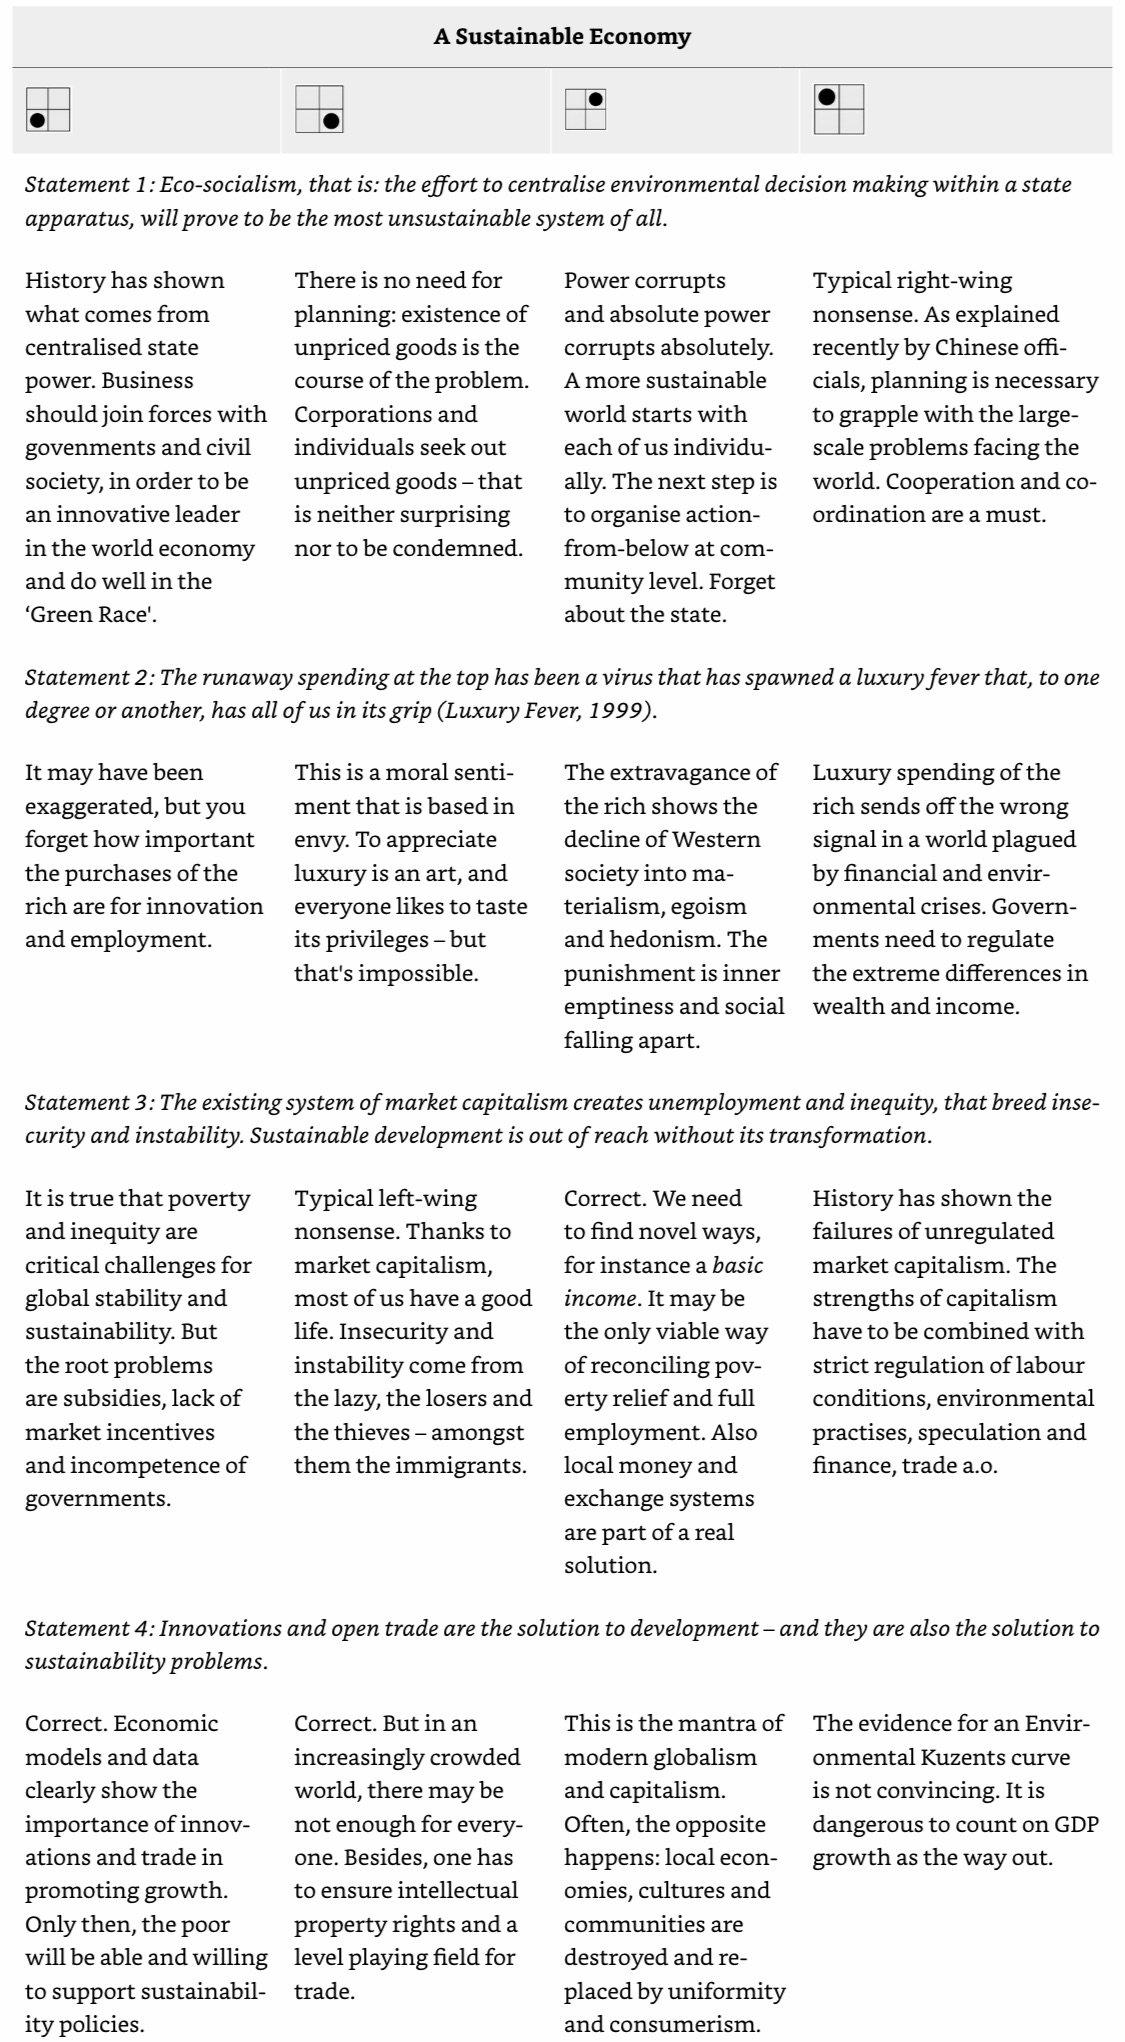
Cultural Theory: Distinguishes four perspectives on how people experience and interpret reality, and organize themselves and manifest rationality, solidarity and fairness. These perspectives – one can also speak of visions or myths – are categorized along two axis: the degree to which individuals behave and feel themselves part of a larger group of individuals with whom they share values and beliefs (the group axis), and the extent to which individuals are subjected to role prescriptions within a larger structural entity (the grid axis).
The hierarchist (high on both), the individualist (low on both), the egalitarian (high in ‘group’, low in ‘grid’) and the fatalist (low in ‘group’, high in ‘grid’).
Hierarchist: Favors control and expertise in order to guarantee stability within a world of limits.
The hierarchical organization is intent on securing its own continuity; hence, it is not easily mobilized for policies that go beyond accepted risks or challenge the status quo.
‘The world needs to manage its activities to keep the adverse outcomes [of environmental impacts] within prudent bounds and to redress current imbalances.’
‘The concept of global governance: There is no alternative to working together and using collective power to create a better world’. The UN should play a leading role here.’
Individualist: Convinced that nature has inherent stability and abundance.
Individuals alter their perspective when it is no longer reconcilable with their experience. Collective institutional change happens whenever larger groups of people start to doubt the correctness and adequateness of the dominant perspective.
Egalitarian: Emphasizes the fragility of nature and the possibility of irreversible destruction.
‘Human knowledge of the earth is limited. The basic premise is equity between man and nature and among people, as expressed in the image of people as stewards or partners.’
Fatalist: Experiences the world as determined by pure chance.
Many of the world's poor are fatalist in their outlook on life. They try to cope with everyday life's contingencies within the limited freedom of manoeuvre that they have.
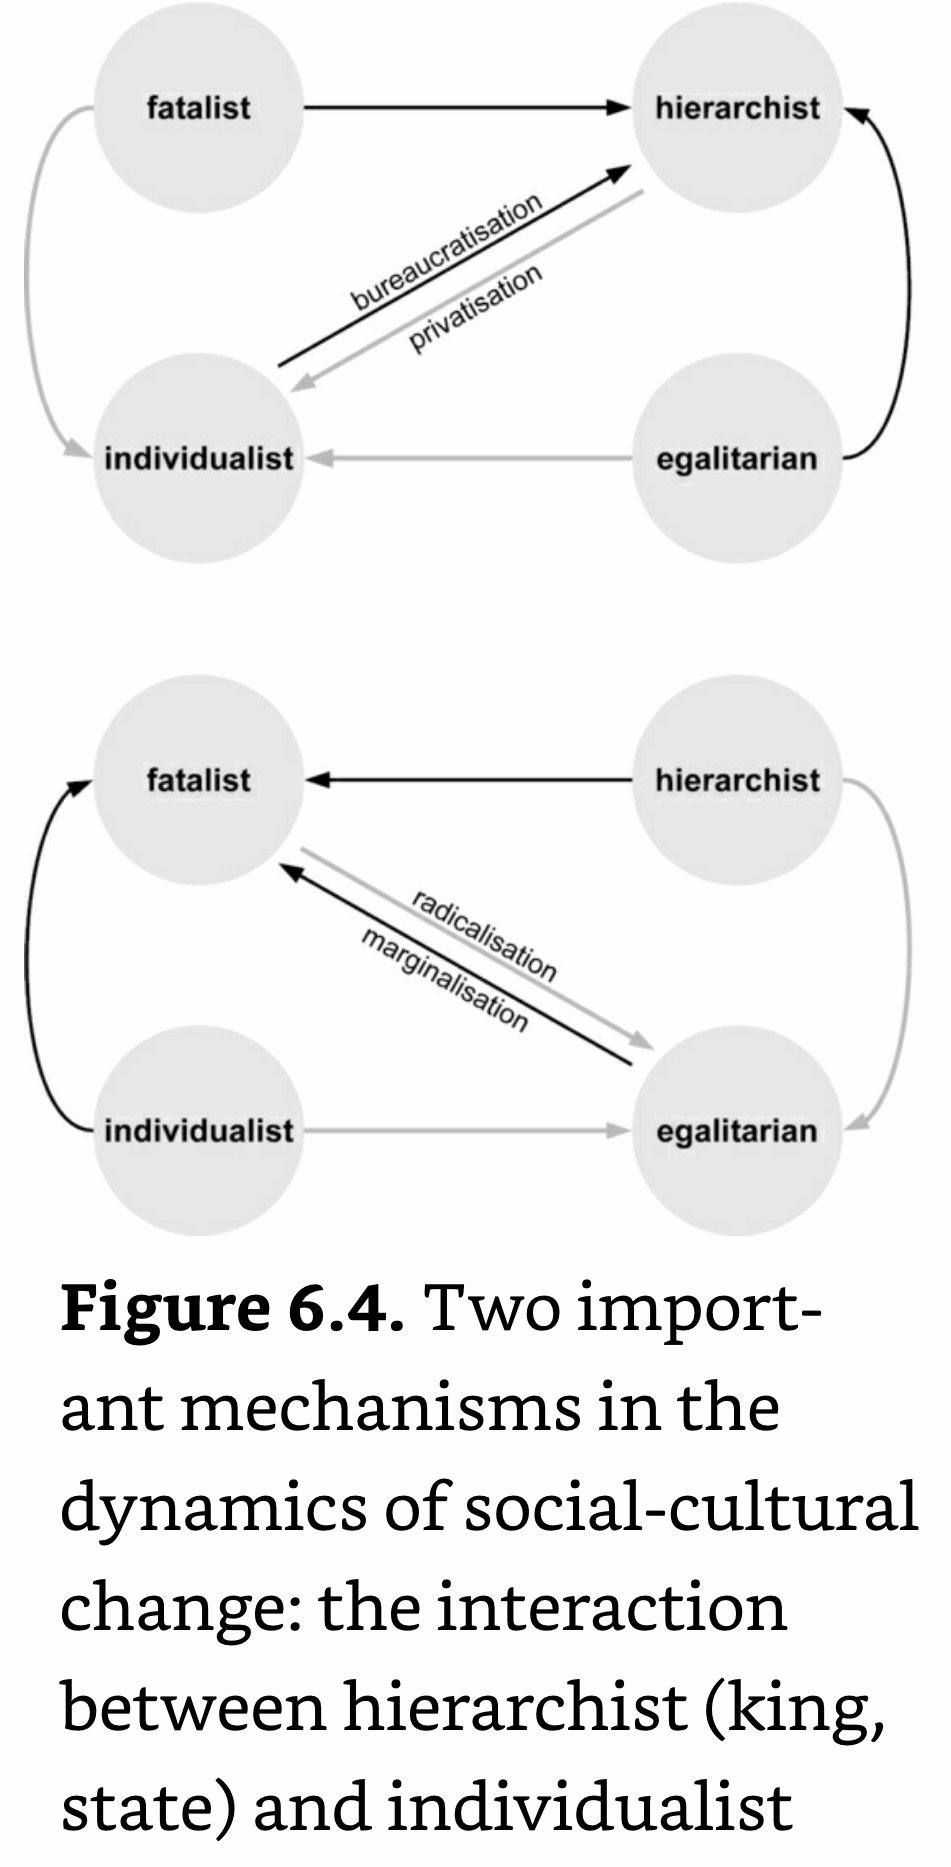
Excessive hierarchism leads to bureaucratization and, at some point, the system collapses and liberalization and privatization processes take over. Excessive individualism leads to marginalization of the less successful people who then resort to fatalism, which in turn feeds egalitarian movements in a process of radicalization.
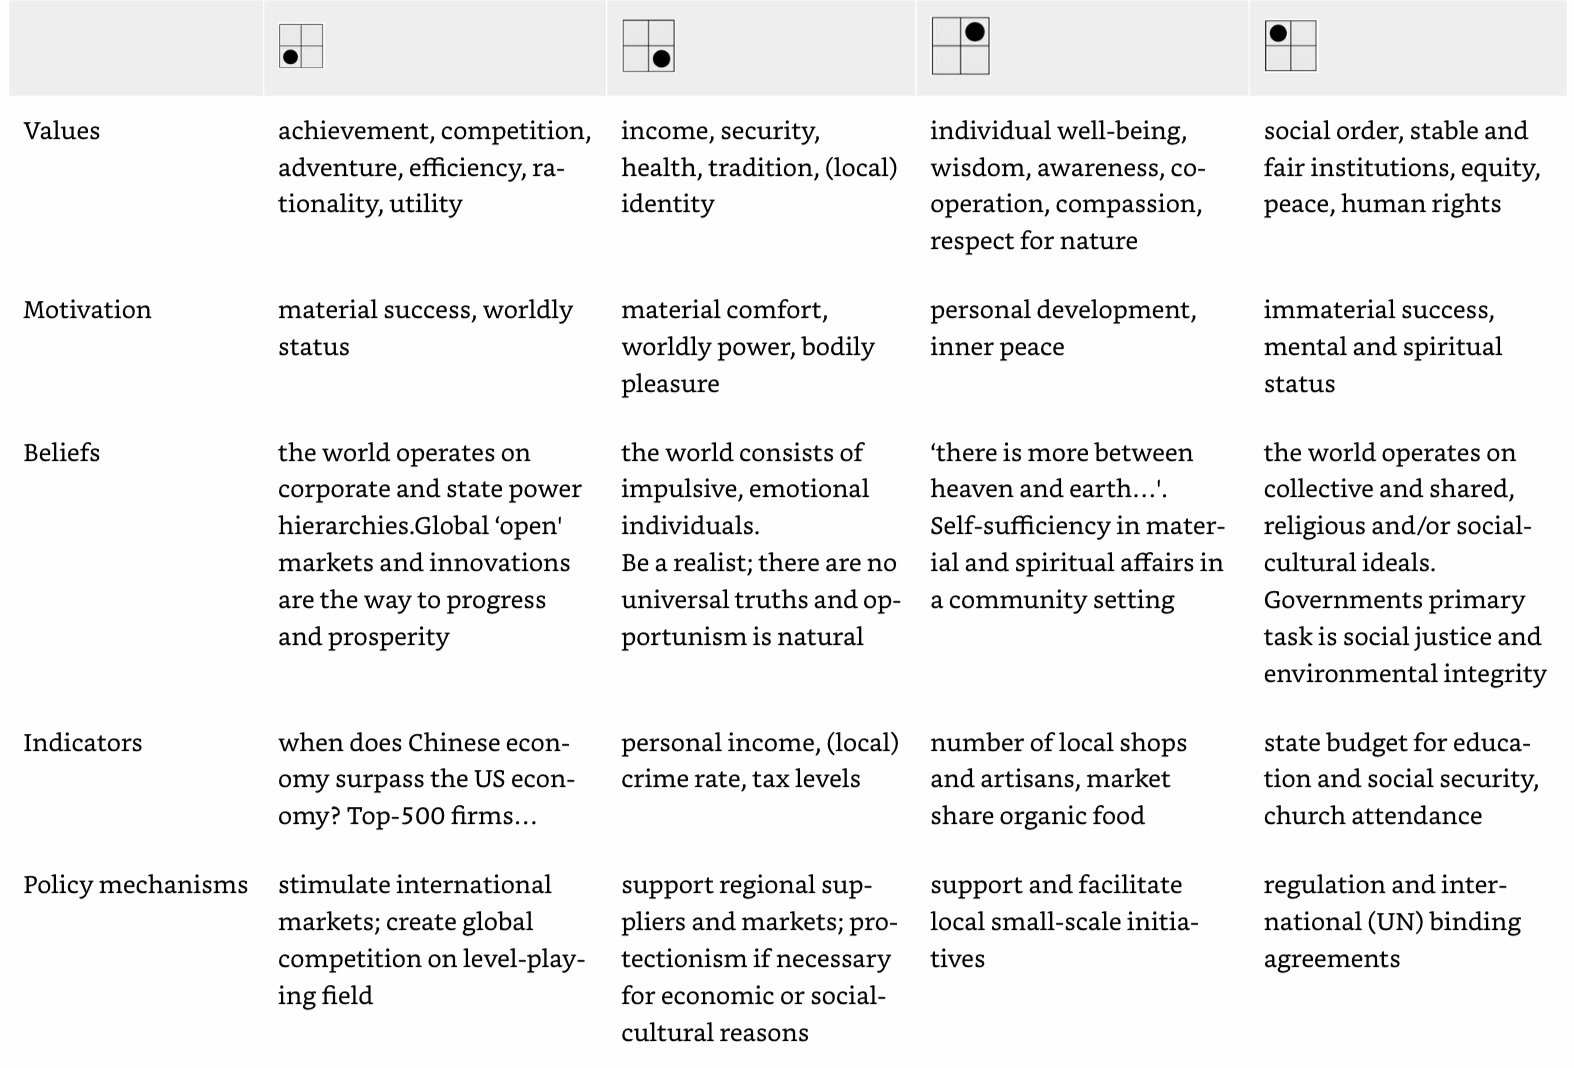
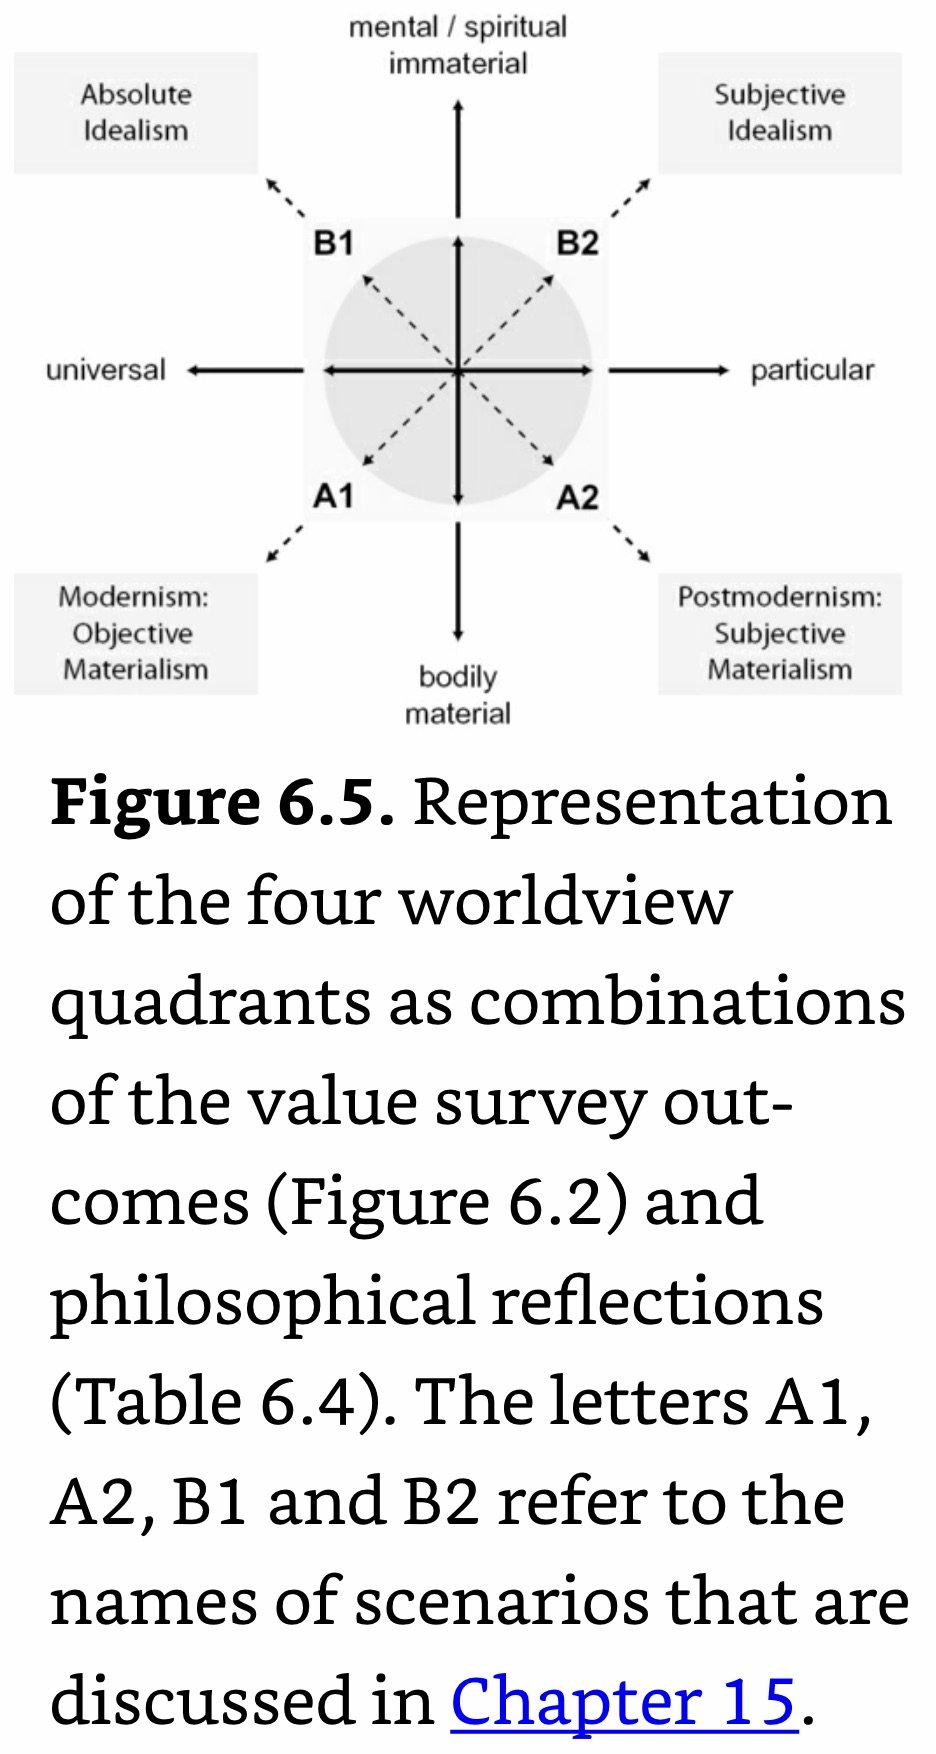
Worldview: A combination of a person's value orientation and belief system; a view on how the world is best understood.
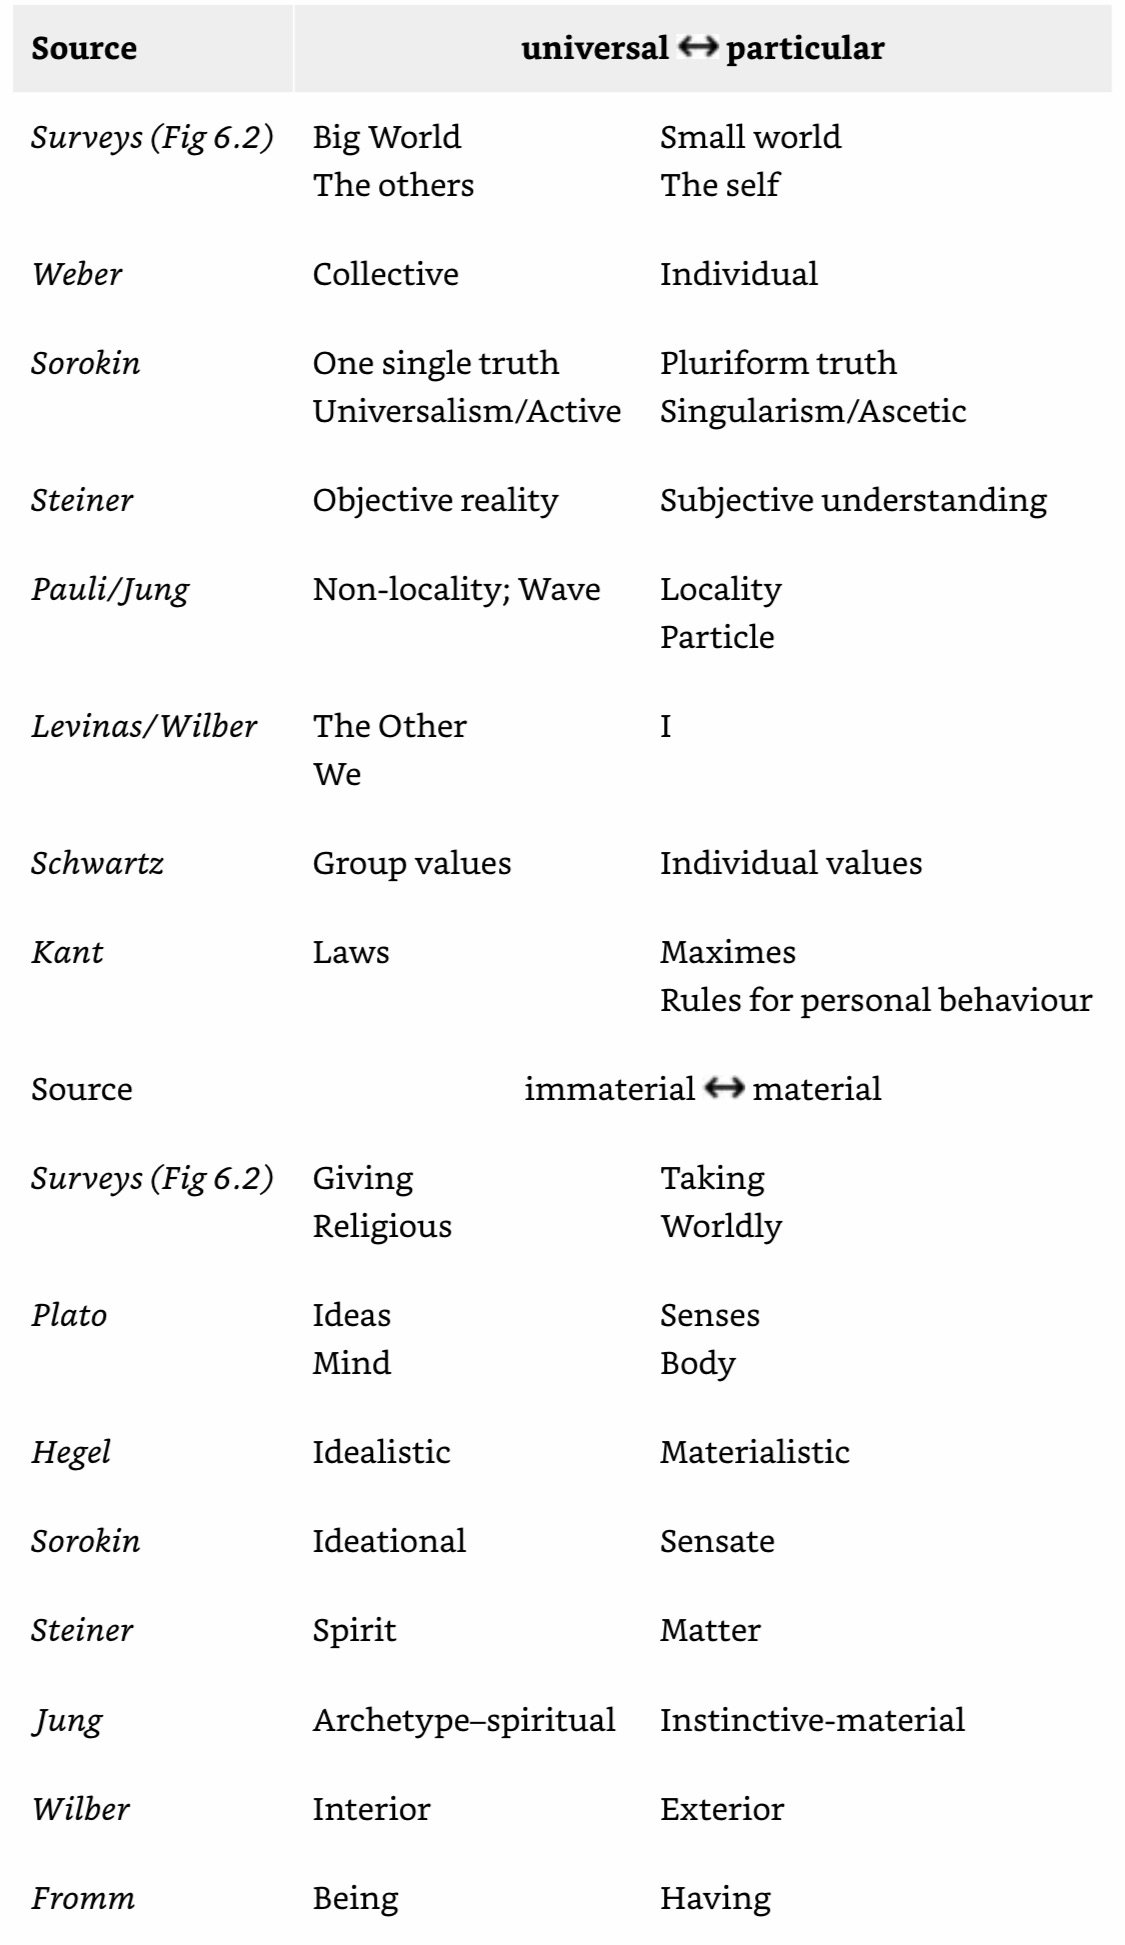
Subjective Idealism (Upper Right Quadrant): Needs are satisfied by mastery of the sensate needs, and there is a diversity in the interpretation of truth. The material world is perceived as an incarnation one has to be liberated from. Nature is experienced as divine mystery. Big government and corporations are distrusted, science is considered unacceptably rational. In concreto, the focus is on personal growth, on the ‘management of greed’ and on self-reliance and conflict resolution at the community level. The Gandhian concept of swaraj is an expression of this worldview.
Absolute Idealism (Upper Left Quadrant): A majority of society; adheres to the view that there is a universal objective truth. This Truth is not to be uncovered by personal introspection or the rational mind, but should be understood from the scriptures and consolidated in churches and religious prescripts. Its essence is immaterial and collective. The institutions are hierarchist and demand order and stability, based on uniformity and obedience.
Objective Materialism (Modernism) (Lower Left Quadrant): The dominant worldview in European and American ‘Western’ society, at least among the elites. It combines a belief in the existence of a universal objective truth with a material-secular value orientation and cosmology. The world can be understood and managed according to scientific and utilitarian principles and with the societal objective of ‘the greatest happiness for the greatest number’. In the Theory of Modernism, it is said that: ‘At the level of the individual, modernization is characterized by an increased openness to new experiences, increased independence from authority, belief in the efficacy of science, and ambitions for oneself and one's children.’
Subjective Materialism (Postmodernism) (Lower Right Quadrant): Combines a material-secular orientation on life with a focus on the individual. The belief in universal truths and the collective becomes a widening array of convictions, lifestyles and material manifestations of personal identity.
Science and technology can provide solutions for the great changes ahead. But a radical shift towards a Postmodernist worldview erodes the necessary legitimacy of science and technology to effectively introduce solutions.
One mechanism of social change is a reinforcing feedback, which tends to drive the expression of a worldview to its extreme.
It is an action-reaction mechanism that heralds large-scale social change. The more extreme the caricature of the worldview and the longer it is sustained against these forces, the more violent and catastrophic the reaction tends to be.
Conservative: A worldview that wishes to back to an imagined better past.
Progressive: A worldview that embraces a transformation into an imagined better future.
____________________________________________________________________
Ch 7: Energy Fundamentals
Initially, the steam engine was developed as a device for pumping water from coal mine shafts, which made the coal more easily accessible. In turn, the cheaper coal was used to power other steam engines, some of them propelling the ships and locomotives that transported coal to the growing number of users. This further lowered the cost and expanded the market.
The preferred values can be summarized with the keywords availability, affordability, reliability and (environmental) sustainability.
Globally, the emission of CO2 and CH4 (CH4), two important GHGs, has already led to an increase in radiative forcing and is causing, with near-certainty, changes in climate variables such as temperature and precipitation.
Organisms can be viewed as dissipative structures: Ordered objects whose structure can be maintained thanks to a steady input of high-quality energy (Chaisson, 2001).
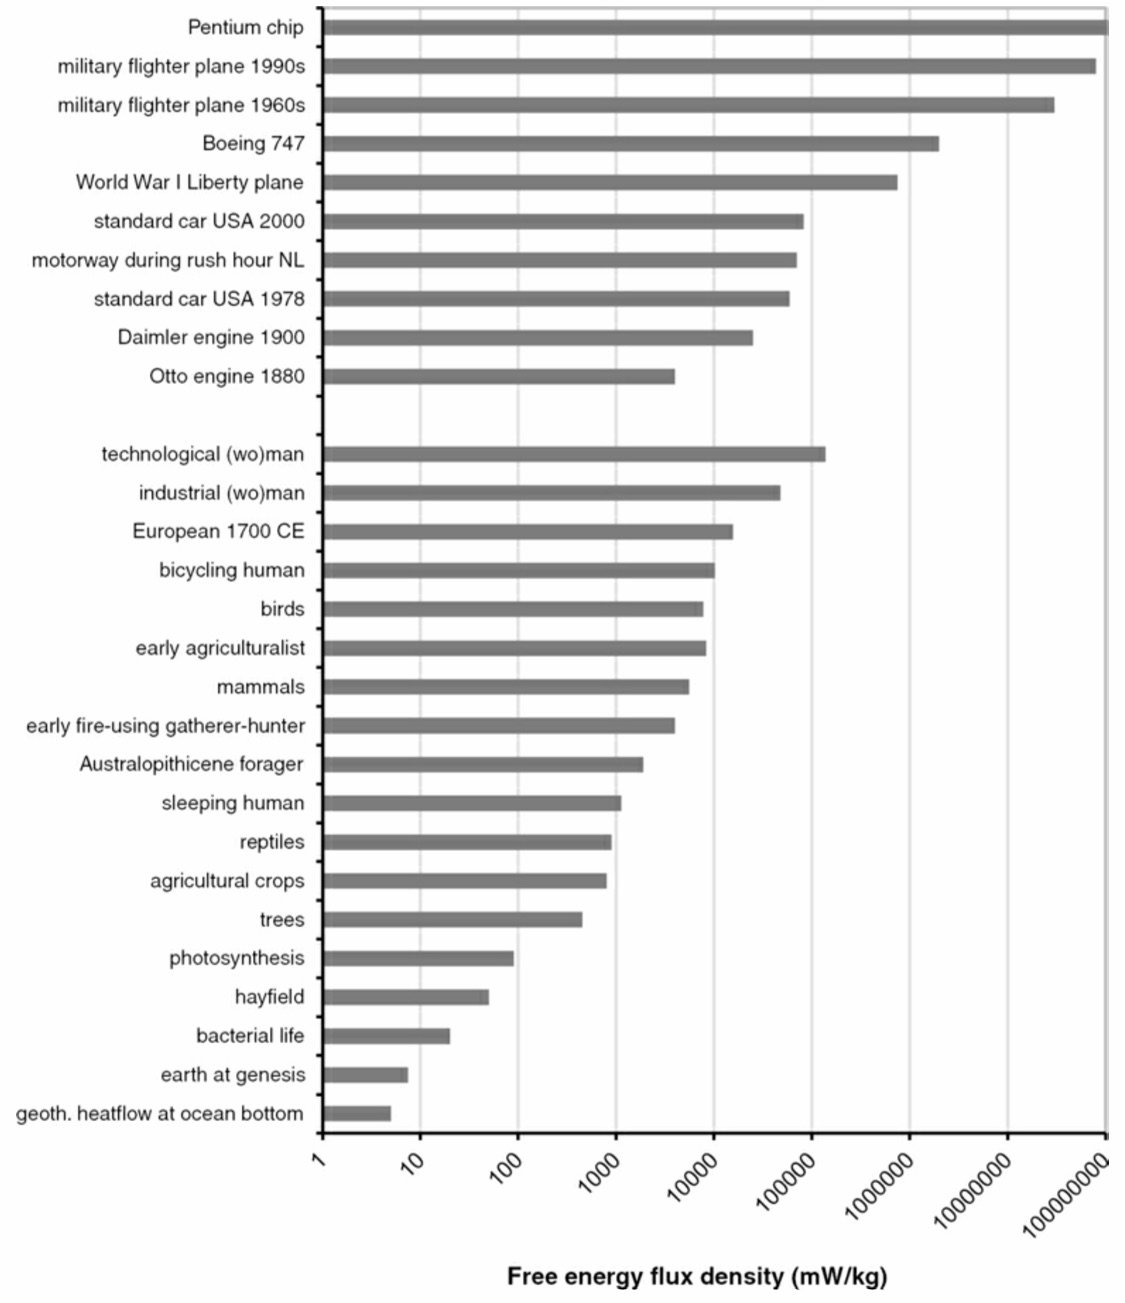
The free energy flow density (Φ) necessary to sustain a non-equilibrium structure is a measure of complexity. It can be expressed in erg per second per gram or, more commonly, in mW per kg (1 erg = 107 joule). The free energy flows are on earth supplied almost exclusively by solar radiation.
Photosynthesis: The biological mechanism to convert solar energy into chemically stored free energy (Φ0.1 W/kg-biomass).
Most animals have Φ-values in the range of 1 to 10 W/kg-biomass.
The human body dissipates free energy at a rate of about 1 W/kg-biomass, but if you are bicycling it is a factor ten higher
Thermodynamics: The study of the basic principles of heat and work flows at the macroscale or phenomenological level.
Mechanics: The study of the elementary phenomena of mass and motion.
Energy (ενεργεια (activity)-Greek): Composed of the preposition εν, in, and the word εργον work. It is a fundamental quantity of nature that is transferred between systems or parts of systems.
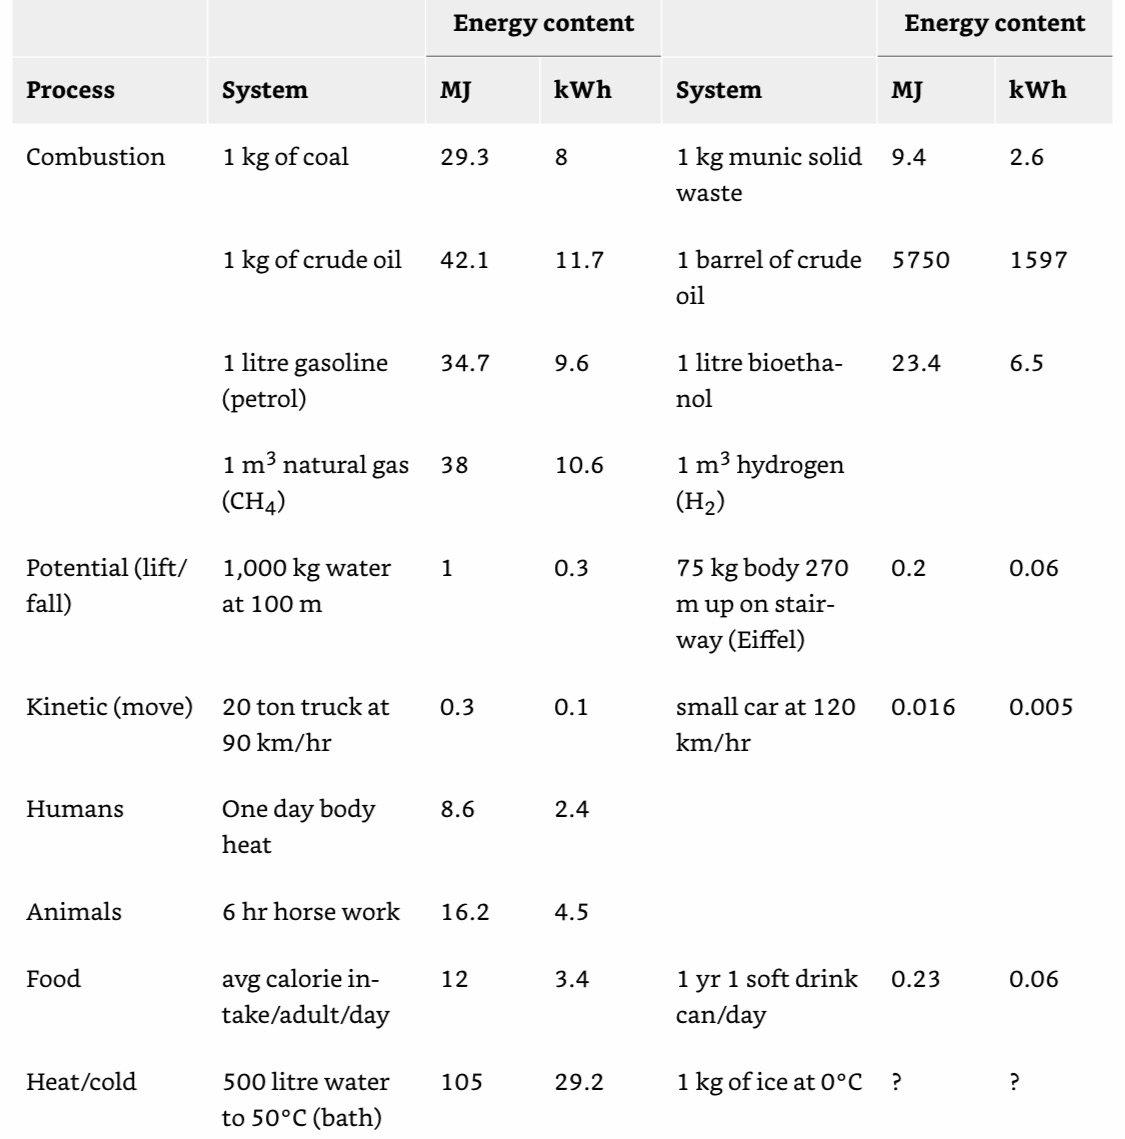
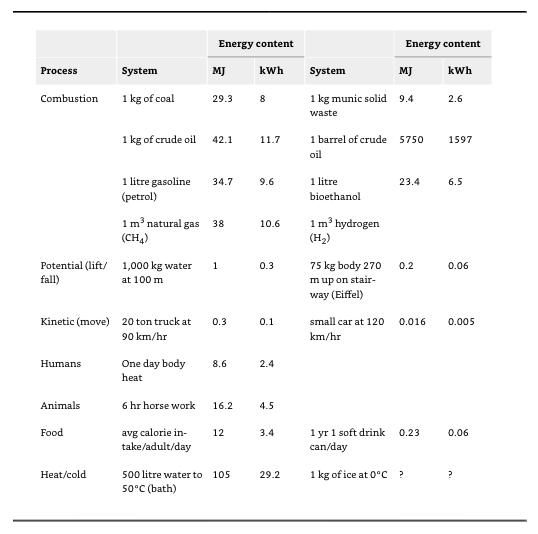
Stock: Energy stored in a system; the heat in a cup of tea, the KE in a moving car, the chemical energy in a barrel of oil. The basic unit of an energy stock or quantity is the joule (J), which is about one quarter of the traditional unit of heat or the calorie. The calorie is the amount of heat needed to heat one gram of water one degree Celsius in temperature. The joule is such a small unit that one usually measures it in thousands: kilojoule (kJ), millions: megajoule (MJ) or billions: gigajoule (GJ). For instance, the amount of energy stored in one m3 of natural gas is the equivalent of about 36,000.000 joule or 36 MJ.
Ocean water evaporates by the heat flow of the sun, a cup of tea cools down as heat energy flows into the environment and the barrel of oil is taken out of the ground in order to burn it and use the heat flow of the combustion gases. Similarly, it is the flow movement of falling water that drives the turbine. The energy flow into a system is defined as the quantity of energy that crosses the system boundary per unit of time. The basic unit of energy flow is the joule per second (J/s) or watt (W). One hour has 60 × 60 = 3,600 seconds, so if you burn one m3 of natural gas in the course of one hour, the energy flow equals 36,000,000/3,600 = 10,000 W or 10 kilowatt (kW).
Electrical Power: Measured in kilowatthour (kWh); the energy content of delivering 1 kW of energy flow during one hour (1 kWh = 3,6 MJ).
Matter and Energy in Systems
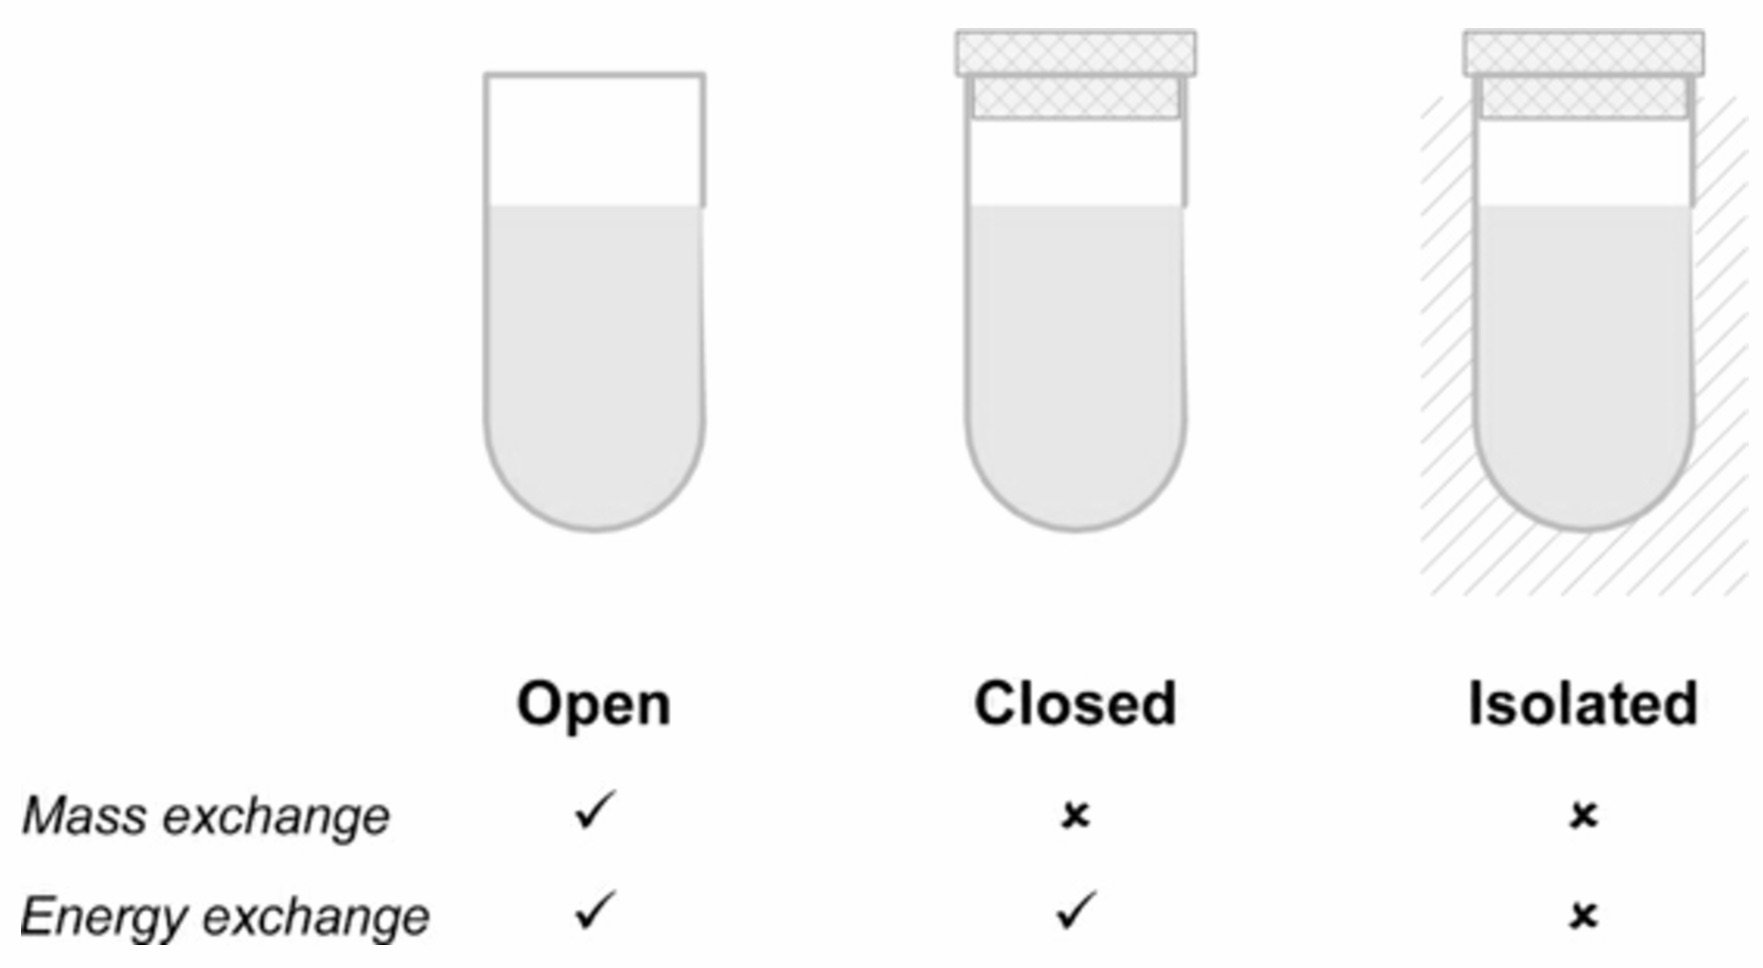
Open System: The system boundaries are permeable for energy and matter.
The mass of an open system changes if the inflow of matter into the system differs from the outflow. If both flows are equal, the system is said to be in a steady state or stationary state (dynamic equilibrium).
Closed System: The system boundaries are impermeable for matter but permeable for energy.
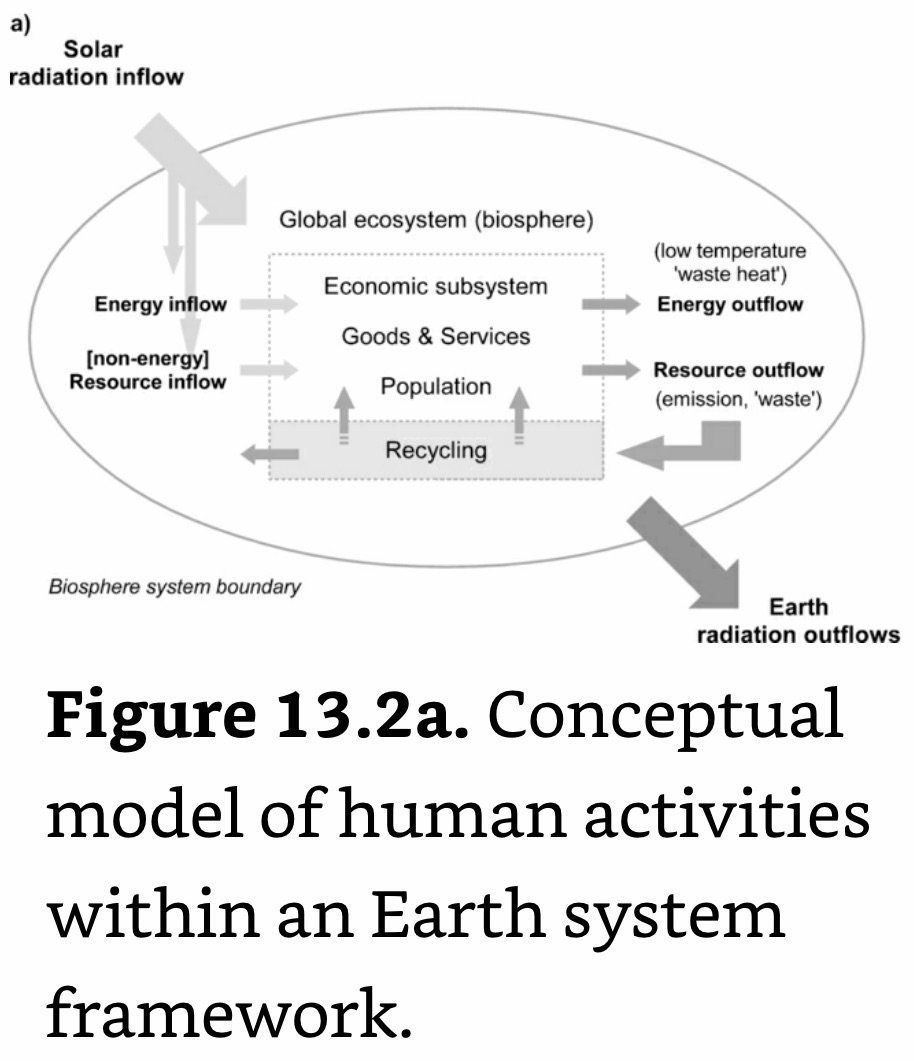
The Earth is a closed system, with a constant mass and a nearly constant solar energy inflow and equally large heat outflow.
Isolated System: The system boundaries are impermeable for energy and matter.
Thermodynamics
First Law of Thermodynamics: The conservation of energy; energy cannot be created or destroyed
Second Law of Thermodynamics: Entropy; the natural tendency towards disorder.
Nature tries to reduce the difference in intensive variables (temperature, pressure, concentration) between two (parts of) systems. It is a natural negative-feedback process.
One formulation is in the form of a state equation: a system in equilibrium is characterized by the state variables internal energy (U), entropy (S), volume (V), masses (mi), pressure (P), temperature (T) and chemical potentials (μi) for a system with i = 1…N substances.
If a state variable is proportional to the size of a system, such as U, S and V, it is an extensive variable. If it is independent of system size, such as P, T and μi, it is an intensive variable.
Entropy is proportional to the probability of microstates, that is, atomic and molecular configurations (position, momentum, mass) at the microlevel.
Mass and energy interactions take place until equilibrium is reached and the state variables no longer change.
Have you ever seen a cup of hot coffee getting hotter spontaneously or the solved sugar spontaneously reappearing as a sugar cube? How then is the order possible that we see in organisms, humans or societies? The answer is that the emergence and sustenance of such complex highly-ordered systems is only possible at the expense of an increase of disorder in the environment. Were the earth an isolated system, life would be (nearly) impossible. However, the earth is not: The solar energy influx represents an energy source from which work can be extracted before it dissipates into ambient-temperature heat – in photosynthesis and in photovoltaic cells, for instance.
Entropy change equals the heat flow at temperature T divided by the temperature plus the irreversible entropy production.
Heating air in a room with a stove is a heat transfer process. No work is involved: You simply produce a flow of heat Q from burning gas, oil, coal or wood. However, as soon as the air has a temperature higher than the ambient temperature, Nature strives to equilibrate the two – the consequence of the Second Law. Therefore, you not only heat the room but also the surroundings.
Heat transfer from the room with an average air temperature Troom to the surroundings where the air has an ambient temperature T0, is approximated by Fourier's Law.
One option is to reduce the heat conductivity k by insulating roofs, walls, floors and windows, usually called energy conservation or efficiency improvement. Another option is now widely applied and new buildings have to comply with ever stricter standards. With Δt = 1 second, the k-values are in the range of 0.11 W/m2/K for a 30 cm glasswool insulation layer to 2 and 6 W/m2/K for double and single glass windows, respectively. Innovations lead to ever-lower heat conductivity values, but it takes time before they are cost-competitive and accepted by house builders and owners.
Law of Chemical Equilibrium: Chemical equilibrium is a dynamic and not a static condition because chemical reactants change in both directions at the same speed. (Waage, 1860s).
Enthalpy: A thermodynamic quantity equivalent to the total heat content of a system. It is equal to the internal energy of the system plus the product of pressure and volume; H = E + PV. H: Specific Enthalpy (J/kg), E: Internal Energy, P: Pressure, V: Volume.
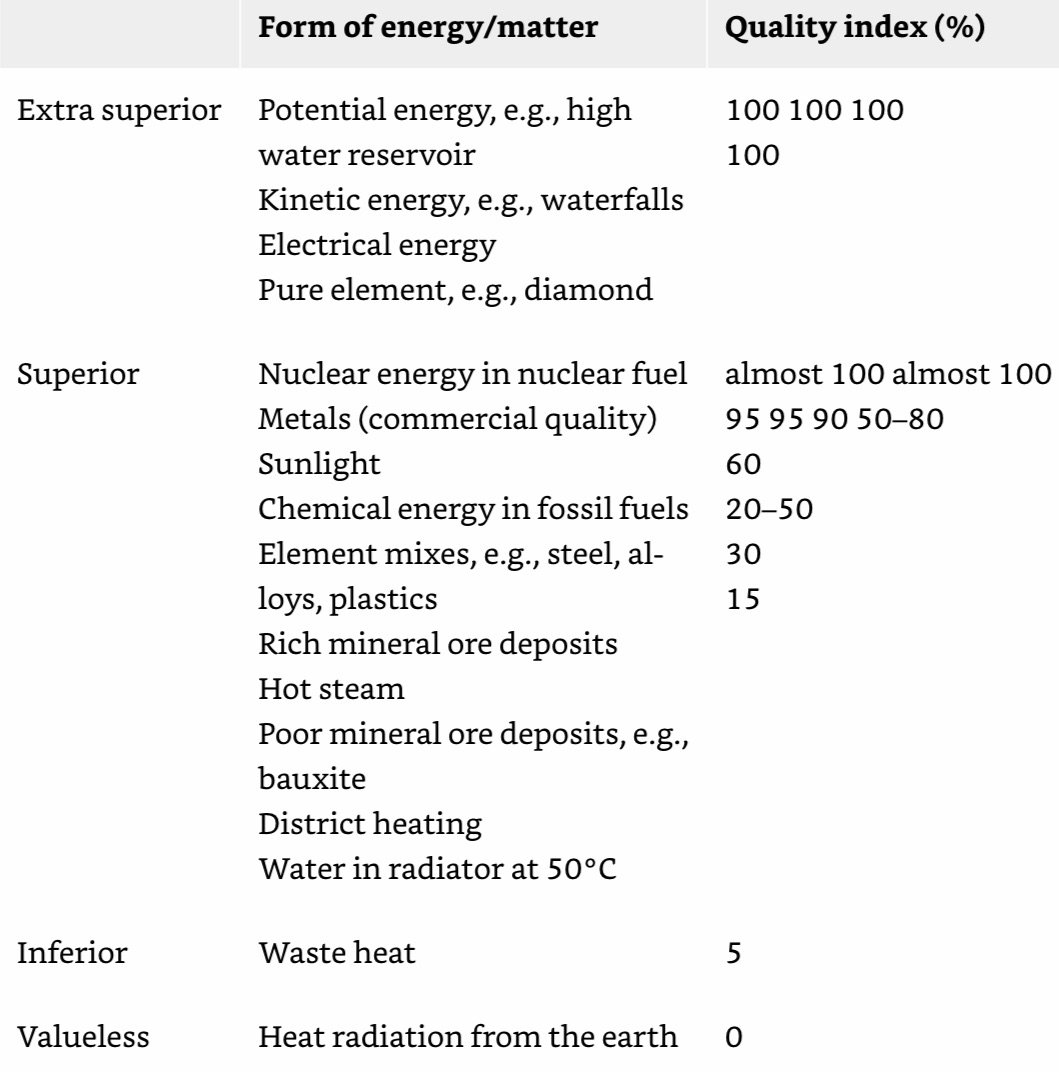
Exergy (Φ): The maximum amount of work that can be extracted from a system against a well-defined earth environment.
Understanding the causes of exergy losses and the potential for reducing those losses, that is, increasing the exergetic efficiency by extracting work from high-temperature heat, is an important part of the search for sustainable energy systems.
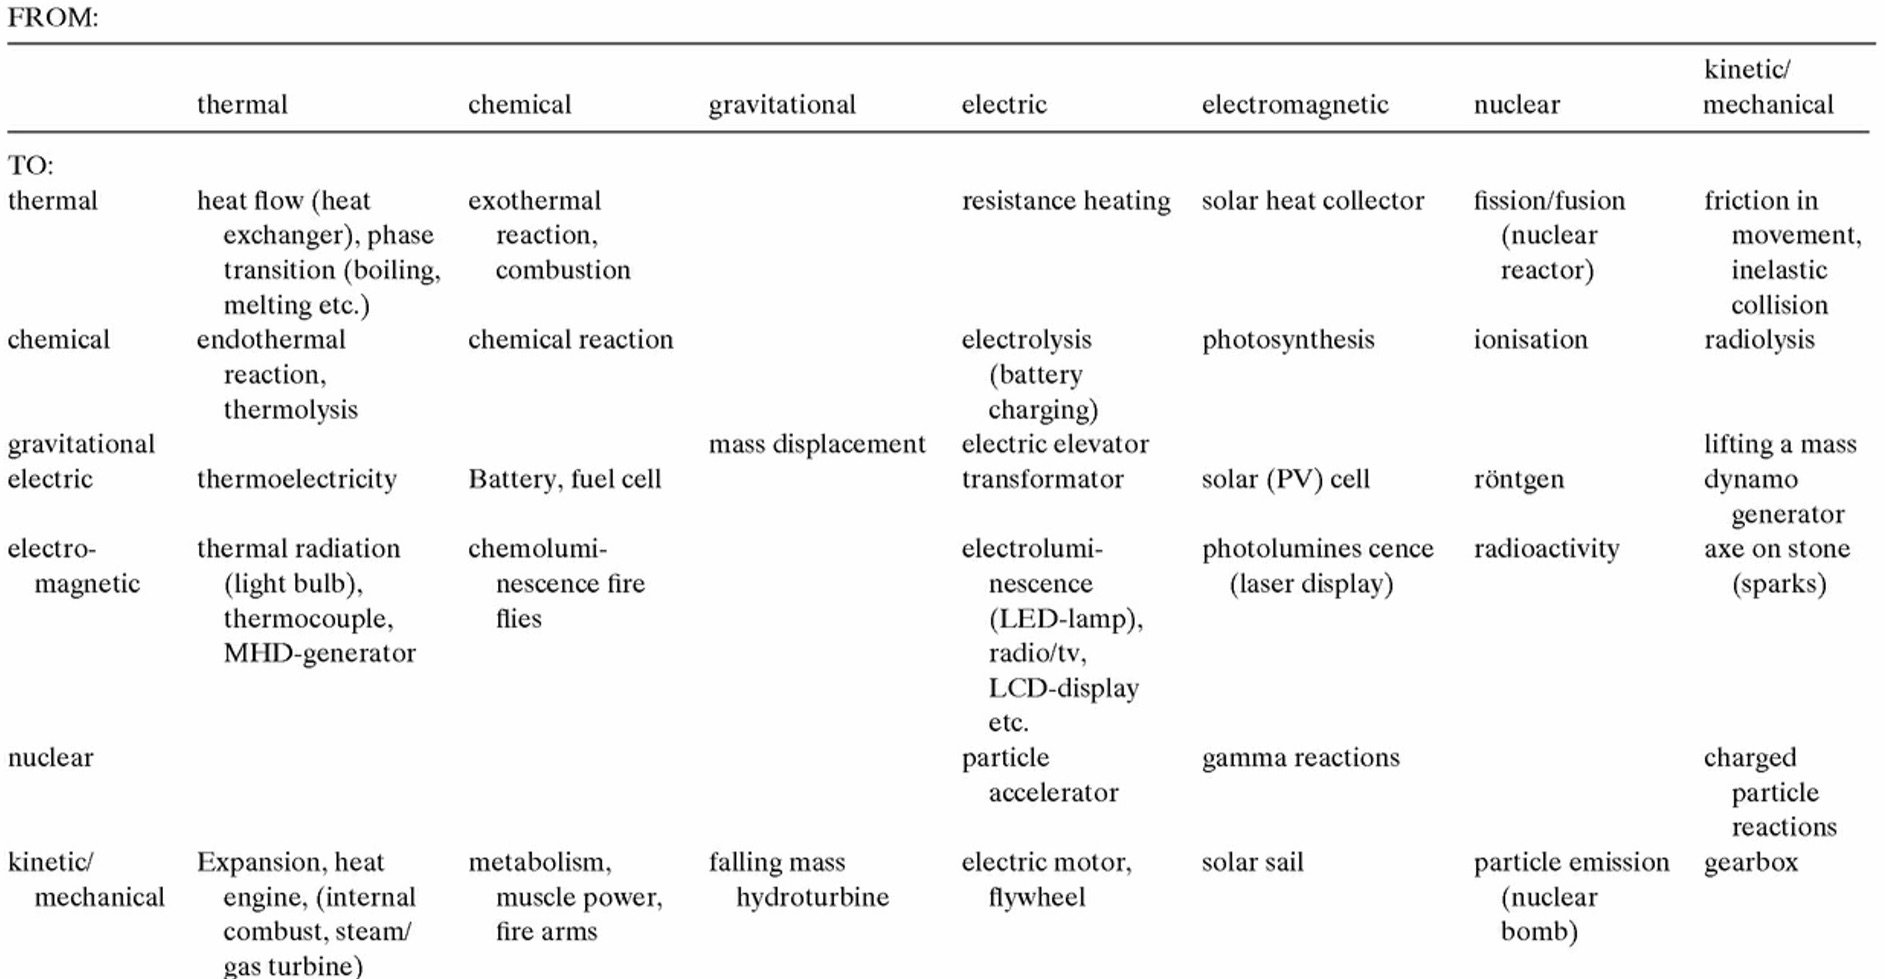
Stored Energy: Energy available in a mass or a position in a force field. Stored energy can be converted to another form of stored energy and the process takes place via transitional energy: heat Q and work W.
Internal Energy (U): Energy of the constituent atoms and molecules in the form of rotational, vibrational, translational and chemical bonding energy of atoms and molecules.
Fick's (First) Law: Substances will diffuse from areas of high concentration to low concentration.
Darcy’s Law: Water flows in an aquifer are determined by the pressure drop per unit length.
Steam and Gas Generating-Combined Cycle (STAG-CC): Large-scale electric power generation is done in Rankine-cycle operation coupled to a gasturbine.
Fuels
High Energy Density: 20–30 GJ/m3.
Solar energy fluxes with values of at most 1.2 kW/m2.
Energy/Area
Solar: In Europe, an average 100–200 W/m2 can be harnessed from the sun. With PV-solar installations, present-day installations produce in the order of 3–4 W/m2.
Wind Turbines: Offshore wind turbine parks deliver at 2–3 W/m2.
Tidal Power: Delivers ~2-3 W/m2.
Hydroelectric: Deliver up to 10 W/m2 of lake area.
____________________________________________________________________
Ch 8: On Knowledge and Models
In this chapter, the focus is on epistemological issues and ways to handle complexity and uncertainty, as these play an important role in sustainability science.
The underlying paradigm in science is that there are regularities in the world, which are manifestations of dispositions and tendencies and capacities in the particulars or ‘things’ of the material world.
Theory is derived from facts by logical reasoning.
‘The central task of natural science is to make the wonderful commonplace: to show that complexity, correctly viewed, is only a mask for simplicity; to find pattern hidden in apparent chaos’.
Mental Models: Deeply ingrained assumptions, generalizations, or even pictures or images that influence how we understand the world and how we take action.
A scientific theory becomes mature by gradually eliminating unnecessary hypotheses and sharpening the logical operations and the codifications of experience.
With economic and social systems, controlled experiments are hardly or not possible and the very experiment can alter the way the system functions.
A perspective that connects energy and complexity is offered by Tainter (2000). ‘Human societies often seem to become progressively more complex – this is, comprised of more parts, more kinds of parts, and greater integration of parts.…Every increase of complexity has a cost…The cost of supporting complexity is the energy, labour, time, or money needed to create, maintain, and replace a system that grows to have more and more parts and transactions, to support specialists, to regulate behavior so that the parts of a system all work harmoniously, and to produce and control information…No society can become more complex without increasing its consumption of high-quality energy, human labour, time, or money.’
Complex System: A system in which large networks of components with no central control and simple rules of operation give rise to complex collective behavior, sophisticated information processing, and adaptation via learning or evolution.
In this book, I use the notion of aggregate complexity in the following way: A system A is more complex than a system B, if A has: more interaction with the environment in terms of the exchange of energy and matter and thus information; a larger degree of diversity and connectedness of the system elements, both in number and nature; and a larger ability of the system elements to make representations or models of past and future actions (memory, learning, anticipation and so on).
With the study of real-world complexity, the role of uncertainty in science has become bigger and controversial: ‘…[the politicization of uncertainty leads to] scholastic disputations with the ferocity of sectarian politics. The scientific inputs…have the paradoxical property of promising objectivity and certainty by their form, but producing only greater contention by their substance’
Post-Normal Science: Developed to deal with complex science related issues. In these, typically facts are uncertain, values in dispute, stakes high, and decisions urgent, and science is applied to them in conditions that are anything but ‘normal’.
Faced with a complex reality, people often fall back on rather simple ‘rule-of-thumb’ recipes rather than on model outcomes. After all, management is often about complexity reduction, for instance, by controlling or simplifying the system and/or its environment. Therefore, in post-normal science, it is argued that for models to be relevant they need a more comprehensive assessment and participation of stakeholders.
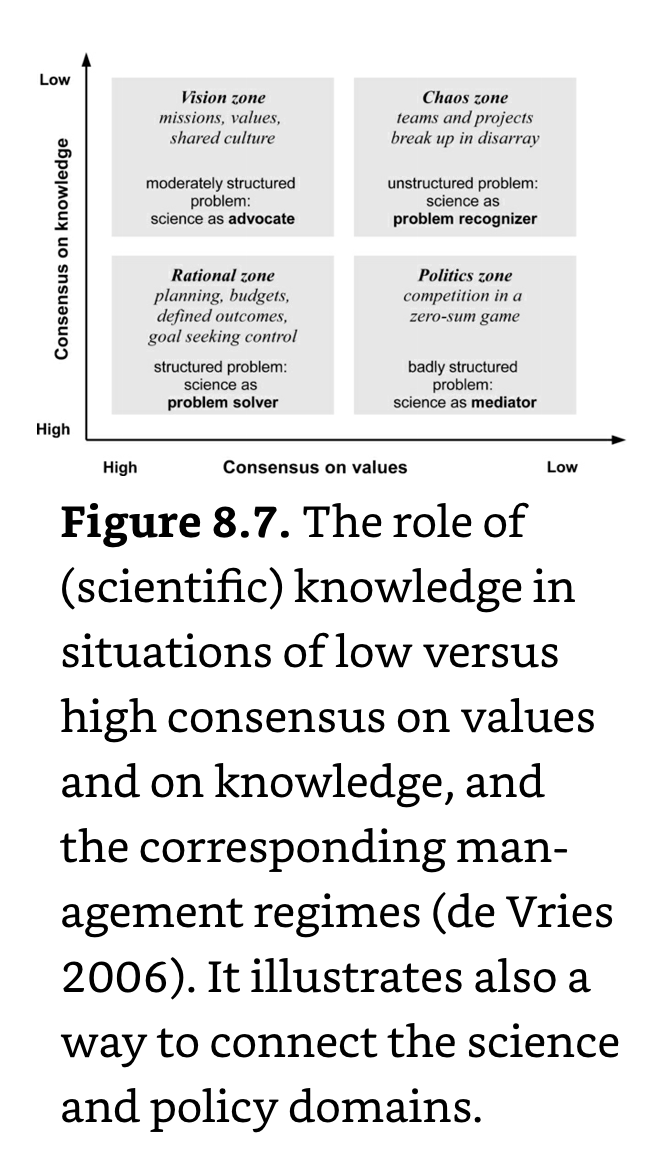
Science: Used for problem solving when there is a large consensus on knowledge and on values.
Alternative Models: Role of science when strong knowledge is not (yet) available, but agreement on values prevails.
The usual way to deal with uncertainty is statistics.
Mediation: Role of science when there is consensus on knowledge, but not on values. ‘Science’ offers practical assistance to find ‘rational’ ways of managing complexity and uncertainty.
Problem Recognition: Role of science when there is lack of consensus in both knowledge and values.
A similar scheme has been introduced by Pielke (2007). It uses two axes: One is the view of science associated with knowledge con/dissensus, and the other is the view of democracy akin to value con/dissensus. This leads to four roles for the scientist: the pure scientist (upper right), the issue advocate (lower right), the science arbiter (upper left) and the honest broker of policy options (lower left).
Model: Maps an object or item in the ‘real world’ into a formal system with formal (mathematical) rules.
____________________________________________________________________
Ch 9: Land and Nature
Ecology is still considered by many the core of sustainability science.
1947: Holdridge proposes a life zone classification system with 33 classes on the basis of 1) annual precipitation rate (rain in mm/yr) and 2) potential ET (ratio of water loss in evaporation/transpiration and precipitation).
The various classes coincide with two features mentioned before: geographical location (latitude) and elevation (altitude).
IMAGE-Model: Maps land cover and use changes in combination with GHG emissions and climate change.
Global Change Integrated Assessment Models (GC-IAMs).
In the 1960s, scientists discover that the emission of S and nitrogen oxides in countries like the UK and The NLD were acidifying the lakes in Sweden. Similarly, the dust storms in China and Africa have reached regional-scale proportions and now also affect California and Latin America.
Trésor Nature Reserve: Has three objectives- 1) protection of the biological diversity and the existing ecosystems in and nearby the park, 2) stimulation and support of scientific research in tropical systems, 3) providing botanic and environmental education by starting or contributing to educational programmes for schools and visitors.
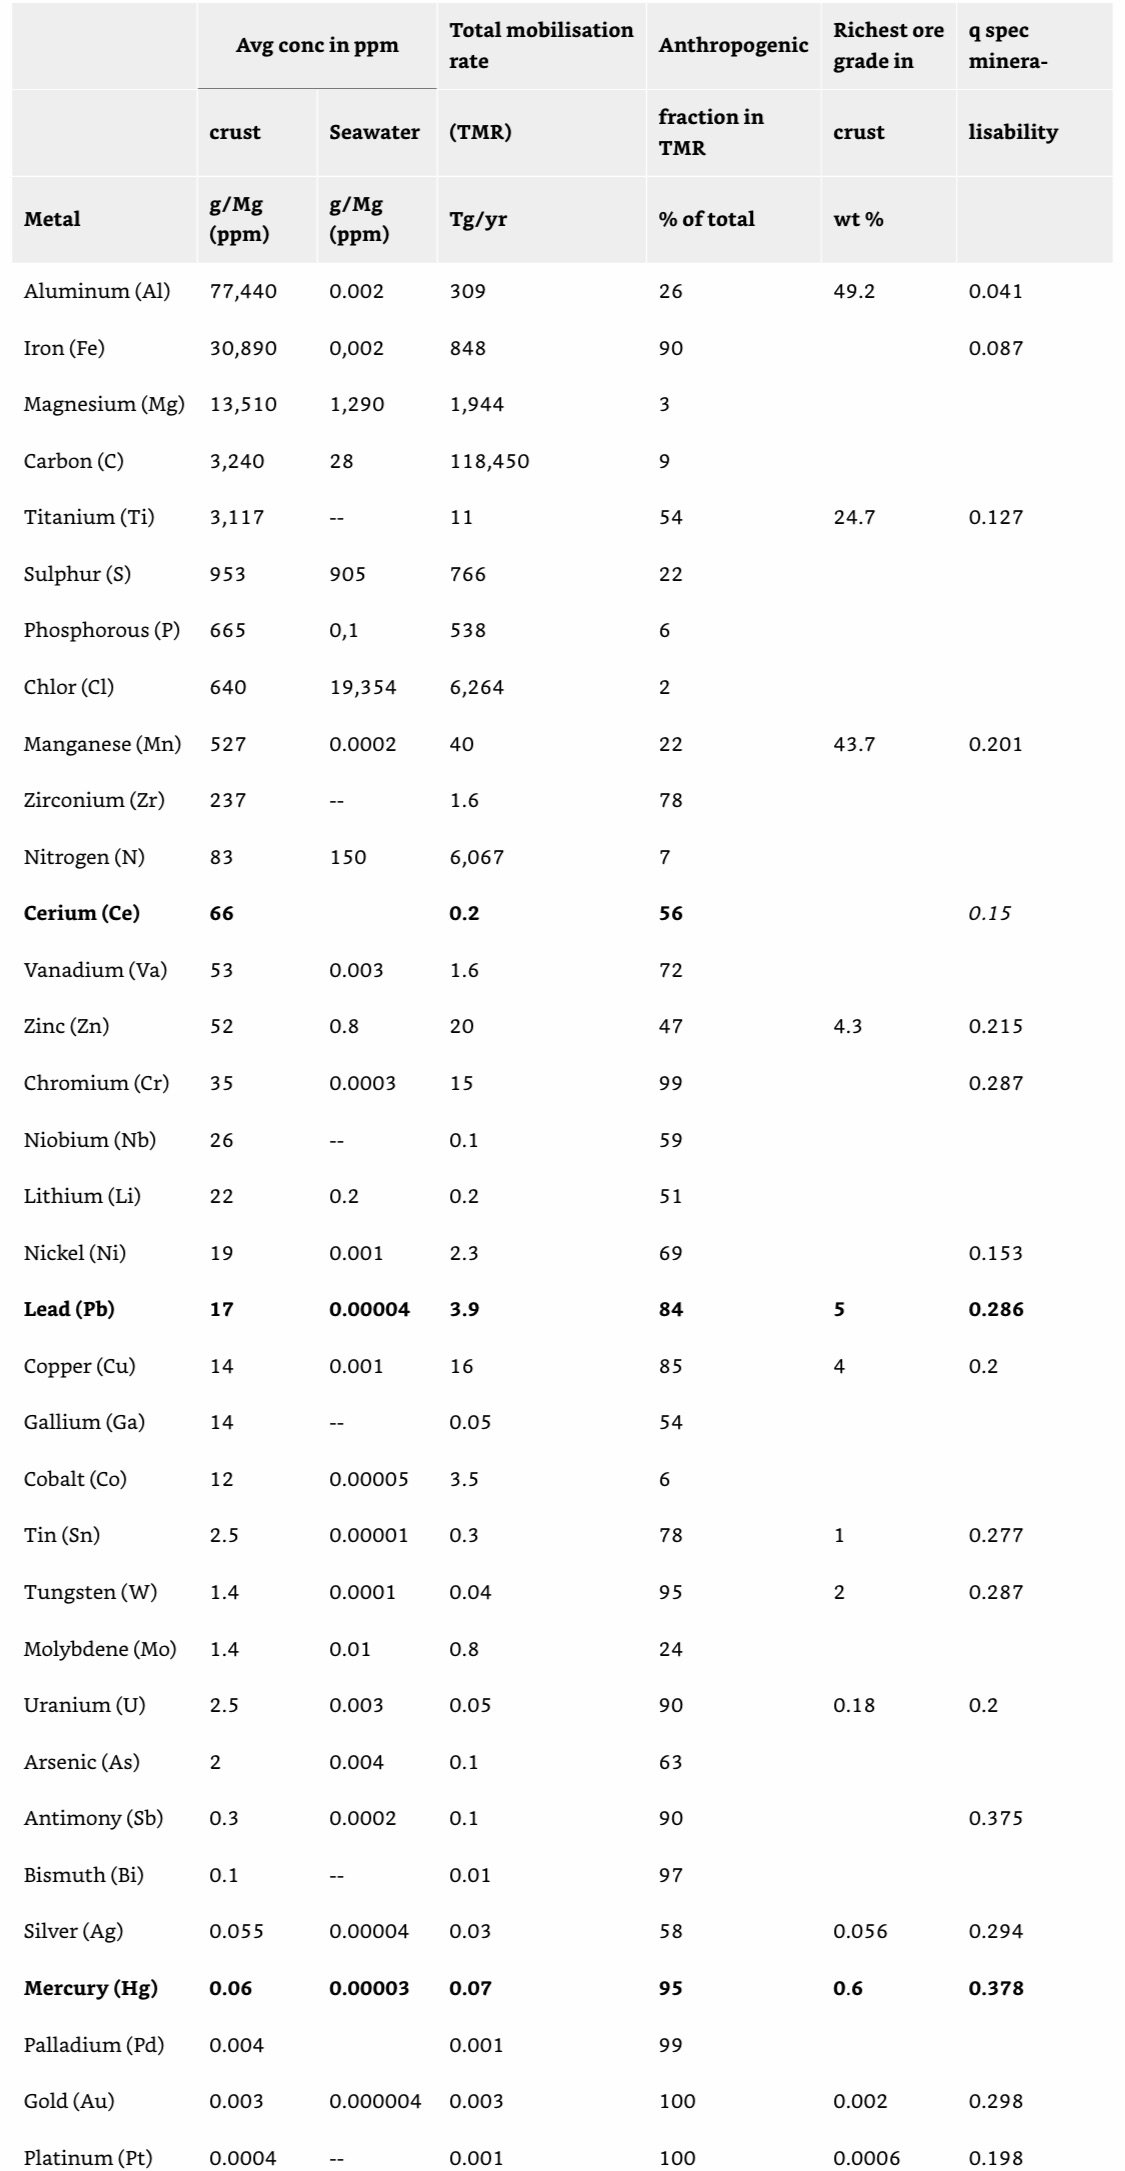
To make one gold wedding band, at least 20 tons of earth must be excavated.
Hydrologic Cycle: The system of water stocks and flows.
Desertification: A process of increasing aridity and gradual dominance of abiotic over biotic processes. Desertification has three dimensions: meteorological, ecological and human
One of the processes leading to desertification is salinization. Semi-arid and arid regions tend to be naturally salty, because ET exceeds precipitation and there is not enough water to leach out the soluble soil material. Salts from rivers and sea intrusion and atmospheric deposition are not carried away to rivers and seas and accumulates in the soil.
Land Degradation: The reduction or loss of the biological and economic productivity and complexity of terrestrial ecosystems, including soils, vegetation, other biota, and the ecological, biogeochemical and hydrological processes that operate therein, in arid and semi-arid lands, resulting from various factors including climatic variations and human activities.
A map of human-induced land degradation was made in the late 1980s by Oldeman et al. (1990) at the International Soil Reference and Information Centre (ISRIC) as part of the Global Assessment of Soil Degradation (GLASOD) project. The latter comprised deforestation, overgrazing, agricultural activities (improper agricultural management), overexploitation of vegetation (cutting for fuelwood and so on) and industrial activities (pollution). The GLASOD-analysis indicated that almost 2 Gha or 15% of the land surface was degraded, of which four-fifths was due to erosion.
Normalized Difference Vegetation Index (NDVI): A proxy-indicator of ecosystem function and productivity, which is based on satellite observations of net primary production (NPP) corrected for changes in rain-use efficiency (ratio of NPP to precipitation). Trends in the NDVI map over time are an indication of land degradation or improvement, but can unfortunately not tell anything about the kind of change happening. The results show that 24% of the global land area had suffered from a declining rain-use efficiency adjusted NDVI during the period 1981–2003.
Historically, degraded lands have mostly become stable landscapes with low productivity.
Erosion processes can be strongly modified – and usually accelerated – by human activities such as forest clearing, agriculture (ploughing, irrigation), pastoralism (grazing), dam and road construction, surface mining and urbanization.
The rather scarce field experiments confirm that intense rainfall storms and large-scale land clearing (bulldozing) are the largest contributors.
Land Degradation Solution: The (top)soil removal rate should not exceed the rate at which topsoil accumulates from natural processes.
Stochasticity: Randomness or noise – originates in processes that are not considered explicitly in the model but influence the dynamics, such as fluctuating precipitation, an extremely hot summer, a sudden disease or invasion, a social revolt, novel inventions and so
Even in a stable environment the ecological carrying capacity…is typically at least 50% more than the economic carrying capacity.’
Three fundamental types of species interaction:
Antagonistic interactions between two competitors.
Consumer-resource interactions between a predator and its prey.
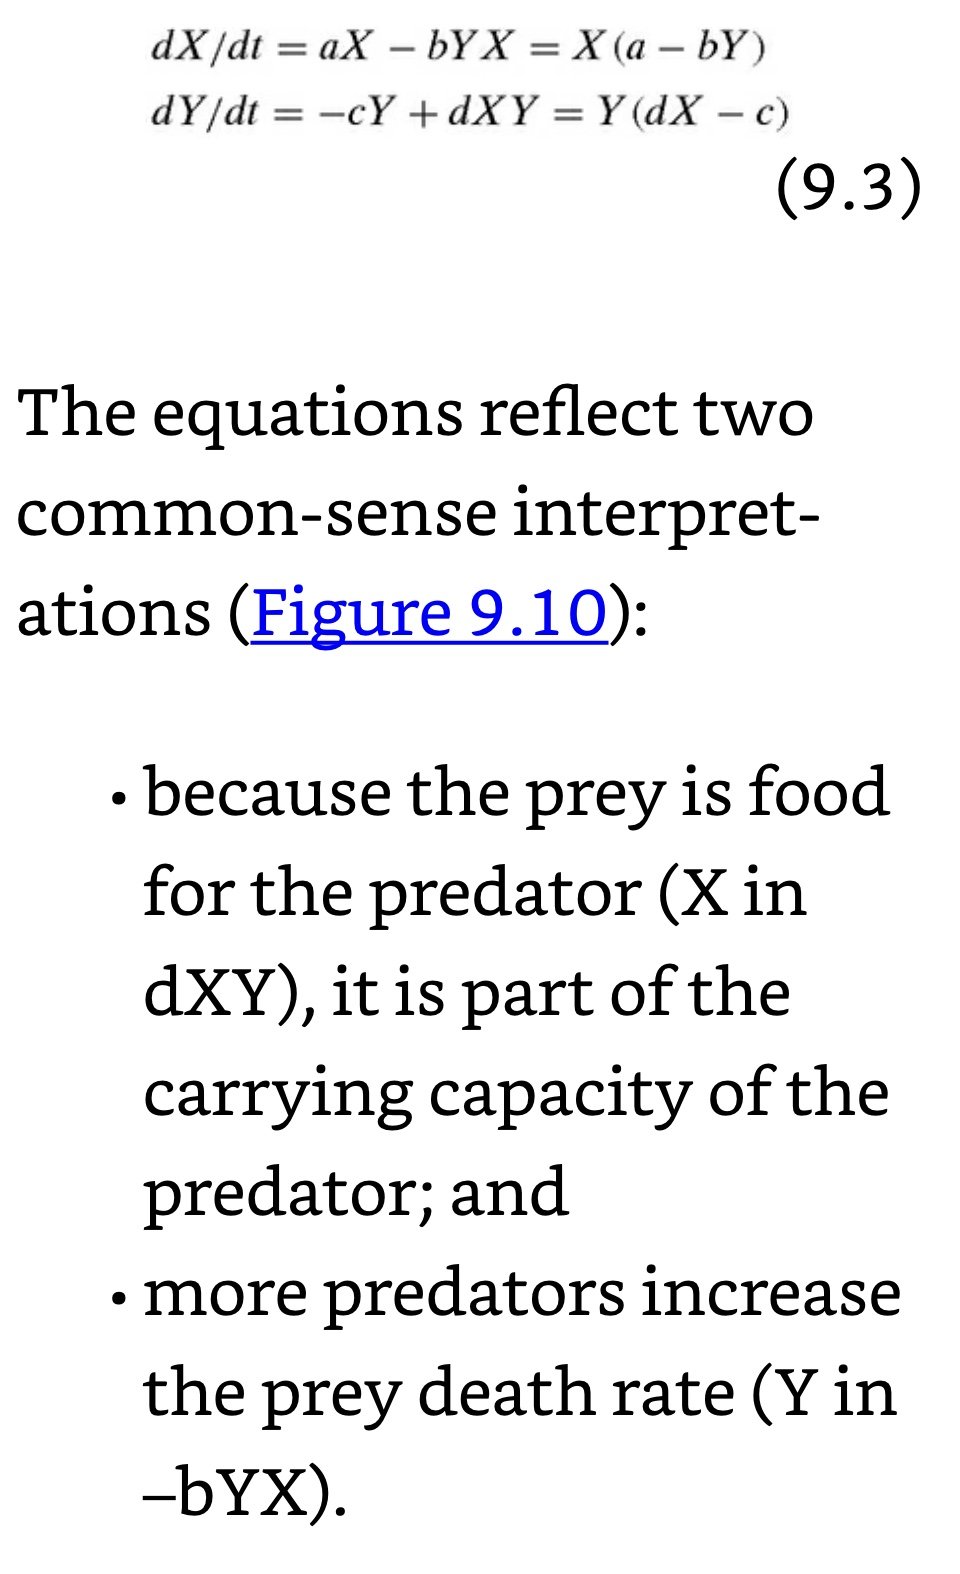
For one predator population of Y and one prey population of X individuals, you get the classical formulation given by Lotka and Volterra in the 1920s as a set of two linear differential equations:
Indirect cooperative interactions or mutualism in chains of species.
The populations in a food web sustain energy and material flows of C, N, and P amongst others through the system. The basis is formed by biomass from sunlight via photosynthesis.
Net Primary Production (NPP): A common measure for biomass via photosynthesis, expressed in t/ha.
The system is driven by the solar energy inflow, but only a tiny fraction of it, ~1.2 W/m2, is used (solar radiation is in the order of an average 100 W/m2).
The larger part of this energy flow (the 1.2 W/m2) is already dissipated, like that used for metabolism, at the lowest level of the primary producers.
Community complexity apparently buffers against perturbations, when environmental heterogeneity creates subsystems (compartments) that permit higher-level species to do adaptive foraging that stabilizes a system.
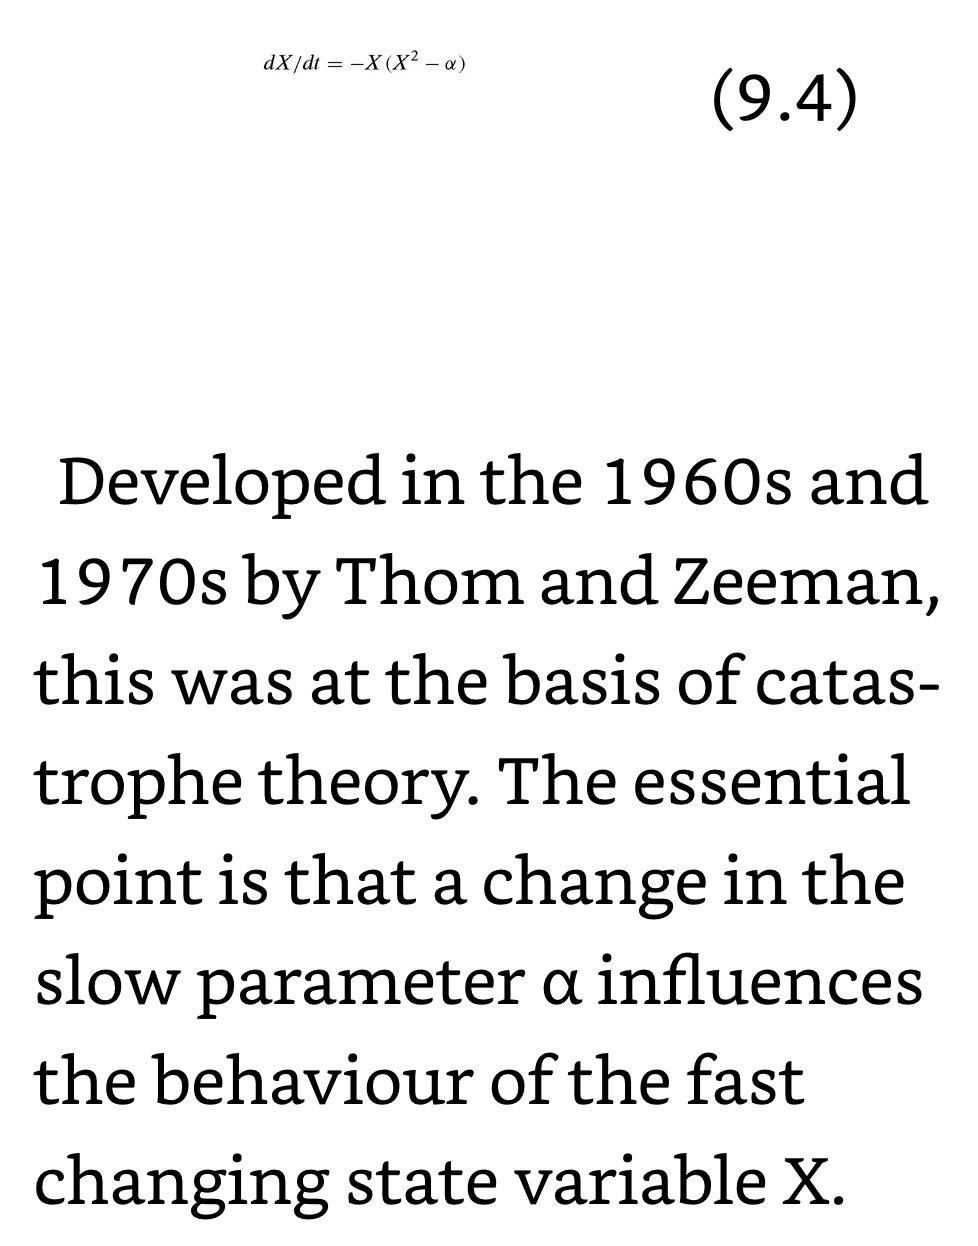
Tipping Point: Nonlinear phenomena that induce an effect of a change that is not proportional to the change but, at a certain point, superproportional or catastrophic.
Stability of a system is the condition that it a) stays essentially unchanged (constancy); b) persists through time (persistence); and c) returns to the reference state (or dynamic) after a temporary disturbance (reversibility).
Resilience: The ability to preserve identity under external perturbations or disturbances and to return to the original structure when the perturbation or disturbance is over. Measured as resistance to disturbance and speed of return to equilibrium.
Engineering resilience focuses on efficiency, control, constancy, and predictability – all attributes at the core of desires for fail-safe design and optimal performance. Such a desire is appropriate for systems with low uncertainty in a largely controlled environment.
Ecological resilience focuses on persistence, adaptiveness, variability, and unpredictability – attributes embraced from an evolutionary or developmental perspective.
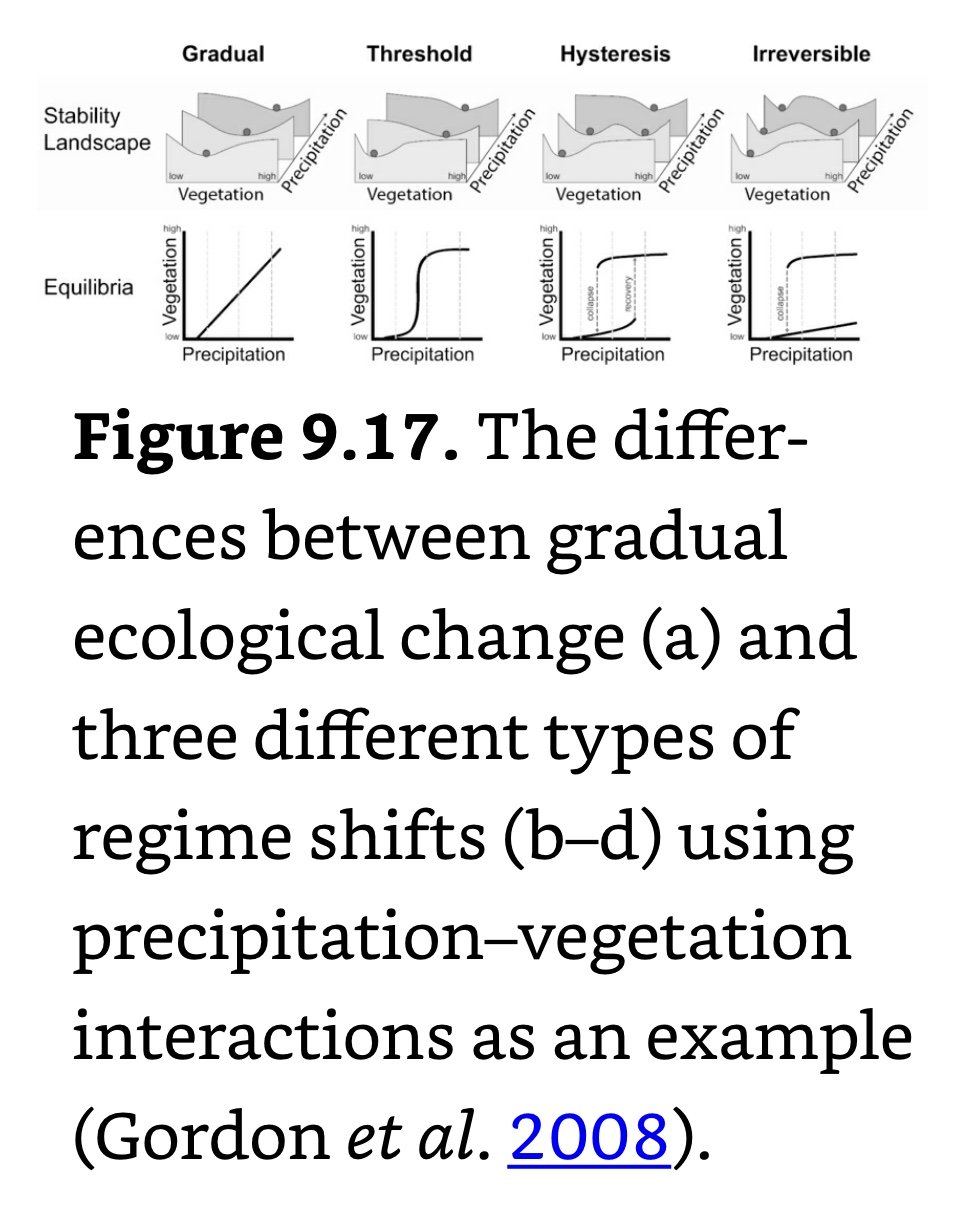
Resilience is now measured by the magnitude of disturbance that can be absorbed before the system undergoes a structural change, which is in a mathematical sense the shift from one attractor basin to another (‘regime shift’).
Ecologists consider the maximum amplitude of disturbance that still allows the system to return to the attractor basin as an indicator. This notion of resilience is also penetrating the social sciences, where it is associated with the capacity of institutions to adjust to perturbations.
It is possible that ‘latent’ energy is built up endogenously in the system, which is suddenly released.
Food Web: ‘The central theme of food web research is the understanding of structure, function, dynamics, and complexity…this task will determine in part the management of our ecosystems towards sustainability.’
R-Species (R-Strategists): First exploitative phase species that have extensive dispersal ability and rapid growth in a ‘winner-takes-it-all’ competitive environment.
K-Species (K-strategists): Second conservative phase species with slower growth rates and more elaborate forms of competition.
Eutrophication: An influx of nutrients from inflowing fertilizer and wastewater and industrial effluent cause a growth of phytoplankton. This causes bottom plants to disappear as they get less or no light, which makes the lake look greenish and turbid. Also, small animals living on the bottom vegetation die off, several fish species disappear and a monotonous community is what remains. Bird populations visiting the lake drop by an order of magnitude.
Turbidity is the slow-changing variable, nutrient concentration the fast variable and there are two branches of stable equilibria: One with low and one with high turbidity-nutrient levels that partly overlap
A clear lake with bottom vegetation will become more turbid as nutrient concentration rises, until a certain threshold is reached – the critical turbidity. At this point, the bottom vegetation collapses and the system jumps to the upper branch without vegetation and high turbidity.
Several indicators are used to represent the state of biodiversity and its change:
Biome Extent: The biome area according to climatic and geographical potential minus agri/urban areas and forest plantations.
Mean Species Abundance (MSA): The ratio of actual and potential species composition and abundance.
Ecosystem Service: The capacity of an ecosystem to provide goods and services that satisfy human needs.
The most comprehensive and authoritative assessments of the world's ecosystems and their services is the Millennium Ecosystem Assessment (MA) published in 2005 after four years of researching, assessing and describing by hundreds of scientists all over the world.
Services can be grouped in a few classes: supporting: nutrient cycling, soil formation, primary production and so on; provisioning: food, fresh water, wood and fiber, fuel, medicine, genetic material; regulating: climate regulation, carbon sequestration, erosion and sedimentation control, pollination, biological nitrogen fixation, disease regulation, water purification, storm and flood protection; and cultural: aesthetic, spiritual, educational, recreational.
The changes made to ecosystems have contributed to substantial gains in human well-being and economic development, but these gains have been achieved at growing costs.
As part of the modern capitalist market economy, the idea has spread that only by accounting for such functions in economic/monetary terms will induce the necessary prudence.
By ascribing ‘services’ to ecosystems in monetary terms, one makes the average citizen aware of these processes and their precious role for many societal processes – or so it is thought. But such ‘monetization’ of nature is still controversial, if only because it is hard to define and value those services adequately.
____________________________________________________________________
Ch 10: Human Populations and Human Behavior
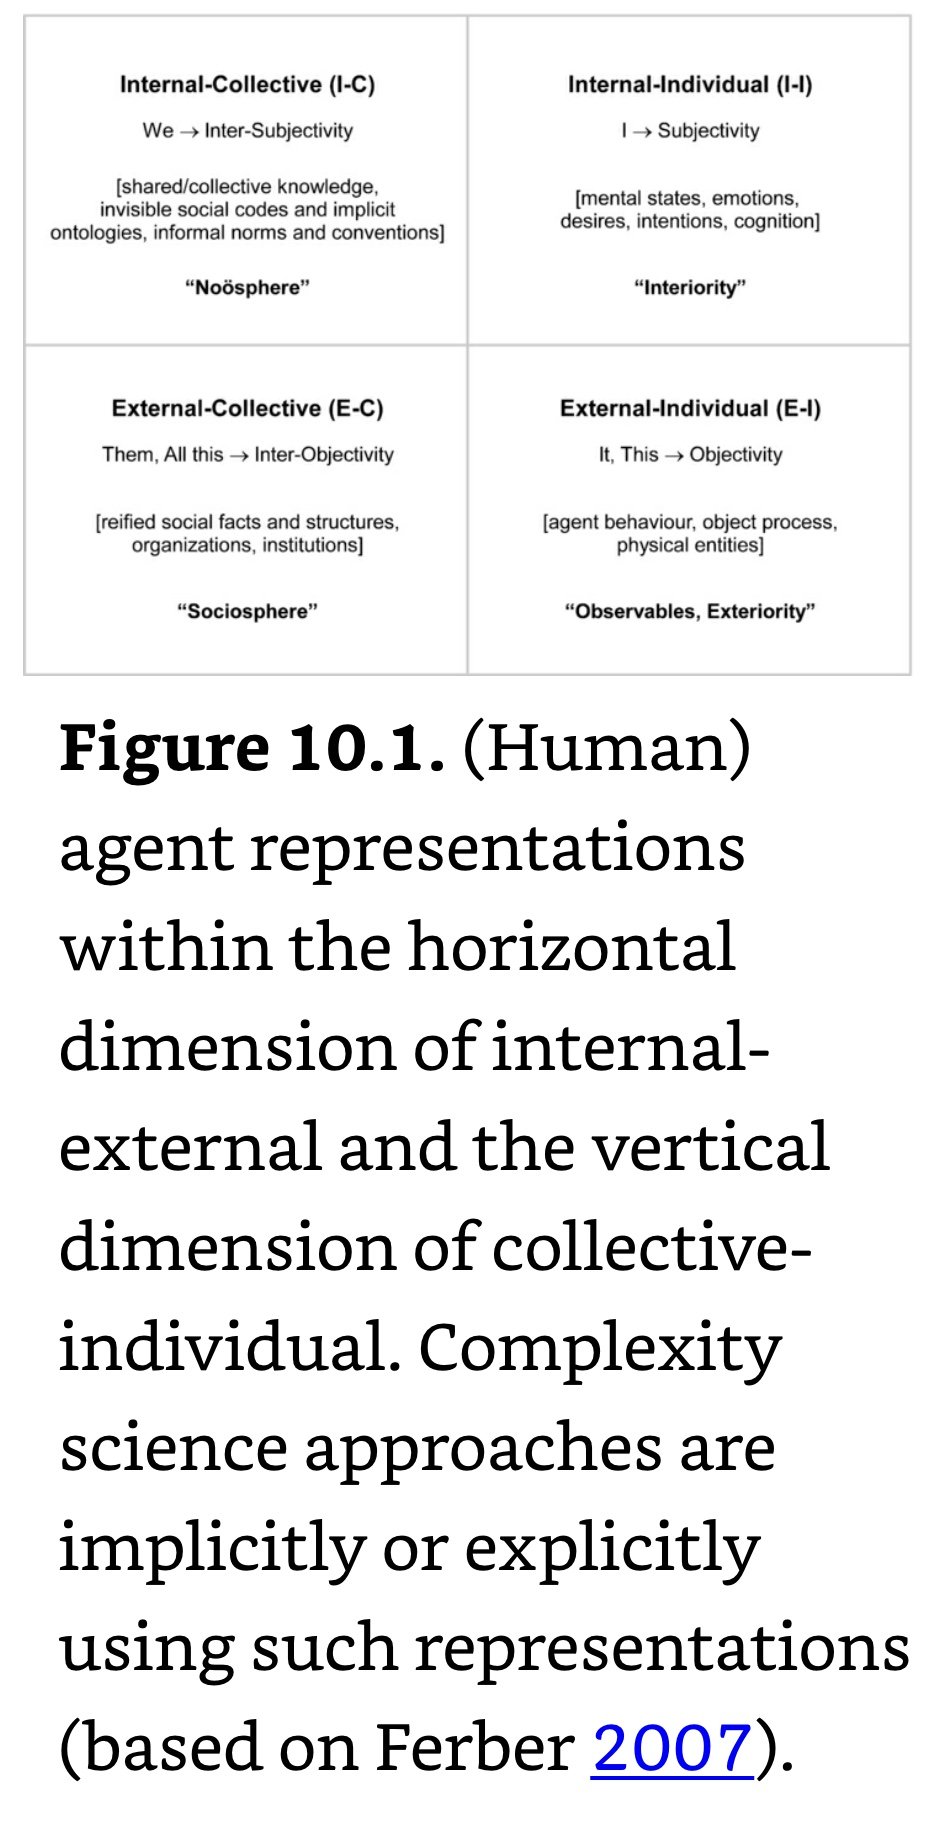
4-Quadrant Framework for Artificial Intelligence: Two dimensions are distinguished: external versus internal and individual versus collective.
Horizontal Dimension: Whether a person is primarily seen and modelled as an individual in (relative) isolation, or as part of a larger group with mutual interactions (tribe, network or society).
Vertical Dimension: The degree to which the focus of description is on external observable behavior or on internal mental processes (memory, imagination or anticipation).
E-I Domain (Lower Right Quadrant): Empirical reductionism, where lab experiments with animals or peoples gives objective scientific results and ‘strong’ knowledge.
I-I Domain (Upper Right Quadrant): The domain of psychology as well as of the esoteric and spiritual.
E-C Domain (Lower Left Quadrant): The domain of social sciences; individual animals and human beings are never isolated.
E-C Domain (Upper Left Quadrant): Because human beings are both (self-)conscious individuals and members of collectives, such structures become internalized in the form of collectively shared social codes and ideas. It is here that the intangible and complex elements of cultures, religions and ethics reside. In the university, philosophy and the humanities are closest to this quadrant.
Population
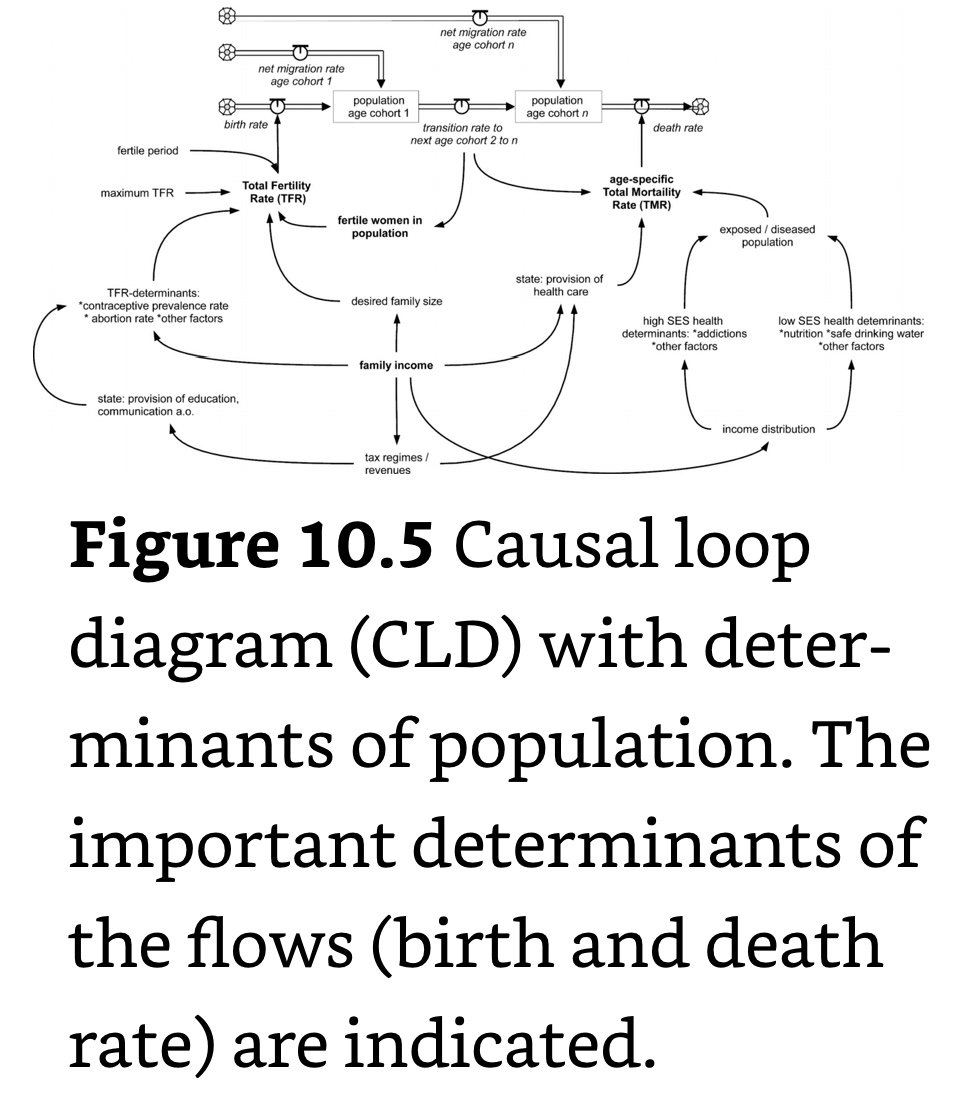
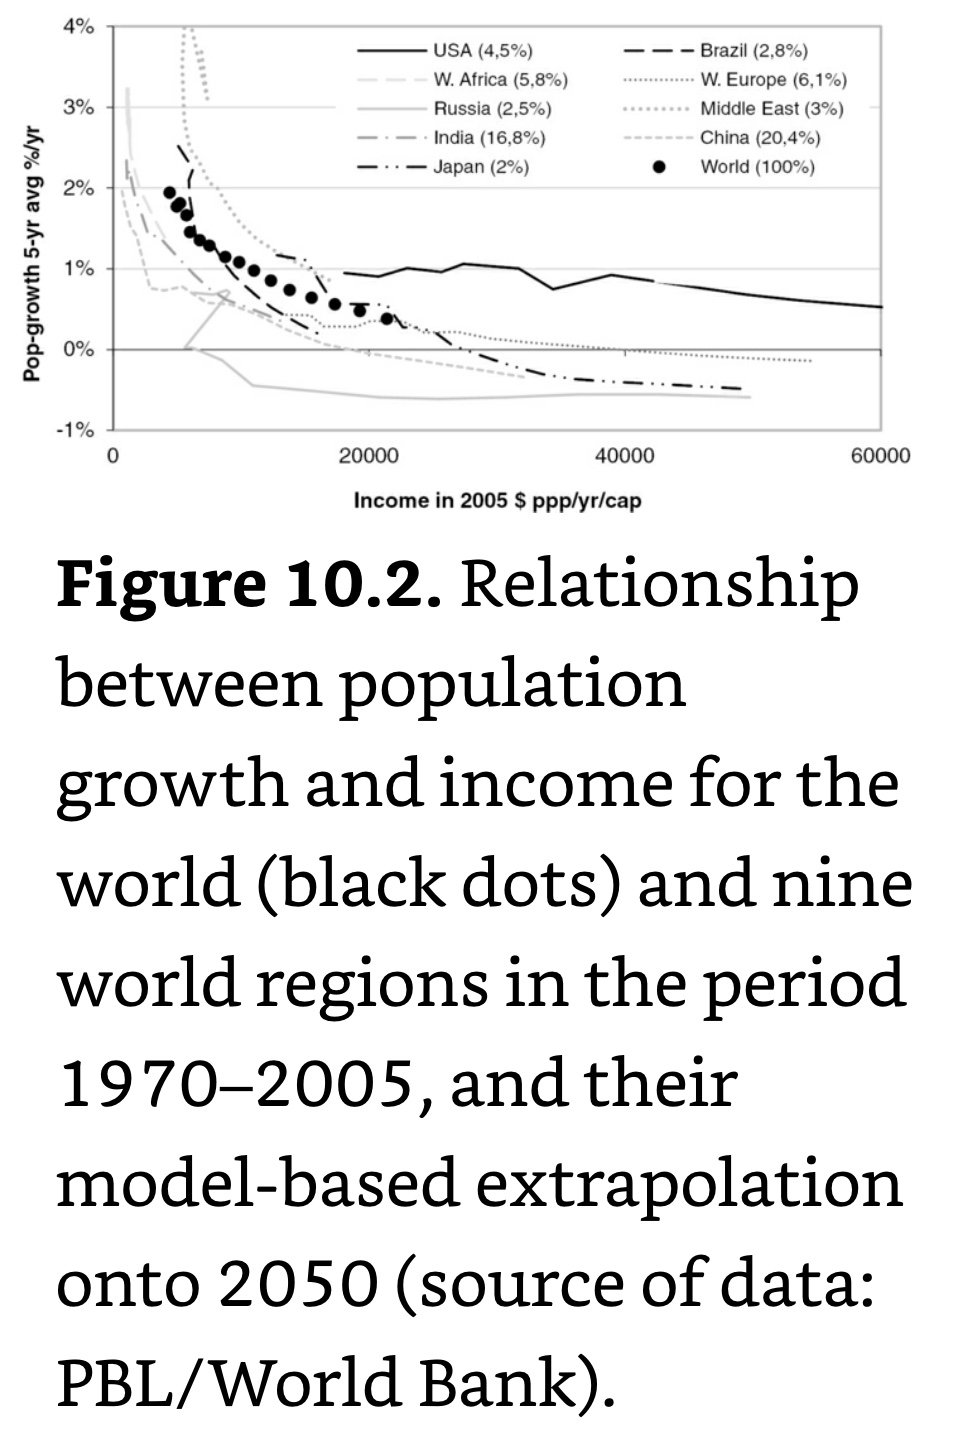
At the regional level, the net population change rate declines exponentially with income.
Crude Birth Rate (CBR): The number of births per 1,000 persons in a given year.
Fertility Rate: The expected number of children born per woman during her lifetime.
Demographic Transition: The transition from an equilibrium situation with high birth and death rates (stage I) to another equilibrium situation with low birth and death rates (stage III).
Total Fecundity: The potential number of children women can have.
The number of births mainly depends on the potential number of children women can have (total fecundity), the rate of marriage, and the degree to which contraception and induced abortion are applied.
Women's levels of educational attainment turn out to have an especially strong effect on fertility in particular, more even than men's education levels or other characteristics of households such as wealth.
Six countries with strong son preference – Bangladesh, Egypt, India, Nepal, Pakistan and Turkey.
With increasing education and continuing modernization, son preference seems to fade away gradually.
Life Expectancy
Disability Adjusted Life Years (DALY): The sum of the # years lived with a disease and the # years lost by premature death. The DALY has become the measure of the burden of disease in a population. The main risk factors from which the DALYs are estimated are poverty- and environment-related risks in poor countries and welfare-related risks in rich countries.
in Africa, childhood and maternal undernutrition account for more than 40% of all attributable DALYs. In rich countries, welfare-related risks prevail. In Europe, addictive substances (such as tobacco and alcohol) and diet-related and physical inactivity factors (such as blood pressure and obesity) are responsible for the larger part of health losses.
Evolution: The two essential principles of evolution theory:
1) Natural selection on randomly generated, small variations in individuals is the major mechanism of evolutionary change and adaptation.
2) Macroscopic phenomena are understood by microscopic processes of gene variation and natural selection.
‘The theory of evolution by cumulative natural selection is the only theory we know of that is in principle capable of explaining the existence of organized complexity.’
Collective Action: Most environmental issues are collective-action problems. To solve such problems, social pressure and coercion are supposedly effective because people care about their reputation: shame works, and public shaming in combination with other incentives may force cooperation.
Time Preference: People value the present more than the future.
Satisficing: Looking for adequate and not for optimal strategies in everyday decision making.
Game Theory: Analyses the strategic interactions between individual agents: How do people interact? The most elementary device in game theory is the pay-off matrix. It gives the costs and benefits for an agent of two or more possible actions in an interaction with one or more other agents.
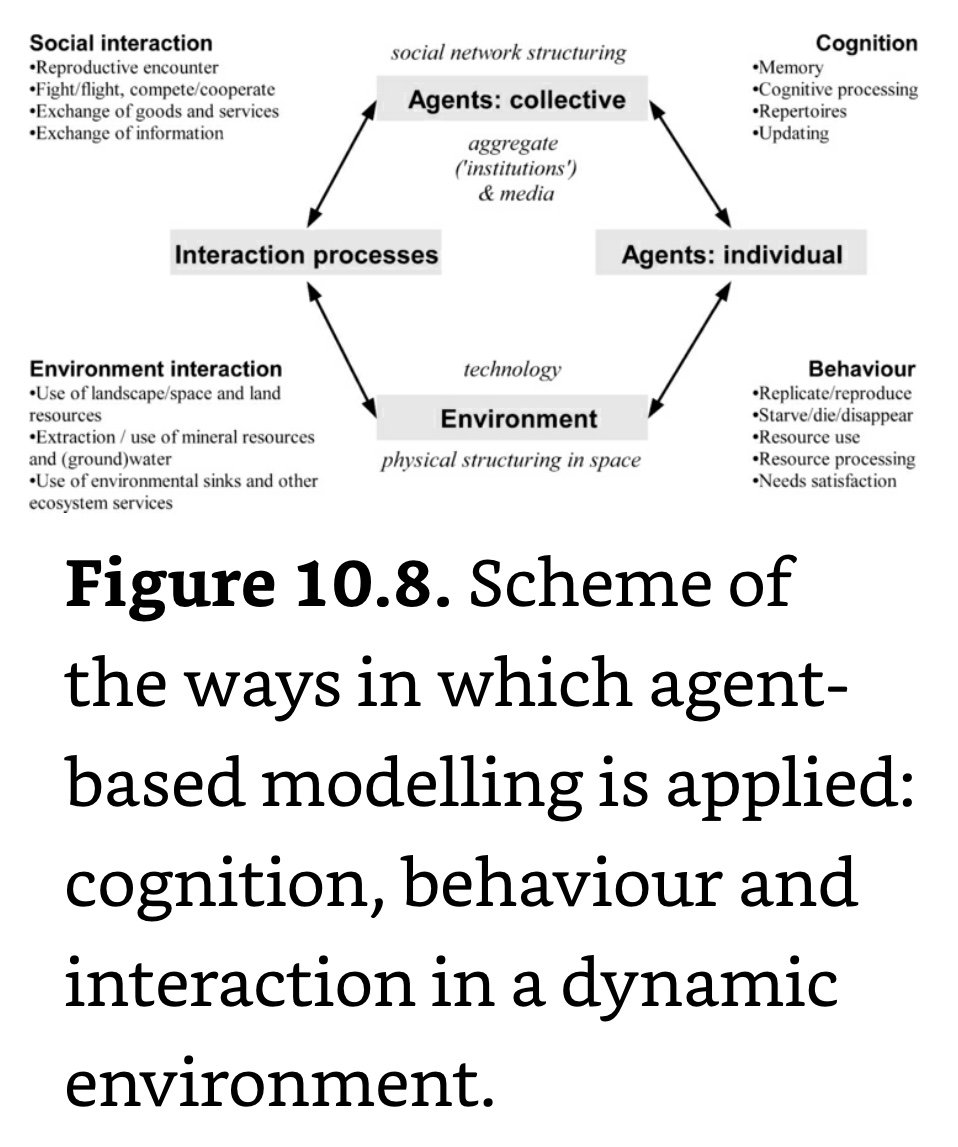
Agent: A model entity which can represent animals, people or organizations; can be reactive or proactive; may sensor the environment; communicate with other agents; learn, remember, move and have emotions.
Money, Ideology, Comprised-Prone, Ego (MICE): The FBI’s four possible motives for persons qualifying as a spy.
Face-to-face communication produces substantial increases in cooperation; individuals who believe that others will cooperate in social dilemmas are more likely to cooperate themselves; learning to play the game also matters.
The availability of a sanctioning mechanism (punishment or reward) tends to change individuals who are initially the least trusting into strong cooperators.
18c: The corporation is invented in Britain. It ‘separated ownership from management – one group of people, directors and managers, ran the firm, while another group, shareholders, owned it…[Its] genius as a business form was – and is – its capacity to combine the capital, and thus the economic power, of unlimited numbers of people’
Network theory has shown that in a network where every vertex is connected to its two neighbors, only a few additional random connections bring forth the ‘small-world phenomenon’ (Watts (1999)). A few shortcuts do shrink the world dramatically. In other words, a few species or persons can make a huge difference in overall connectivity and hence function and performance of a system.
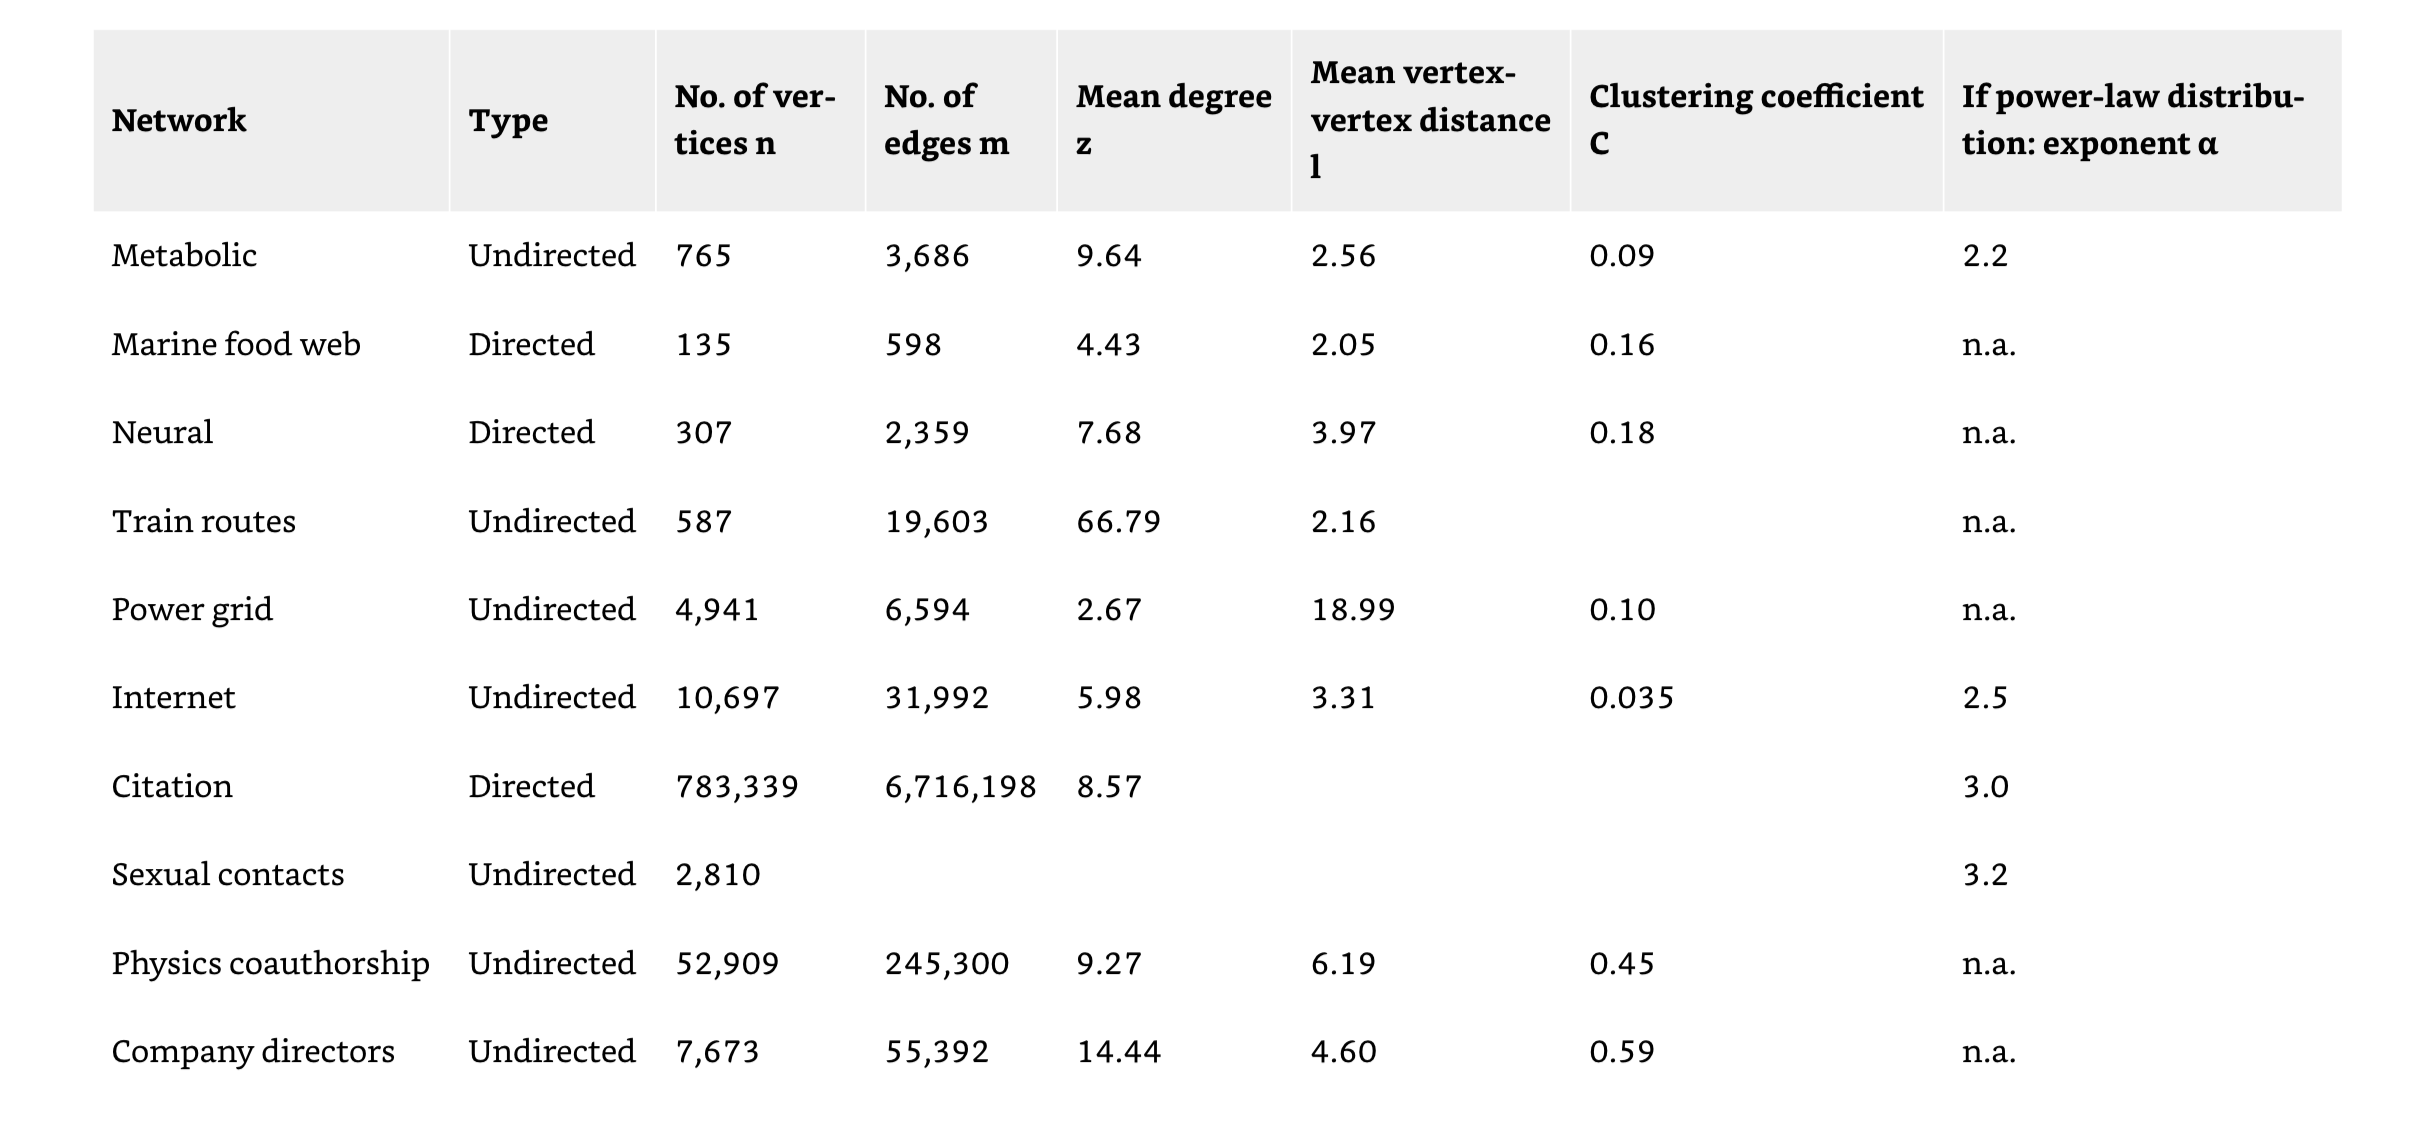
Network: Consists of a number of vertices (or nodes) and edges (or links) connecting nodes. In first instance, the analysis of a network is a description of the vertices and edges and an examination of the properties of the network. A fundamental property is the degree of a vertex. It is the number of edges to or from that vertex.
Resilient networks are associated with the stability around a presumed existing stationary state and have the property of redundancy.
Every complex system that consists of many interacting units can be described and understood as a network.
Biochemical and Bio/Ecological Networks: Metabolic pathways, protein interaction networks, genetic regulatory networks, food webs, neural networks.
Technical and Infrastructure Networks: River and canal networks, road and railway networks and airline routes, electric power grids and telephone and Internet communication networks. Many of these networks are related to space- and geography-governed infrastructure and designed for distribution;
Information (Knowledge) Networks: A classic example is the network of citations, more recent ones are the World Wide Web and networks of people's preferences for objects used in targeted advertising; and
Social Networks: Intermarriages, sexual contacts, mail contacts, friendship relations, business and collaboration relationships, and influence networks of executives and politicians. The vertices are (groups of) people that are in some forms linked to each other. They overlap with communication and information networks.
Macroscopic order emerges from microscopic behavior.
Random events and rule-guided behavior are standard features in ABM. Order is seen to come from below and not as a result of a deterministic process – more like a flight of starlings than an externally forced pendulum.
Agent-Based Models (ABM): Offer the prospect to better understand human behavior in complex social-economic systems, notably at the micro-level.
____________________________________________________________________
Ch 11: Agro-Food Systems
Net Primary production (NPP): Reflects the growth of vegetation, which depends on location, soil quality, elevation, precipitation, temperature and other factors.
Human beings have been quite successful in adapting over a wide range of temperature and precipitation, with the preferred niche largely between 10°C and 20°C and between 500 to 2,000 mm/yr.
Biome: A unit of species composition and ecological processes, and a function of climate and climate-derived parameters.
Social-Ecological Systems (SES): An integrated system of ecosystems and human society with reciprocal feedback and interdependence.
Agricultural Population: Persons depending for their livelihood on agriculture, hunting, fishing or forestry.
Commercial Grazing (Ranching): Large scale, low productivity farms in the Americas, Australia, and NZ for the production of beef and wool.
Bio Industry: Processing of cattle, pig, and poultry stocks at high densities in large manufacturing plants.
Shifting Cultivation: Yields- ~1ton/hA feeding ~.5 people/hA, Low Labor Input, hardly any capital input, useful in tropical biomes but declining.
Wet Rice Farming: Intensive land use, high labor input, high energetic yield, minor soil degradation, mainly in SE Asia in large river basins because much water is needed, livestock is not needed. Often considered subsistence farming because half the rice produced was consumed on the farm. Green Revolution has given boosts to rice yields to values of 3-4 t/hA feeding >2 persons/hA.
Mixed Farming: Europe and NA; European wheat farmers attain amongst the highest yields at 6-8 t/hA.
Green Revolution: Increased agricultural yields due to use of abundant irrigation, fertilizer, pesticides.
Income Elasticity: The percentage increase in food expenditures per percent increase in income. If the elasticity is less than one, the product for which this happens is considered a necessity. If the elasticity exceeds one, it is called a luxury good.
Agro-Food History
Three trends since the early Middle Ages determined present-day mixed farming in Europe: reduction of the fallow period, the extinction of common rights (enclosure) and increasing importance of livestock
The introduction of the heavy plough and the three-field system, the cultivation of roots and grasses as fodder, more and more intense use of inputs in farming and a subsequent shift to more high-value products such as livestock and vegetables.
Liebig's Law of the Minimum: A principle stating that growth is controlled by the scarcest resource and not by the total of resources available. Founded in the observation that increasing the nutrient flows does not lead to more plant growth – growth only increases if a nutrient is applied, which is most scarce of all the nutrients needed by the plant (the limiting factor).
Liebig's Law has been extended to biological populations and natural resources. In a logistic growth process, it is the scarcest resource in the environment that starts to slow down growth
In Belgium, the share of food expenditures in total household expenditures was around 60 to 65% between 1860 and 1920, then declined slowly to 50% by 1950 and dropped precipitously to less than 18% by 1980.
Crop Yield
Wheat, rice, and maize are the three most important grains.
Potential yields are not realized in practice because of natural variations and suboptimal management; as in the Licker et al. (2010) study, namely 43% , 47% and 60% for wheat, rice and maize, respectively.
Efficiency: The ratio between the observed yield and the production frontier for that crop in that region.
Most of the increase in world food production since 1980 came not from more cropland, but from yield improvements.
Globally averaged yields have jumped between 1980 and 2000 from 3.3 ton/ha to 5.7 ton/ha. The average price of ten major crops more than halved in this period. This successful intensification has been possible thanks to a series of changes: irrigation; multiple cropping; application of more and more specific fertilisers, herbicides and pesticides; improved land management (optimal planting, pest controls and so on); and genetic advances (raising the seed/biomass ratio or harvest index and new breeding techniques).
Sustainable Soil Management: Preserving a soils inherent fertility over time. Sustainable soil management thus implies that: 1) the rate of outflow of nutrients does not exceed the rate of inflow by natural and human processes; and 2) the rate of inflow of fertility-reducing substances (‘pollutants’) does not exceed the rate at which they flow out or are broken down to non-damaging substances.
Agro-Food System Pressures: Larger pressure on (ground)water resources for irrigation, contributing to further loss of biodiversity and ecosystem services; and in a larger system context, the agro-food system becomes increasingly dependent on finite resources, notably oil and P.
Direct effects from rising atmospheric CO2 concentrations have in the theory and the laboratory a positive impact on yields through a higher rate of photosynthesis and a higher water use efficiency. Generally speaking, however, the consequences of higher surface temperatures and changes in precipitation patterns from climate change as a consequence of rising atmospheric concentrations of CO2 and other GHGs can be severe: extreme rainfall or drought, heat stress during heat waves, and large-scale adaptations and relocations.
Rising concentrations of surface ozone (O3) in the Northern Hemisphere could annihilate any yield increase from CO2 fertilization.
Desert area in China is estimated to have increased from 17.6% of total land area in 1994 to about 27.5% in 2006.
A fourfold increase in labour productivity in the last 40 years has transformed many farms into mega-operations run with an industrial mindset. Prices paid for crops have fallen 60% in this period – and still the gains in efficiency are insufficient to get a decent income because the wholesalers who supply food processing companies have gotten access to even cheaper alternatives, such as wheat from Ukraine and strawberries from Morocco.
Land Use Cover Change (LUCC): A change in traditional land use, generally towards a degraded status. In a survey of a series of case studies, it was found that five fundamental underlying causes drive LUCC (Lambin et al. 2003): resource scarcity leading to an increase in the pressure of production on resources; changing opportunities created by markets; outside policy intervention; loss of adaptive capacity and increased vulnerability; and changes in social organization, in resource access, and in attitudes.
Countries that produce food can roughly be divided into three groups:
Subsistence Biomass-Based: A biomass economy, with natural energy flows for their sustenance. They are located on the periphery of the world system, across all continents but especially in Asia, Africa and Latin America. Their livelihood is from subsistence farming and herding. They are often poor in both income and wealth and are faced with increasing land, water and energy constraints under the pressure of population growth, resource depletion and globalisation in all its appearances.
Agro-Industrial: High-input industrial agriculture, as part of the increasingly global agro-food chain of food producers, processors, traders and retailers. Their farming is large-scale growing of staple crops such as wheat and maize, production of high value-added fruits and vegetables, and large-scale animal husbandry for dairy and meat products.
The top ten producers have 65-90% of the market, with Syngenta, Monsanto and Bayer as the largest ones in 2007.
Transition: A mixture of subsistence farming, cash crop production and migrant work in urban centers.
Many become laborer’s on large-scale plantations owned by foreign investors and producing cash crops for the global market, as in Indonesia and Malaysia (palm oil), Ecuador (bananas) and Vietnam (coffee).
Typical characteristics of SES are: regional biogeography is a key defining factor, that leads to inherent diversity, locality and plurality of human cultures and institutions; part of their activities and transactions is not monetized; therefore, it is in-house, subsistence farming/herding and in natura exchange.
Livelihood is sustained on the basis of local resources which are exploited as common pool resources (CPR) with a mix of competitive and cooperative arrangements; social stratification is often strong and the resource-based surplus is exploited by local landlords or national government and industrial elites (cash crop or mining); people are vulnerable for natural and human-made perturbations because of limited resource and adaptation options.
It is argued that food aid aggravates the very problems it is supposed to solve, because they make urban populations dependent on food from elsewhere and discourage local farmers to make the necessary investments (Moyo 2009). Forward projections for some countries read like a Malthusian doomsday: Investments in local farming fall short, traditional employment declines, fertility rates remain high because education of women stalls, rural areas get depopulated and city slums swell to ever larger proportions.
But it is a near-certainty that a decline in soil fertility, water availability and waste absorption capacity and an ongoing economic, social and cultural globalisation will make the world agro-food system more complex and more vulnerable.
Production loops operate in every capitalist market system: The farmer-entrepreneur makes an investment in food producing capital and, with other inputs like labour and land, the production capacity generates output and revenues/profits. Part of the profits are reinvested in order to further increase producing capital. It is a reinforcing growth loop as long as profits are sufficiently high, which depends amongst others on demand.
A balancing price competition loop is operating. Providing there is open access to the market, competition amongst existing and new producers drives down the average price. This, in turn, tends to increase demand until the profit margin has declined again to the extent that farmer-entrepreneurs and capital owners put their effort and money somewhere else.
A subsidiary loop is marketing/upgrading in which demand is driven up by processing and advertising. A more effective and important way to boost profits is to bring down the cost of production by increasing the scale of production and by technical innovations.
Thus, a loop of upscaling/innovation (‘rationalization’) leads to increasing productivity of labour and capital and declining product cost. The prospect of rising profits will provide an incentive to invest in new capacity, which in turn reinforces production growth.
In a world committed to open trade, producers are confronted with competitive imports.
Regulation Loop: More stringent health, safety, environmental and animal welfare standards tend to increase costs. This trend towards postindustrial values contributes to what is perceived as a good quality of life.
The push to bring production costs down causes serious environmental damage and social destruction, that is passed on to poor populations and future generations.
Ukrainian soils are the most fertile in the world.
Rich countries buy Chinese goods while building up huge debts. The money is used by a Chinese middle class to eat more meat. Chinese corn and wheat production fall short of local needs. Simultaneously, the USG decides to reduce oil dependence by subsidizing ethanol from corn. Exports start to fall and cause a 50% rise in the corn price in Mexico, where it is a staple food.
Two long-term ‘objective’ constraints in the global agro-food system: Humans need a minimum amount of food for physical survival, and the food-providing resource base is finite in size and in capacity to supply and adapt.
Are major disruptions inevitable when food prices go up and become more volatile? Is more technology the solution, and, if so, what kind of technology? Will resource overexploitation outstrip yield improvements? Can small-scale, ecological and community-oriented forms of agro-forestry and animal husbandry contribute to food security and quality? Is a new solidarity and ethic needed to bring an end to hunger?
‘Light-green’ customer is discovered by supermarkets. Their concerns are personal health, low prices and supermarket convenience, and they are less ‘fundamentalist’ than the original organic food market client.
Trend: Transformation towards permanent agriculture and cash crop plantations.
Worldviews and Agro-Food Systems
Modernist Worldview: The problem is primarily seen as lack of efficiency and ingenuity. The solutions are to increase scale, eliminate trade barriers, reduce losses, stimulate innovations and ensure market-based incentives. Governments should not interfere and subsidies should be abolished.
Postmodern Worldview: Corporations and governments try to steer the world amidst the dangers of hunger, social unrest and environmental degradation, and to sustain the existing power structure – as befits hierarchist institutions
Markets only favour the rich, technology brings new problems, corporate responsibility is window-dressing. ‘We’ should introduce fair trade and green label certificates, eat more vegetarian, forbid child labour, support local cooperatives and farming communities, establish a fund for climate adaptation, and value again local food and traditions. And ‘we’ should avoid paternalism and neo-colonialism: ‘Are African pastoralists the panda bear and ice bear of global agriculture?’
Agro-Food Solutions
Focus on UN-based regulation, with global targets for poverty reduction and GHG emissions and with strict standards for child labour, fair trade and sustainability.
Leadership should fall under the guidance of the UN and enlightened and proactive corporations.
____________________________________________________________________
Ch 12: Renewable Resources: Water, Fish, and Forest
Renewable (Bio) Resources: Regrowth rate as part of natural processes is in the same order of magnitude as the harvest rate.
P is population (stock), b is the birth rate parameter and L is average life expectancy. R signifies the resource size (stock) and dR/dt its change (rate), α its regeneration rate parameter and K its carrying capacity in the area under consideration. The harvest rate H is set proportional to the population, with the parameter β the resource use per person. Let us assume that the population does not grow (dPdt = 0 b = 1L). Given the harvest rate H = βP, sustainable exploitation happens for dRdt = 0.
Maximum Sustainable Yield (MSY): Occurs for Hmax = 14 αK at which the resource regenerates at its maximum rate.
The carrying capacity for people in this situation is Pmax = 14 αKβ.
Resource Scarcity/Limitation Options
Extensify: When resources are scarce (or limited), moving to discover new unexploited resources.
Reduce/Substitute: Reduce demand for a resource by more sober and efficient use or use of substitutes, for instance, fish from ponds (reduce/substitute).
Intensify: Make a resource more productive by applying innovations.
Social Dilemma: Economically rational behavior of individuals causes an undesirable outcome for the collective.
Sustainable Design Requirements
Clear boundary rules: who is in and who is not.
Local rules-in-use should restrict amount, timing and technology of harvesting, relate benefits to inputs, and take local conditions into account.
Individuals affected by the resource regime can participate in making and modifying their rules.
Users select their own monitors, who are accountable to the users or are users themselves and who keeps an eye on resource conditions as well as on user behavior.
Sanctions should be graduated, depending on the seriousness and context of the offence.
Hydrology
Blue Water: Freshwater in rivers, lakes, and aquifers.
Green Water: Moisture in the soil and vegetation.
No Water Stress: >1,700 m3/cap/yr.
Absolute Water Scarcity: <500 m3/cap/yr).
Water Scarcity: A situation in which the amount of water use is close to or exceeding that of water availability.
There is large potential to use water more efficiently, with techniques like drip irrigation, water-saving toilets and showers, and recycling.
Drip Irrigation: A water conservation option that saves water, reduces weed problems, soil erosion, electricity use and helps to reduce overexploitation of groundwater.
Sustainability Strategies
In real-world situations resource use strategies can be expected to fluctuate between random behavior with long-term benefits (knowledge or innovations) and efficient behavior with short-term gains (profits or stability).
Team Game Strategy (TGS).
COINL: A cooperative and long-term oriented strategy; the most sustainable: it relieves the pressure on the resource, reduces fluctuations and diminishes the risk of overharvesting. Therefore, it can reconcile group interests and individual interests. An interesting question is whether a population discovers such a COIN strategy in time to prevent the collapse into the selfish (MG) and poverty (TG) strategies.
Homo economicus (He) vs Homo psychologicus (Hp)
Homo economicus (He): Favors deliberation, because he operates with high levels of need satisfaction and uncertainty reduction.
Homo psychologicus (Hp): Quickly satisfied and an uncertain imitator.
If fishing is the only option, the He use deliberate rationality to increase their income and as a result the fish stock is depleted before year forty. The Hp, on the other hand, are quickly satisfied and do not fish more than needed.
Commons
The authors calculated the optimal management of the world's forests over the period 1995 to 2135. After parameterizing the model for nine world regions, the main conclusion is that only inaccessibility of forests can protect biodiversity in a globalizing market-driven world.
Intensive aquafarming in ponds can deliver up to 1,000x higher yields than in natural production situations.
Increasingly, fish is produced from the high seas and from coastal and inland aquaculture. The latter has spectacularly risen from a few Mt/yr in 1985 to 52 Mt/yr in 2006.
The largest rubber plantation, with 8M rubber trees, is in Liberia. It is operated by the Japanese/U.S. tire manufacturer Firestone/Bridgestone. Labour conditions are bad: $4/day payment, use of pesticides.
____________________________________________________________________
Ch 13: Non-Renewable Resources
In the industrial regime, energy and material use per capita is 3-5x higher than in agrarian societies.
The world uses five key materials: cement, steel, paper, aluminum and thermoplastics; for which use has increased 4-6x between 1960 and 2005 and the exponential growth trend continues.
Societal dynamics driven by resource and capital ownership and the forces of a technological-industrial complex run by urban elites of bureaucrats, managers and technocrats.
Sequestration Reservoirs: Where nature stores material for long periods.
Mobilization Reservoirs: Where material is transferred for much shorter periods
Natural Mobilization Flows: Associated with crustal weathering, sea spray and primary production by vegetation.
Anthropogenic Mobilization Flows: Associated with mining, fossil fuel combustion and biomass burning.
Two resources are crucial in the industrial transition: non-renewable mineral and fossil fuel resources and environmental sinks.
Non-Renewable Resources: Exhaustible or finite stocks of a substance, which are depleted upon exploitation.
Environmental Sinks: Natural systems such as soils, river flows and the atmosphere, which are used by humans for ‘waste’ disposal.
Unsustainable: When the inflow of a particular substance exceeds the rate at which the substance is eliminated and the system regenerates.
Mining: Accounts for ~7-10% of global energy use, emits ~13% of global sulphur dioxide emissions, and impact ~5.3M km2 of forest.
Resource Assessments: Focuses on the probability of existence and the cost of extraction.
1956: American geologist King Hubbert introduces the logistic growth life cycle model, based on the exploration and exploitation history of a region and has been applied mostly for oil and gas.
Oil: ~2/3 of the world’s conventional oil production is from so-called giant fields (>500M bbl, ~3EJ).
Canadian Oil Sands: Amount to the equivalent of at least 10% of total conventional oil reserves.
Separate deposits or fields in a region are usually ranked in order of increasing extraction cost, which results in the so-called long-term supply cost curve (SCC).
Reserve Production Ratio (RPR): The ratio between (proven) reserves and (actual) annual production.
Reserves are a function of exploration, which is often driven by price (expectations).
The reserves at <100 $/bbl would last 70–190 years at the 2005 extraction rate.
Natural Gas: Politically, a key transition fuel for the next decades because of its relative abundance, the potential it offers for further efficiency gains and its relatively low C content. There are downsides, too. The necessary infrastructure, in the form of long-distance pipelines and liquid natural gas (LNG) plants and ships, is capital-intensive, and the production of unconventional gas in the form of shale gas – and similarly of shale oil and of oil from tar sands – is not only more costly but is also expected to cause serious environmental risks from large use of water and chemicals.
Demand drives investment in capital stocks for exploitation. Unit cost tends to go up with accumulated production, which has a negative influence on demand via the price elasticity. Simultaneously, companies invest part of the revenues and profits into cost-decreasing R&D and innovations. This tends to stabilize or lower unit cost, if there is sufficient competition on (global) markets. Another part is invested in exploration, when the reserve base is considered too low or when newcomers enter the market. This permits a constant or increasing identified reserve. Fourth, the more stringent safety and environment regulations tend to increase unit costs, although these are difficult to separate from the other mechanisms.
Seller’s Market: Demand exceeds (perceived) supply and prices tend to rise.
Buyers’ Market: Supply exceeds demand and prices fall.
Hotelling Rule: In an ideal world, it can be shown that an economically optimal resource extraction path requires an annual percentage change in the resource price equal to the discount rate during the exploitation period. In formula: dp(t)dt = r.
Resource Curse (RC) Hypothesis: A state's reliance on either oil or mineral exports tend to make it less democratic.
There three causal mechanisms that link oil and authoritarianism: 1) a rentier effect, through which governments use low tax rates and high spending to dampen pressures for democracy; 2) a repression effect, by which governments build up their internal security forces to ward off democratic pressures; and 3) a modernization effect, in which the failure of the population to move into industrial and service sector jobs renders them less likely to push for democracy’.
Recent econometric analyses for a large sample of countries for the period 1970–1995, confirm that natural resource abundance, with mineral production share in GDP as a proxy, correlates negatively with economic growth. However, the effect reverses sign if other possible explanatory variables such as corruption, investment, openness, terms of trade and schooling are included.
Substance Flow Analysis (SFA): The flows of individual elements and compounds through society. A typical application is for toxic substances.
Material Flow Analysis (MFA): The flows of bulk materials through society, which are faced with depletion or cause environmental impacts during production, consumption and waste management.
Life Cycle Assessment (LCA): The resource and environmental impacts of a product or a service, using MFAs and SFAs for the relevant compounds and a methodology for weighing inputs, outputs and impacts.
Cradle-to-Factory: Covers all steps from the extraction of resources from the environment up to the final product as it is leaving the factory gate.
Cradle-to-Grave: Covers all steps form the extraction of resources from the environment and includes the product use and its treatment in a waste management system.
IU and EKC
Intensity of Use (IU Hypothesis): Introduced to draw attention to the phenomenon that over time (time-series) and across nations (cross-country) the use of materials and fuels per unit of GDP tends to rise and then fall as function of income (Malenbaum 1978). This bell-shaped form of the intensity-of-use curves is associated with the notion of dematerialization.
The IU of a given material (in t/) tends to follow the same pattern for all economies: at first increasing, then reaching a maximum and declining as a function of income.
Because innovating and recycling require a techno-economic and social-political infrastructure, the high-income countries are leading in dematerialization.
Leapfrogging: The adoption of the latest technologies by low-income countries.
20% of global energy- and process-related CO2 emissions arise from the production and processing of only five materials: steel, cement, plastic, paper and Al.
We use over 80B Al soda cans every year.
1955: Economist Kuznets suggestes that income inequality will initially increase with rising income per capita and then decline – another bell-shaped or inverted U curve.
World Bank did not find evidence for a Kuznets curve in a 1960–1990 73 country database. What the data do indicate is that overall economic growth coincides with growth in the income of the poorest segments of society. This is the ‘trickle-down percolator’ hypothesis, which states that economic growth will automatically benefit the poorest segment of society.
Environmental Kuznets Curve (EKC): In the early 1990s, a Kuznets-type relationship was hypothesized between the per capita emission of pollutants (in t/cap/yr) and income.
Early work for the World Bank Development Report in 1992 popularized this idea to the extent that an influential economist claimed that ‘there is clear evidence that, although economic growth usually leads to environmental degradation in the early stages of the process, in the end the best – and probably the only – way to attain a decent environment in most countries is to become rich’ (Beckerman, in Stern 2004).
Explanations are economies of scale in abatement techniques, more strict regulation as people become more affluent and changing sector structure and trade patterns. Per capita emission in newly industrializing countries are significantly lower than for the older ones, probably because of the availability of cheap abatement technologies and less coal use.
Both the IU and the EKC hypothesis may be an aggregate feature of advancing economies.
High-income regions are increasingly cleaning up and applying stricter emissions standards, whereas most low-income regions are still in the early, rather high-polluting stage. The latter do benefit, however, from the awareness and technological development in the high-income regions.
There are clear signs of lower resource intensity (t/) with rising incomes (IU hypothesis), but the causes are only partly understood. The hypothesis that a society can outgrow its environmental problems (EKC hypothesis) is at best partially valid.
Ecotoxicology
Unusual in the field of ecotoxicology, the evidence linking cause and effect is irrefutable. The phenomenon is by some considered as ‘the best example of endocrine disruption in invertebrates that is causally linked’.
Degradation Rate: The rate at which a substance is broken down or otherwise made inert in comparison with the relevant natural processes.
Radioactive Plutonium (Pu): A known carcinogen at very low doses, occurs in nature at extremely low concentrations and is toxic for millions of years.
Acidifying Compounds (SO2, NOx’s and NH3): Mainly result from burning fossil fuels; cause harm, damaging the health of people and trees. They cross borders and give rise to international transboundary long-term environmental problem.
Preindustrial O3 concentrations will not be restored before the year 2060, the incidence rate of skin cancer in places like Australia will continue to rise during the 21c and adaptation is the only option for the next generation.
Many ecotoxins accumulate to often hazardous concentrations.
The industrial economy is causing large outflows of substances in the natural environment. Because some substances have long residence times, are not or only partly broken down and move across compartments and borders, they pose serious challenges for sustainable development.
Ecotoxins and Emissions Reduction
People can respond basically in two ways: adaptation to actual or imagined impacts and mitigation in the form of emission reductions.
Emissions reduction has a series of co-benefits, such as reduced negative health impacts from air pollution, and helps realize other sustainable development goals.
Glass bottles with deposit is often still the most environmentally friendly option – and aluminum cans the least. But the main maxim should be: reduce before reuse, expressing the challenge of using materials
Precautionary Principle: A general rule of public policy action to be used in situations of potentially serious or irreversible threats to health or the environment, where there is a need to act to reduce potential hazards before there is strong proof of harm, taking into account the likely costs and benefits of action and inaction.
In their recommendations, the studies’ authors stress the importance of long-term monitoring, evaluating alternative options, engaging also ‘lay’ and local knowledge and ensuring regulatory independence, &c.
When explicit risk analysis and evaluation became part of legislature and mandatory, corporations began to hire consultants to downplay or put in doubt the scientific observations about toxicity and impacts. The conflictual nature of this feature of the industrial economy became clear in corporate lobbying with antipublic health campaigns and policies to circumvent environmental laws.
____________________________________________________________________
Ch 14: Towards a Sustainable Economy?
Postindustrial transition process: A change from low income and low resource use levels towards a new equilibrium at high- and stable income and resource use levels; summarized in seven items:
1) A positive feedback process drives the growth of income (/cap/yr), which leads to (exponential) growth in activity chains.
2) The chains consist of exploration and extraction of resources, followed by processing into manufactured goods, use and discarding.
3) Fossil fuels are an essential high-quality energy resource, that enables in combination with capital and knowledge accumulation a steady increase in labour productivity.
4) The resource intensity of income (mass/) first rises and then declines with income (IU hypothesis).
5) The externalities along the chain: resource depletion, pollution impacts and waste accumulation, are initially not perceived and not priced.
6) With a delay, externalities are incorporated in the resource price in response to complaints of the more affluent citizens (EKC hypothesis).
7) The rising resource price stimulates a process of cost- and pollution-reducing innovations and the development of substitutes and alternatives.
Impacts of Post-Industrialism
The non-renewable resource is an aggregate of minerals/fuels and indicated with MF. Income growth causes an increase in MF use, initially at an accelerating pace. The resource is still cheap, but the rapidly rising extraction rate causes a cost increase: the depletion feedback loop. The MF market price goes up and this induces more efficient MF use in the price feedback loop. When income increases further, the MF intensity starts to decline (IU hypothesis). With rising income, citizens start to protest against the pollution from resource use, because they experience it as loss of quality of life.
Government and industrial elites are forced to invest in pollution abatement and in resource use efficiency: the externality feedback loop (EKC hypothesis). Additional costs are made in the economy for waste treatment, material efficiency and recycling and for the associated physical and institutional infrastructure (regulation, enforcement and so on). It shows up in higher cost and price levels and reinforces the price and externality feedbacks. The new, high-income equilibrium can be sustained as long as there are enough resources available at the higher cost level or if a substitute is available.
What the Chinese Deputy Minister of Environmental Protection in 2006 said comes true: ‘China has entered a phase of frequent environmental accidents. With a fast growing economy, systematic risks of environmental accidents brought about by unscientific placement and industrial structure will replace individual pollution to become the No. 1 threat to our country's environmental safety’. Infrastructure falls short of expectations and income inequalities increase, which gives rise to social tensions.
There are long-term impacts, such as changes in climate and biodiversity, but these tend to be ignored or denied in the face of more direct challenges and threats. From a source perspective, this economic growth path is unsustainable because the resource is depleted before the year 2100 despite a stabilized extraction rate. From a sink perspective, it entails the risk of irreversible losses in quality of life. But such a growth path is possible, as countries such as Taiwan and Korea have shown (TCEPD 1989).
Historically, resource shortages have been countered by military conquest, import of resources and outmigration of people. Nowadays, trade is the preferred choice and mineral ore and fossil fuel are the largest bulk trade flows in the world. Resource-scarce countries will try to exchange manufactured goods and services for resources.
In many countries, short-term priorities still overwhelm all long-term concerns.
Economic History
Economic theory more or less starts with the late 18c scholar Adam Smith and his book Inquiry into the Causes and Nature of the Wealth of Nations (1776). It explained how increasing trade and market size leads to specialization, which causes labour productivity to increase. This in turn increases income per capita and, subsequently, market size. This positive feedback loop only starts to operate when market size exceeds a certain threshold, as it did in Smith's time in response to novel techniques, colonial conquests, falling transport costs and other factors.
Smith also looked for another mechanism than church and state that could tie together society, and he found it in the famous invisible hand of the market mechanism. If the individual is given the opportunity to pursue his own self-interest, in an environment of likely motivated individuals, this leads to competition. This in turn produces the goods society wishes to have and at prices that people are willing to pay. Thanks to competition, selfish motives yield the unexpected outcome of social harmony.
In his Essay on the Principle of Population (1798), Malthus showed himself more skeptical about societal progress than Smith. He argued that unconstrained population growth will inevitably outstrip food production because land is a finite resource and food production has diminishing returns, which means that twice as many laborer’s on the land produce less than twice as much food. The consequence is declining food per person, followed by a rise in mortality and a stabilization with overshoot. In other words, natural processes tend to put limits to growth. Malthus concluded that population control was necessary. By breaking the link between population growth and output growth, he felt an escape was possible, but only if it was engineered.
Malthus failed to recognize the importance of capital and technology, which allow farmers to escape the diminishing returns of land and to increase yields significantly. Second, better hygiene and sanitation, medical advances and birth control options in combination with rising income led to a reduction in birth as well as death rates in the European countries. 200y of sustained growth of economic output in Western countries suggests that Malthus was wrong. However, 10K years of pre-industrial history as well as the large group of countries that still seem locked in a no-growth poverty trap show that rejection of ‘Malthusianism’ is premature.
Much of 19c and 20c political economy was about the world's imperfections: the permanent threat of scarce resources for a growing population (Malthus and Ricardo), the exploitation of laborer’s (Marx), the absence of coordinated planning and redistribution (Saint-Simon and Stuart Mill), the elimination of competition by large oligopolistic enterprises and the psychopathology of the capitalist class society (Veblen) and the creative destruction of technological change (Schumpeter).
Economics
Investment in physical capital and equipment; in human capital and in research; and development (R&D) are all forms of technology and causes of productivity growth. There is not yet a validated theory of how each of them contributes and how they interact.
Evolutionary economists attempt to simulate two major groups of actors in an economy: producers and consumers. A small group of agents (producers and consumers) ‘drive’ the system to more and novel products for consumption, exploiting the desire for profit, status and novelty.
Unit Production Cost: There is continuous drive to lower unit cost through R&D. Traditionally, the ways to reduce costs are through economies of scale, economies of scope and learning-by-doing. All three can work as positive feedback loops through which unit cost declines.
Unit Development Cost: In many modern knowledge-intensive industries, the upfront development costs, are a large fraction of total cost and the actual production cost are small or negligible (chips, software or music as examples). Once underway, there is an enormous drive to create large sales to recover the upfront cost.
Product Awareness: Firms will use advertising and sales efforts to promote their products. In combination with word of mouth and media attention, this may create positive feedback towards ever larger sales and market share.
Externality: Denote those costs or benefits that are not transmitted through prices. With costs, it is a negative externality; with benefits, a positive one.
Race to the Bottom: The country with the lowest standards in environmental regulation – and other regulation, such as labour conditions and nature protection – attracts industries in search of higher profits and force other industries to lobby for less strict regulation in their country.
Mainstream economic science sees individuals as rational agents, who immediately and intentionally adjust to whatever is economically optimal under new conditions.
Technology: A dominant force in economics. It is represented in the feedback loop in the lower left of the CLD. Savings and profits provide capital for expansion and replacement investments, but also for R&D and innovation. In combination with capital-labour substitution and economies of scale/scope, it leads to higher labour productivity. This increases income and tends to decrease unit costs. In this way, technology drives the larger, positive feedback process of economic growth. It also satisfies the desire for new products that is a consequence of the repetition/habituation process amongst consumers and is stimulated by advertisements.
‘During periods of long-wave expansion, material wants are satisfied, and social concerns turn to civil liberties, income distribution, and social justice…As the expansion gives way to decline, conservatism grows, and political attention returns to material needs…During the downturn, the accumulation of wealth becomes the overriding concern, at the expense of civil rights, equity, and the environment…The variation of political values is primarily the result of entrainment by the economic cycle’
L (wages or salaries)* and capital K (dividends or rent), together making up the value added (VA).
Economics and Energy
Not surprisingly, direct expenditures on energy are higher when you buy for 100 products from the chemical sector than when you spend it on childcare – 20x more in the Netherlands in 2001. But those same 100 generate 6x more employment when spent on childcare as compared to chemical products.
Unsustainability in globalisation, namely that stricter environmental regulation in high-income regions makes it, in combination with cheap labour in low-income regions, profitable for corporations to move their (material- and energy-intensive) sectors away from high-income countries towards countries with less strict regulation.
Analyses based on I-O analyses with estimates of embodied energy in imports/exports indicate that at least part of the dematerialization (in MJ/) in the United States, Europe and Japan has occurred because of shifts in economic activity to Mexico, China and other low-income regions.
Rebound Effect: If cost-effective measures to reduce energy and material use in industrial production help to lower production cost, they will also in the longer run reduce the product price, if competition is working. This in turn probably leads to a higher demand for the product and hence to production expansion and a higher overall material-energy use. As a consequence, a part of the benefits of the measure (material-energy saving) are annihilated by growth.
Investment decisions are made in order to replace part of operational costs for waste management and emission charges by fixed capital costs. Those operational costs now concern non-market priced environmental goods such as clean air or water, and society must agree on some price, via taxes or emission trading, or introduce and enforce regulation and standards in order to elicit the necessary investments.
Economic Growth and GDP
The world has an economic growth addiction.
Governments are keen on economic growth because it is a prominent way to satisfy the large needs for public goods (roads, schools, hospitals or army).
The fundamental dilemma: with growth- the boundaries and feedbacks of a finite earth, without growth- the risks of social instability – a genuine quandary for governments.
Gross Domestic Product (GDP): The value of all the goods and services produced in one year in a given economy as expressed in the monetary System of National Accounts (SNA).
Divided by the number of people in a country, it is the (average) income in monetary units per year per person (GDP/cap). If income transfers with the rest of the world are included, it is gross national product (GNP). If the goods and services for investment are subtracted, one gets the net domestic product (NDP).
Gross Domestic Income (GDI): The sum of all incomes (wages, salaries, entrepreneurial income and all rents).
Employment: The core mechanism of wealth redistribution and meaningful social positioning.
From a sustainability perspective, one should ask whether continued economic growth is possible in view of the constraints of a finite planet. Will it not start to interfere with its very aim of a better quality of life?
In the calculation of GDP, there is no distinction made between costs and benefits. This may cause a serious overestimation of GDP as a source of quality of life. Many market-related transactions contribute to GDP but are not benefitting anyone and are actually costs (negative externalities). Well-known examples are the expenditures associated with traffic accidents, pollution abatement and natural disasters. Advertisements are counted as benefit, although they largely reflect corporate battlecries. The experience of nature is to an ever-larger extent associated with travel and accommodation expenditures. Financial transactions show up as contributions to GDP, although they are at least partly an indicator of excess greed and risk. And one can also wonder about the medical and psychiatric expenditures to combat the side effects of life in a (post)industrial society.
A second flaw is that there is no distinction between stocks and flows. Resource use is accounted for in GDP on the basis of the monetary value of the extraction flow, without accounting for the decrease of the resource stock. It is like counting only the money you withdraw from your account, without considering the debt you are building up meanwhile.
Two indicators address these shortcomings:
Sustainable Economic Welfare (ISEW): Account for contributions to GDP that are actually costs.
Genuine Savings Rate: Focusses primarily on the adequate inclusion of changes in natural and human capital.
Sustainable Economics?
1) The struggle for resources.
Problem: Rising demand in combination with scarcity and environmental change lead to price volatility and speculation, which in turn trigger social unrest. It induces corruption and war in states with large resources but weak governance and institutions.
Solution?: World price and trade agreements for specific commodities are part of the solution. Transfer of technologies and introduction of standards and labels for more efficient resource use and recycling are another part.
2) The income and wealth gap.
Problem: A conventional view on economic inequality is that wealth ‘trickles down’ from the richer to the poorer strata of society with a rise in average income. ‘A rising tide lifts all boats.’ This view rationalizes wealthy people's desire for more.
Solution?: There is probably an ‘optimum’ income inequality, when the incentive to take risks and create wealth is in balance with the fairness needed for citizen's compliance.
3) Trade and globalisation.
Solution?: More open economies are said to have higher economic growth rates.
4) Corporate responsibility.
Problem: In the absence of legitimate global governance, sustainable management of the ‘global commons’ cannot succeed. The short-term and quick and high returns still dominate most business.
Solution?: Design and implementation of more stringent rules for corporations, as laid out in, for instance, Corporate Social Responsibility (CSR) and Earth Charter, are needed and some corporations already take the lead.
5) Sustainable Economics Solutions
Internalize, encouraged by regulation and prices, an ethic that does not permit shifting the burden onto people far away in space and time and onto other species.
Redirect consumerist lifestyles towards more immaterial lifestyles that emphasize moderation, intelligence, cooperation and sharing.
Follow basic principles of ecology: there is no such thing as ‘waste’ in nature, interdependence is the rule not the exception, (bio)diversity is the best insurance for adaptiveness and spread of risk – and there is only one energy source: the sun.
Redirect technical innovations towards a better balance between (rich) consumer wants and (poor) human needs and stimulate a ‘green economy’ of reuse, recycling and renewables.
Apply the subsidiarity principle: global governance where necessary and local governance where possible, in order to give room to the greatly needed dynamic and creative forces of civic communities and entrepreneurial capitalism.
Technology and innovation dynamics, human behaviour and subsystems such as the financial system, government policies and the informal economy must be incorporated in the models to make them useful for sustainable development strategies and policies.
We do need a more adequate indicator than GDP in order to measure well-being and quality of life and to formulate targets and evaluate progress towards sustainable development.
Truly long-term solutions are more intense resource efficiency and recycling and further development of substitutes. They are needed, and without delay, for a path that can be considered a sustainability transition.
An industrial economy can make the transition to a sustainable state, provided the average income stabilizes and there are sufficient resources, substitutes and sinks.
Price-based market forces, government-coordinated regulatory policies and behavioral changes are all needed.
The experiences in the US and Europe show that part of the damage is reversible and can be undone. Pollution-related diseases can be addressed with medical expenses and technology; rivers and soils can be cleaned up or will slowly recover if no longer under stress. But it takes time and effort. Some impacts are irreversible – notably the expected change in climate and the loss of biodiversity. The social impacts show up as a further increase in income and wealth inequality, decline of community life and tensions in the provision of public goods. These can be remedied by proper social security schemes and public planning, but here the experience shows that it is difficult in times of high expectations, rapid globalisation and large uncertainties.
There are three solutions to such a ‘doomsday’ scenario. First, the existence of a backstop resource, which is a substitute resource that is available in nearly infinite amounts. A second solution is technology that makes it possible to perform economic activities at vanishing resource and environmental intensity, as is the case in extreme forms of the IU and EKC hypotheses. A third and officially rarely discussed possibility is a change in lifestyle and values that breaks by a mixture of necessity and creativity, the link between the use of finite sources and sinks and the quality of life.
If sustainability is defined as the situation in which production- and consumption-related waste flows ending up in environmental sinks do not exceed the rate at which they are absorbed and broken down, then weak sustainability implies that ever larger waste flows must be treated and eliminated. This itself will require large amounts of exergy and materials. One only has to consider the energy balance of the Earth to realize that this will pose limits to growth at some point in time and place.
Most integrated economy-climate models suggest that policies to stabilize atmospheric concentrations would postpone income growth with only a few years (Azar and Schneider 2002; IPCC 2001, 2007). For these reasons, most participants in the sustainability debate prefer strong sustainability, which implies limited substitutability between natural and man-made capital.
How much decline in quality life can a SES sustain before it collapses (resilience)? How productive and circular can the industrial system become (efficiency)? How can a decent quality of life be secured at low and stationary levels of physical throughput (sufficiency)?
Modelers and experts interact with participants and stakeholders in order to formulate a shared problem perception, to understand and communicate the dynamics of the relevant processes, and to design feasible, mutually beneficial strategies.
____________________________________________________________________
Ch 15: Outlooks on Futures
Humanities Past
Whenever threats to survival were absent, the individual and his kin could pursue other qualities of life such as improved shelter and clothing. It was here when development of the individual, and with-it society, started.
Survival and reproduction of the individual and his kin has for ages been the main if not only sustainability concern for humans. Only a few individuals broadened their horizons and interests to larger areas and longer periods.
Levels of quality of life above mere subsistence could rarely be sustained for more than a dozen of generations and for more than a few small elite populations. For the majority of people, individual suffering from illness, strenuous labour, oppressive overlords or natural disasters was never absent or far away. One response to these realities of life was military valour and conquest – the way of the warrior. Another one was transcending the individual self, in art, love, sacrifice, meditation and compassion – the way of artists, philosophers and priests.
Humanities Future
Instead of a rosy future, we can describe dystopian futures. Resources are squandered, its revenues are spent on armaments and used to provide luxury items. Corruption and crime are rampant. Institutions fail to deliver necessary health, educational, financial and legal services. Public transport and other infrastructure lags far behind.
Globally operating corporations and national governments, working together in supraregional and global institutions, have to take the lead and act.
The future world will, like the world of today, consist of a variety of regions, some of which realize their own brand of sustainable development and others become more or less isolated islands of decline and misery.
Forecasting Methods
Scenario Method: A tool for (better) (strategic) decision making. Common elements include the construction of alternative futures in order to prepare for divergent plausible futures; use of both qualitative (‘story-telling’, narrative) and quantitative (‘modelling’) approaches and challenging existing mental models; a training in finding key trends, recognizing prevalent myths and imagining attitudes of key players.
Strategy: The art of deliberately recognizing major trends, establishing one's own course of action and translating this into practical plans.
Visioning: Imagining, at first generally and then with increasing specificity, what you really want…not what you have learnt to be willing to settle for. Visioning means taking off all the constraints of assumed “feasibility.”’
Experts who forecast better than average…are comfortable seeing the world as complex and uncertain – so comfortable that they tend to doubt the ability of anyone to predict the future.
Connecting Worldviews with Sustainability
Sustainable development faces macro-problems that are high in aggregate complexity and low on consensus in worldviews.
Explicit acknowledgement of worldview pluralism is the basis for legitimacy in a modern democracy and prevents us from falling in the trap of reducing the problem to a single solution for an – illusory – single constituency. Sustainability is lost when one worldview starts to dominate and society moves towards extremes
One approach is to position oneself in the centre of the worldview space and to identify values and beliefs, hopes and aspirations (utopia) and fears and concerns (dystopia) in each of the different worldviews. It includes an evaluation of capabilities, resources and technologies in the form of financial, economic, social and media power and control. A scenario then becomes a policy program that is robust and resilient in the face of change, including sudden shifts in the political landscape and surprise events in the natural system (MNP 2004). Such an integral and non-ideological approach is what governments (should) do, in the public interest, in an attempt to identift and implement robust policies.
If the particular worldview has support from powerful groups, it can effectively be marketed as a desirable view of the future, with other scenarios and associated worldviews as potential threats. In this way, scenarios become politicized and get ideological content.
A third option is to start from policy goals and targets that have already been agreed upon, such as the Millennium Development Goals or the European Union's 2°C target for climate change, and investigate various model-supported storylines that might meet the goals and targets.
Politics can be described as the area in society where issues transcending mere individual needs and activities are debated and decided and where disagreement is legitimate. It has its own rules and rites.
Miklos Persanyi, former Environment Minister of Hungary, shared with me and others some experiences about life in politics. A basic rule for politicians is: If there is no must to decide, it is a must not to decide.
When you are in the science-policy interface dealing with politicians, obey the following rules: draw/keep politicians’ attention; speak their language: be stupidly simple/primitive, talk about money, talk about benefits for constituency/business; don't use words like future, climate…instead, talk about costs, floods; become a media star, marry his/her daughter, or go golfing.
politicians for their often narrow-minded, myopic, self-interested behaviour.
bounded rationality was introduced by the sociologist Simon to indicate that people usually act on the basis of a few, rather simple rules.
Individual experiences are filtered by several subsequent layers (Morecroft and Sterman 1992): tradition, culture and the like; organisational and geographical structure; information, management and communication systems; operating goals, rewards and incentivies; and finally, peoples cognitive limitations.
Worldviews
A1 (Modernist): Material wealth and high-tech business are essential for a good quality of life. Everyone with specialized skills and a competitive and risk-taking attitude can share in it. Market-driven economic efficiency, minimal government regulation and open trade are preconditions. The benefits accrue to a small part of the population, but wealth and novel goods and services will over time ‘trickle down’ to the poor. Post-war performance of the US is the most visible proof of the correctness of this ideology.
B2: Protect the small and local world in the form of cooperation, solidarity and forms of enclosure. Citizens find their identity in cherishing what is local, be it their vernacular, the village church or a nearby forest. The focus is on local needs and livelihoods, to which technology and governance should be geared. Protectionism is seen as a survival option for their socio-economic as well as cultural way of life.
B1: A world in which international cooperation and solidarity are needed in order to solve the large-scale and long-term social and environmental problems the world is facing. Persons adhering to the B1 vision support universal values and aspirations regarding global solidarity and peace, human rights and sustainable management of the global commons. Theirs is a world of global governance and value-inspired science. The Millennium Development Goals (MDGs) are an expression of this worldview.
Worldview Perspectives
Many people currently dismiss the B1 world as a failed ideal and a bureaucratic dystopia, pointing at the political quarrels, fraud and mismanagement in the UN organization and in development aid. They prefer the ‘realism’ of the postmodern A2 world. They are joined by those who are disappointed by the promises and technocracy of the A1 world and by those who have anyway no interest in the societal and immaterial aspects of life. Their future brings a world of individualism and hedonism, in which citizens resort to a mix of consumerism, opportunism and fatalism. It offers the pleasures of the material and body culture and opportunities for local politicians and entrepreneurs, but injustice and lack of social coherence take their toll in the form of fear, disorder and crime.
It was in SRES hypothesized that more ‘free market’ forces of privatization and deregulation lead to higher economic growth; that higher income causes a more rapid stabilization of population growth; and that protectionism hinders trade and, therefore, economic growth.
Integral Worldview: Genuine sustainable development should be built on the balanced manifestation of all four worldviews.
Future Scenarios
A mainstream scenario is one in which the hierarchist perspective of official government institutions prevails. It is a world of ‘muddling through’: A series of incremental policy measures can avert major catastrophes, but large long-term environmental risks are not properly addressed. This is caused by waiting too long for more and more reliable knowledge and getting bogged down in bureaucratic ineffectiveness and political deadlocks. The only consolation in the face of repeated and spreading disasters is perhaps that the emergency actions are well organised.
A stabilising trend towards a population between 8-10B individuals for the period until 2050.
Trend Scenario: Development is guided by maximizing productivity and efficiency through competition, innovation and abolition of trade barriers in the search for high returns on capital savings and decreasing consumer prices. Multinational corporations are the prime actors in an ongoing process of globalisation, whereas governments, including international organizations, focus on safeguarding a level playing field for the corporations and on securing access to resources and contain environmental side effects (Dicken 2009; Schrijver 2010).
Much creativity, organizational skill and willpower is spent on overcoming resource scarcity and environmental degradation – the knowledge and money are available. The high income growth goes together with increasing energy use, but depletion and environmental impacts are met by resource efficiency, recycling, renewable energy and pollution abatement in response to rising world market prices. The postindustrial transition sketched in §14.1 succeeds.
Alternative Challenge Scenario: With drastic improvements in energy efficiency and a deep penetration of non-C energy sources. Large-scale C sequestration and storage (CSS) is needed in the transition period. It implies massive and fast development and transfer of new technologies and adaptation of users and institutions at all scale levels.
The emphasis is on personal growth and self-awareness, as a source of inner conviction and of behavioral change and in natural association with sustainable livelihood precepts. People experiment with sustainable communities in a variety of ways, with their own local resources and their own values and understandings.
Science: The aspiration to produce, individually and collectively, knowledge of the highest possible contextual validity.
B1 Collective and Immaterial (Absolute Idealism): Government/church authority offers universal truth.
Tech and organization in the service of the soul.
Hierarchist tendency in collectivist setting.
Welfare economics Our Common Future.
B2 Individual and Immaterial (Subjective Idealism): Truth is personal.
Low/appropriate tech and human scale.
Egalitarian in individualist setting.
A1 Collective and Material (Objective Materialism/Modernism): Science is universal truth.
Society high-tech and well-managed.
Hierarchist tendency in collectivist setting.
A2 Individual and Material (Subjective Materialism/Postmodernism): Truth is what can be sensed.
Tech and organization for material wellness.
Individualist tendency.
Market economics.
____________________________________________________________________
Misc Quotes
“For lack of a nail, the shoe was lost; For lack of a shoe, the horse was lost; For lack of a horse, the rider was lost; For lack of the rider, the battle was lost; For lack of the battle, the kingdom was lost – And all for the lack of a horseshoe nail!”-Old English Proverb.
“Turning and turning in the widening gyre The falcon cannot hear the falconer; Things fall apart; the centre cannot hold; Mere anarchy is loosed upon the world, The blood-dimmed tide is loosed, and everywhere The ceremony of innocence is drowned; The best lack all conviction, while the worst Are full of passionate intensity.”-Yeats (The Second Coming).
“To be without some of the things you want is an indispensable part of happiness.”-Bertrand Russell (The Conquest of Happiness, 1968).
“The difficulty lies not with the new ideas, but in escaping the old ones.”-John Maynard Keynes.
____________________________________________________________________
Resources
EU Sustainability Science: www.sustainabilityscience.eu
Gapminder: A site with large amounts of data on the world with a nice interface; www.gapminder.org
International Institute for Applied Systems Analysis (IIASA): A site on various global change issues (population, land use, energy); www.iiasa.ac.at
IPCC Reports: www.ipcc.ch
NASA’s Earth System Science Data and Services Data: www.nasadaacs.eos.nasa.gov/index.html
USDA Soils: More than a dozen maps on topics such as soils, climate, and biomes; www.soils.usda.gov/use/worldsoils/mapindex/
World Resources Institute: Data and maps on ecosystems and biodiversity; www.earthtrends.wri.org/index.php#
World Trade Organization: www.wto.org
____________________________________________________________________
Terminology
Asabiya: The concept of ‘Group feeling’ or ‘collective solidarity’, in which different groups have different abilities for concerted action (Ibn Khaldun).
Categorical Imperative (Kant): Act as you if would want all other people to act towards all other people.
Millennium Development Goal 1 (MDG 1): Eradicate extreme poverty and hunger.
____________________________________________________________________
Chronology
Summer, 2010: US Officials share with the Afghan government the discovery of major, previously unknown deposits, including Cu, Fe, Au and industrial metals like Li.-Sustainability by de Vries.
Jun, 2010: A ‘blocking anticyclone’ causes a heat wave of unprecedented intensity and duration in the southern part of Russia and in E. Ukraine. Summer temperature in large cities such as Moscow and Kazan reach 39°C.-Sustainability by de Vries.
2005: The USG decides to provide subsidies for the production of ethanol and biodiesel from corn in order to reduce the dependence of the US transport sector on imported oil. Ethanol production increases sevenfold between 2000 and 2009 to almost 40B litres. The aggregate worth of the subsidy for the biofuels industry was an estimated $92B between 2006 and 2012.-Sustainability by de Vries.
2005: Ratification of the Kyoto Protocol.-Sustainability by de Vries.
Dec, 2002: The UN passes Resolution 57/254 on the UN Decade of Education for Sustainable Development (2005–2014) was adopted by the UNGA.-Sustainability by de Vries.
2002: The World Summit on Sustainable Development is organised in Johannesburg by the UN Commission on Sustainable Development (CSD) around five issues with the acronym WEHAB: Water and sanitation, Energy, Health, Agriculture, Biodiversity.-Sustainability by de Vries.
1997: The First World Water Forum, organised once every three years is held by the World Water Council.-Sustainability by de Vries.
1995: The Trésor Foundation is founded by individuals at the U. of Utrecht, the Dutch, French and US branches of the WWF and the Dutch business community. The Foundation's mission is: to conserve biodiversity and develop sustainable land use in a way that is equally beneficial to all the parties directly and indirectly involved, by means of cooperation, consultation and local participation. The Foundation bought 2,600 ha of rainforest from the French-Guianese diocese in the NE of French-Guiana.-Sustainability by de Vries.
1995: The World Food Summit is organised by the UN FAO in Rome.-Sustainability by de Vries.
1994: UNCLOS goes into force.-Sustainability by de Vries.
1994: The UN Convention to Combat Desertification (CCD) is signed.-Sustainability by de Vries.
1992: The UN Conference on the Environment and Development (UNCED, ‘Earth Summit’), leads to the Rio Declaration and Agenda 21 in Rio de Janeiro.-Sustainability by de Vries.
1992: The Convention on Biological Diversity (CBD) and UN Framework Convention on Climate Change (UNFCCC) is signed.-Sustainability by de Vries.
1988: The World Meteorological Organization (WMO) and UNEP set up the Intergovernmental Panel on Climate Change (IPCC).-Sustainability by de Vries.
1987: The Montreal Protocol on Substances that Deplete the Ozone Layer is signed.-Sustainability by de Vries.
1987: The UN WECD publishes “Our Common Future (the Brundtland Commission)” which launches sustainable development as a new, overarching concept. Its main conclusion was that ‘humanity has the ability to make development sustainable to ensure that it meets the needs of the present without compromising the ability of future generations to meet their own needs’.-Sustainability by de Vries.
1982: The UN Convention on the Law of the Sea (UNCLOS) is adopted providing for an EEZ of 200nm.-Sustainability by de Vries.
1980: The International Union for the Conservation of Nature (IUCN) presents the World Conservation Strategy. .-Sustainability by de Vries.
1971: The Club of Rome issues the report “Limits to Growth,” which used a computer simulation model to depict in quantitative detail the possible future trajectories of the human population, its food and industrial output and its resource base. The two main conclusions were: 1) if the present growth trends in world population, industrialisation, pollution, food production, and resource depletion continue unchanged, the limits to growth on this planet will be reached sometime within the next one hundred years. The most probable result will be a rather sudden and uncontrollable decline in both population and industrial capacity. 2) It is possible to alter these growth trends and to establish a condition of ecological and economic stability that is sustainable far into the future.-Sustainability by de Vries.
1962: Silent Spring is published by Rachel Carson. A wake-up call when it appeared, it dealt with the pollution of air, water and soil in the US as a consequence of rapidly growing industrial and consumer activities – in short, of economic growth.-Sustainability by de Vries.
1960s: Lovelock’s Gaia Hypothesis; organisms not only adapt to their environment, but life created for itself the physicochemical environment in which it could flourish.-Sustainability by de Vries.
1955: Economist Kuznets suggests that income inequality will initially increase with rising income per capita and then decline – another bell-shaped or inverted U curve.-Sustainability by de Vries.
1954: Geologist Ahren proposes a ‘fundamental law of geochemistry’: The concentration or grade of an element is lognormally distributed in a specific igneous rock.-Sustainability by de Vries.
1954: Maslow argues, partly as a rebuttal of behaviorism, that people behave and use their resources in such a way that their physiological needs (food, shelter and so on.) are met first. When these ‘basic needs’ are sufficiently satisfied, people will orient themselves towards higher needs: safety, belonging and being loved.-Sustainability by de Vries.
1947: Holdridge proposes a life zone classification system with 33 classes on the basis of 1) annual precipitation rate (rain in mm/yr) and 2) potential ET (ratio of water loss in evaporation/transpiration and precipitation).-Sustainability by de Vries.
1941: Kanon der Erdbestrahlung und seine Anwendung auf das Eiszeitenproblem is published by Milankovitch, in which he attributes ice ages to changes in the angle between the Earth's axis and its orbit around the Sun and the shape of the Earth's orbit around the Sun.-Sustainability by de Vries.
1933: A multilateral convention on the preservation of fauna and flora, notably in Africa, is signed.-Sustainability by de Vries.
1931: A multilateral convention on whaling is signed.-Sustainability by de Vries.
1919: The arms race model is first formulated by Richardson to understand the causes of WWI.-Sustainability by de Vries.
1908: The Haber-Bosch Process is introduced by which N reacts with H to form NH3 which is converted into nitrates and nitrites, becoming the feedstock for the large-scale production of industrial fertilizer.-Sustainability by de Vries.
1897: The chemical benzene, increasingly used for tire and explosive manufacture, is first known to be a powerful bone marrow poison (later known as leukemia).-Sustainability by de Vries.
1881: Polychlorinated biphenyls (PCBs) are first synthesized.-Sustainability by de Vries.
1808: The Boyle-Gay-Lussac law is introduced; “the ratio of the product of pressure and volume and the absolute temperature of a gas is equal to a constant.”-Sustainability by de Vries.
1753: Swedish botanist Linnaeus pens Species Plantarum, a plant classification system.-Sustainability by de Vries.
1735: Swedish botanist Linnaeus pens Systema Naturae.-Sustainability by de Vries.
Easter Sunday, 1722: Dutch Admiral Roggeveen discovers a small island in the Pacific Ocean that he names ‘Easter Island’. When Roggeveen set foot on the island, it had a society ‘with about 3000 people living in squalid reed huts or caves, engaged in almost perpetual warfare and resorting to cannibalism in a desperate attempt to supplement the meagre food supplies on the island.’ Scattered across the island were >600 massive stone statues of, on average, some 6 m high and weighing more than 50 tons.-Sustainability by de Vries.
1721: Czar Peter the Great becomes Russian Emperor.-Sustainability by de Vries.
1713: ‘Nachhaltende Nutzung’ (sustainable use) is first introduced in Germany due to the threat of wood shortages.-Sustainability by de Vries.
1662: Introduction of Boyle's law; “when the temperature of a given mass of confined gas is constant, the product of its pressure and volume is also constant;” P1V1 = P2V2.-Sustainability by de Vries.
72: Construction of the Colosseum in Ancient Rome begins under Emperor Vespasianus. It is inaugurated in 80 by his son Titus, with 100 days of games and ~10K beasts being killed.-Sustainability by de Vries.
63 BCE: Roman General Pompey conquers Syria, raising the state’s budget to 340M sesterces.-Sustainability by de Vries.
130 BCE: Rome annexes the Kingdom of Pergamon, doubling the state’s budget, from 100M-200M sesterces.-Sustainability by de Vries.
167 BCE: Roman forces seize the treasury of the King of Macedonia, allowing them to eliminate taxation of themselves.-Sustainability by de Vries.
221 BCE: China is unified under the king of the State of Ch'in.-Sustainability by de Vries.
1900-1400 BCE: Late phase of the Indus Valley Civilization, in which it mysteriously disappears.-Sustainability by de Vries.
2000- 500 BCE: The Maya are the most advanced civilizations in the Meso-America’s Yucatán Peninsula. The peninsula had significant gradients in elevation, soil thickness, rainfall and water accessibility. Three river basins on the peninsula provided transition zones – or ecotones – which created and sustained cultural diversity.-Sustainability by de Vries.
2200 BCE: The 4.2 kiloyear (4.2K) event; a severe long-term drought, the most severe climatic event of the Holocene epoch, is hypothesized to have caused the collapse of the Old Kingdom of Egypt (due to a series of civil uprisings) as well as the Akkadian Empire in Mesopotamia, and the Liangzhu culture in the Lower Yangtze River Area. Drought may also have initiated the collapse of the Indus River Valley Civilizations, with some populations moving SE as well as the migration of Indo-European speaking people into India (Wiki).-Sustainability by de Vries.
2250-2150 BCE: A prolonged dry period strikes the Middle East and N. Africa, bringing a series of consistently low floods and more than half a century of famine.-Sustainability by de Vries.
2800-1900 BCE: Mature phase of the Indus Valley Civilization, characterized by a period of at least a dozen large cities. A variety of crops were grown, including rice and cotton, and there were extensive metal mining and smelting activities.-Sustainability by de Vries.
3100-2800 BCE: Early phase of the Indus Valley Civilization, characterized by early farming communities and pastoral camps.-Sustainability by de Vries.
3200 BCE: Unification of Egypt and the rise of the Old Kingdom.-Sustainability by de Vries.
6 Ka: The city of Uruk extends >100 ha. Rural peasant families produce foods such as wheat, barley, vegetables, milk, meat and the flax, wool, hides, dung, reeds, clay for nonfood needs such as clothing and housing.-Sustainability by de Vries.
0900, 4004 BCE: Creation of Earth, according to Irish Prelate Ussher.-Sustainability by de Vries.
12 Ka: Agriculture originates in the so-called Levantine Corridor, near the Jordan valley lakes, in the form of the domestication of cereals and pulses.-Sustainability by de Vries.
____________________________________________________________________
